SOUNSoundHound AI — Company Overview and Latest Developments (July 2025)
What Is SoundHound AI?
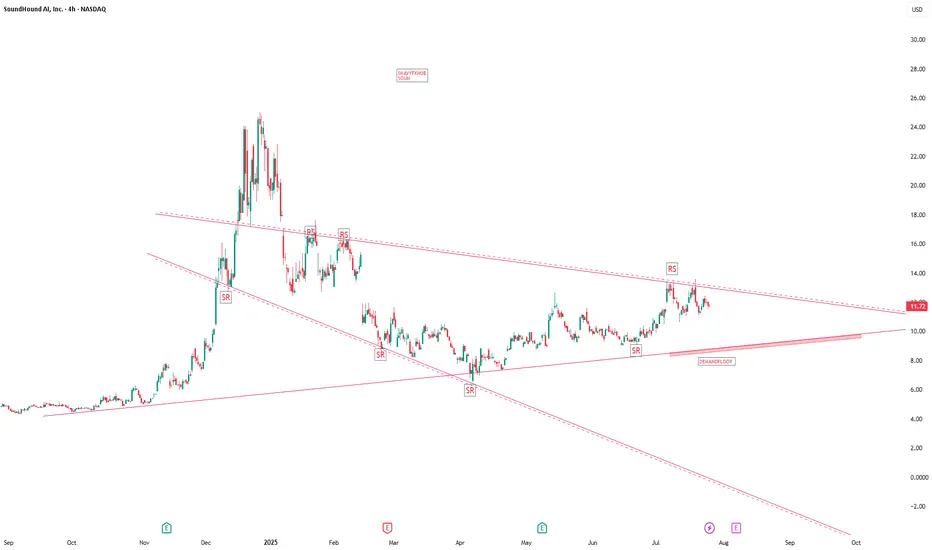
SoundHound AI, Inc. (Nasdaq: SOUN) is a leading voice artificial intelligence (AI) company headquartered in Santa Clara, California. Founded in 2005 by Stanford graduates, it has evolved from music recognition app Midomi (later rebranded SoundHound) to a global innovator in conversational voice AI.
What Does SoundHound Do?
The company develops an independent voice AI platform that powers conversational interfaces for businesses across automotive, TV, IoT, restaurant, customer service, healthcare, retail, finance, and more.
SoundHound's platform allows enterprises to create custom voice assistants, voice-enable products, deliver hands-free customer service, and gather valuable conversational analytics.
Key Products and Technologies
Product/Technology What It Does
Houndify Platform Suite of APIs, SDKs, and tools for building custom voice and conversational assistants for enterprise, auto, and consumer tech.
SoundHound Chat AI Advanced conversational assistant integrating generative AI and real-time data (weather, stocks, restaurants, etc.).
Smart Ordering AI-driven ordering for restaurants (drive-thru, kiosk, phone, and in-car).
Dynamic Drive Thru End-to-end voice interactions for fast-food and QSR environments.
Smart Answering Automated, always-available phone agent for customer calls.
Voice Commerce Ecosystem for ordering, payments, and pickup, notably powering new in-vehicle ordering.
Employee Assist AI agent to help staff with information, ordering, and support tasks.
Tech Stack Proprietary Speech-to-Meaning®, Deep Meaning Understanding®, Natural Language Understanding (NLU), ASR, TTS, Edge/Cloud.
Supports 25 languages and holds over 250 patents in conversational AI technologies.
Branded wake words, cloud/edge integration, and automatic content recognition are key differentiators.
Recent News & Major Highlights (2025)
CES 2025 Launch: Unveiled the industry’s first in-vehicle voice assistant enabling on-the-go food ordering—lets drivers order and pay for meals directly from car infotainment systems.
Restaurant Industry Expansion: Live demos at the National Restaurant Association Show showcased drive-thru, phone, kiosk, and in-car voice ordering, with AI now powering ordering in 10,000+ restaurant locations.
Acquisitions: Recently acquired Amelia (enterprise automation software) and Synq3 Restaurant Solutions, boosting its capabilities and reach in both enterprise and hospitality sectors.
Automotive & Enterprise Traction: Now in 20+ auto brands and sectors like healthcare, finance, and utilities, with strategic partnerships like OpenAI-powered voice AI in Stellantis vehicles.
Financial Growth: Company reports strong cash position ($200M, no debt), expects EBITDA positivity by year-end, and projects robust growth with expanding voice commerce opportunities.
Revenue Model and Growth
SoundHound's business relies on royalty licensing (hardware voice enablement), recurring subscriptions (for services like restaurant AI), and voice commerce (cut from voice-enabled orders), with growing adoption in cars, devices, and quick-service restaurants.
Summary:
SoundHound AI is a top player in the conversational AI space, voice-enabling products and services for enterprises worldwide, especially in automotive, retail, and hospitality. Its latest innovations—like in-car food ordering and expanded restaurant solutions—reflect aggressive growth and increasing real-world impact for AI-powered voice technology
Community ideas
S - SONIC 1DSonic lacks the buying volume to break through its resistances.
The project, after a name change, has become Matic 2.
I expect that we'll soon reach support levels of 30 cents and 25 cents after the pullback is complete. If these supports are broken, the next support levels will be 20 cents and 17 cents.
If the 40 to 43 cent resistance breaks with high volume, there's a possibility of growth to 50 cents. If 50 cents is broken, growth to 63 cents becomes possible.

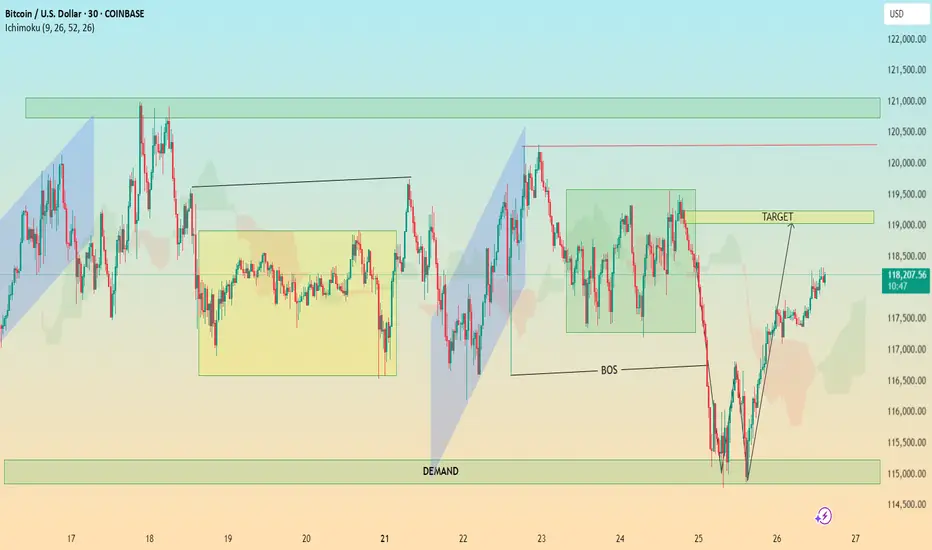
BTC In-Depth Technical Analysis: BTC/USD (30-Min Chart)🔍 In-Depth Technical Analysis: BTC/USD (30-Min Chart)
🟩 1. Demand Zone Reaction
Location: ~$114,500 – $115,500
Significance:
Price sharply reversed after a strong move into this demand zone.
This zone coincides with a liquidity grab below previous lows — textbook Smart Money trap.
Volume (if checked) would likely spike here, indicating institutional interest.
✅ Interpretation: Institutional demand stepped in, absorbing sell orders and triggering a reversal.
📉 2. Break of Structure (BOS)
Zone: Around July 24–25
Price broke below a key higher low, signaling temporary bearish structure.
However, this was quickly reclaimed after demand zone reaction — suggesting a fakeout BOS or a liquidity sweep.
✅ Interpretation: BOS caused shorts to enter, but reversal suggests a bear trap and continuation higher. The BOS served to fuel a more aggressive bullish rally.
🎯 3. Target Zone
Marked Target: ~$118,900–$119,200
Why This Area?
It aligns with a previous consolidation zone / supply before the sharp drop.
Also overlaps with Ichimoku cloud resistance and previous highs — strong confluence.
✅ Interpretation: Price is likely to face resistance here. If broken with strong momentum, bullish continuation to the next supply zone (~$121K) is possible.
⛓️ 4. Market Structure Analysis
Higher Lows Forming after demand reaction.
Price is forming a bullish market structure with an ascending wave pattern.
A break and retest of the $119K zone could lead to a mid-term rally.
Failure to break could result in:
A pullback to the $117,000 area
Or a deeper retest of the demand zone
✅ Trading Plan Options:
Bullish Bias: Buy pullbacks above $117,000 with $119,000 as target
Bearish Bias: Wait for strong rejection at $119,000 to short back to $115K
☁️ 5. Ichimoku Cloud Insight
Price has moved above the cloud, suggesting momentum shift to the upside.
The cloud is twisting bullish, supporting short-term bullish trend.
However, flat Kumo tops around $119K = likely rejection zone.
✅ Interpretation: Ichimoku confirms bullish potential, but price must close above the cloud + $119K zone to sustain trend.
📌 Key Takeaways for Publishing
Chart Idea Title:
“BTC/USD Demand Zone Reversal | Break of Structure & $119K Target in Sight”
Summary Description:
Bitcoin has reclaimed bullish momentum after a sweep into the $115K demand zone. A break of structure triggered shorts, but demand absorption led to a sharp reversal. Now, price is approaching the key $119K supply zone — a critical level that could determine if this is a short-term rally or the beginning of a new trend. Watch for either a clean breakout or a rejection for a possible retest of $117K or lower. Confluence from Ichimoku, BOS, and market structure support the analysis.
Structural and Technical Analysis of Crypto + BTC + Altcoins + TStructural and Technical Analysis of Crypto + BTC + Altcoins + Totals + Dominance
🔔 Follow me & smash that rocket 🚀 if you find this useful! Let's ride the next wave together!
🕒 Timeframe: 4H
🧠 Strategy: Customized Dow Theory + Structural
---
🟡 A critical moment for the market:
Many coins, including top 10 alts, are currently sitting on major key levels. Yes, you can go long — but only IF volume supports the move.
📈 That means we must keep an eye on:
TOTAL, TOTAL2, TOTAL3
BTC.D, USDT.D
---
💎 Bullish Trigger Conditions:
✅ BTC.D must show strong red candles (dominance falling)
✅ USDT.D must break below 4.22-4.23 (money flowing out of stablecoins)
✅ TOTAL must break 3.85T
✅ TOTAL2 must break 1.48T
✅ TOTAL3 must break 1.05T
🔴 If all these confirm, it could be a great trigger to enter alt positions.
---
🔍 BTC Outlook
As previously mentioned:
🟥 If sellers want BTC below $115K, they need to break it fast and sharp — slow breakdowns won’t work due to buyer activity.
🟨 Bullish trend requires a break above $120K.
📊 Most likely scenario? Ranging between $115K - $120K
⚠️ BTC Dominance plays a key role here. If dominance drops while BTC ranges, alts could explode.
---
💸 USDT.D Critical Level:
A clean breakdown of 4.23 on USDT.D = 🚀 Funds rotating into alts
---
✅ Coins To Watch (Long Setup Only IF Above Conditions Hold):
♦️BNB
enter:741.00
Sl: 786.13
♦️ETH
enter:3750
Sl: 3480
♦️SUI
enter:4.10
Sl:3.40
♦️XRP
enter:3.25
Sl:2.92
♦️LINK
enter: 18.60
Sl: 17.4
♦️AAVE
enter:295
Sl:276
♦️ADA
enter:0.8405
Sl: 0.7628
♦️SOL
enter: 192.40
Sl:177
♦️DOGE
enter:0.249
Sl:0.220
🔁 Note: First SUI trigger was 3.80 — next key level is 4.10.
---
⚠️ Important Notes:
Today is Saturday, expect low volume
Manage risk ⚠️ and avoid aggressive Martingale strategies
High chance of fake breakouts
Levels being tested might just be lower highs in a bearish structure
❗️Even for bearish continuation, volume increase is key
---
🟢 If you liked this post, don’t forget to Follow & Hit the 🚀 Rocket to stay updated on live setups and strategic insights!
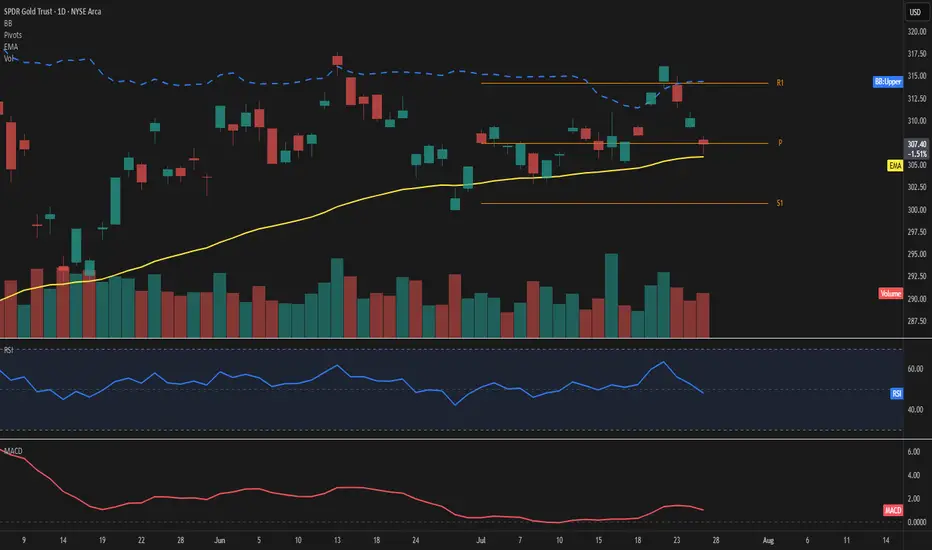
GLD – Price consolidates at highsPrice is hovering just above the 50-day EMA at 307, showing signs of short-term hesitation near the Fibonacci pivot. The upper Bollinger Band sits at 314, leaving moderate room for expansion if momentum picks up.
The RSI reads 48, reflecting a balanced setup without clear directional bias. MACD remains slightly positive, suggesting a still-constructive but soft momentum.
Key levels to watch include the pivot at 307 and the support at 301. On the upside, the 314 area aligns with both R1 and the upper band, acting as the next challenge.
Volume is up sharply (+22%) despite a mild -0.9% price pullback, indicating possible accumulation beneath the surface.
As long as price holds above the 50-day EMA, the structure remains intact.
A move away from the pivot zone will likely define the next directional wave.
TONUSDT Analysis – Trendline Breakout | Liquidity| Arc + Target📈 Chart Summary:
The TONUSDT 30-minute chart presents a clean smart-money setup after a trendline breakout, volume absorption, and liquidity fill, supported by a beautifully formed ARC accumulation pattern. This structure hints at institutional involvement and a strategic roadmap for the next probable moves.
🔎 Technical Components Breakdown
1️⃣ Trendline Breakout – Shift in Structure
Price had been following a descending trendline with multiple touches, establishing bearish market structure.
Eventually, that trendline was violently broken to the upside, signaling a change in character (CHOCH) – one of the first signs of a potential bullish reversal.
The breakout candle was strong, with a wide body and notable bullish volume. This often indicates institutional interest or engineered breakout via a stop-hunt.
2️⃣ Volume Absorption – Smart Money Accumulation
After the breakout, the price didn't immediately rally. Instead, it consolidated with wicks on both sides – a sign of volume absorption.
This is where smart money absorbs opposing orders, typically absorbing sellers before a larger directional move.
This consolidation confirmed the idea of liquidity engineering – they trap liquidity (shorts) and use it as fuel.
3️⃣ Liquidity Filled – Stop Hunt Behavior
A sharp wick into previous highs grabbed resting liquidity, filling orders and sweeping stop losses.
This action invalidated weak resistance, setting up the platform for a larger move.
🧠 Conceptual Structure – ARC Play & Reversal Dynamics
✅ ARC Formation – Rounded Accumulation Base
The light green arc highlights the rounded bottom, a common technical pattern representing accumulation over time.
This kind of base often indicates that smart money is building positions silently, especially after a significant downtrend.
In this context, the ARC acts as a dynamic support, and the structure mimics the reversal of market sentiment from bearish to bullish.
🌀 FMFR Zone – “First Move Fake, Then Reversal”
Labeled FMFR zone between 3.22–3.26 signifies a potential trap setup.
The expectation is a manipulated downward move (fakeout) that will be quickly reversed, catching breakout sellers off-guard.
Smart traders can use this as a high-probability re-entry zone by waiting for wick rejection, engulfing candles, or bullish divergences.
📍 Short-Term Targets & Zones
🟩 Next Mini Reversal Zone – 3.38 to 3.42
This is a probable area for minor pullback or distribution, especially for scalpers or short-term trades.
Price may stall here due to earlier supply and psychological round levels.
🟦 Remaining Liquidity Zones – 3.55 to 3.63
Higher timeframe liquidity remains uncollected above.
If bullish momentum continues with support from volume and structure, expect price to sweep these levels next.
These zones are ideal for medium-term swing targets.
🧾 Trade Setup Idea (Not Financial Advice)
Item Details
Entry On rejection/confirmation within FMFR zone (3.22–3.26)
Stop-Loss Below arc support or structural low (3.18 area)
TP1 3.38 (Mini reversal zone)
TP2 3.55 (Liquidity target 1)
TP3 3.63+ (Extended target)
📘 Market Psychology in Action
Fear/Greed Play: Initial selloff invited fear, smart money accumulates quietly via the arc. Fakeout traps greed and late shorts.
Trap-Reversal Model: FMFR zones exploit retail stops, offering entries for institutional players.
Liquidity Mapping: The chart clearly maps how price is attracted to uncollected liquidity zones – a classic order flow approach.

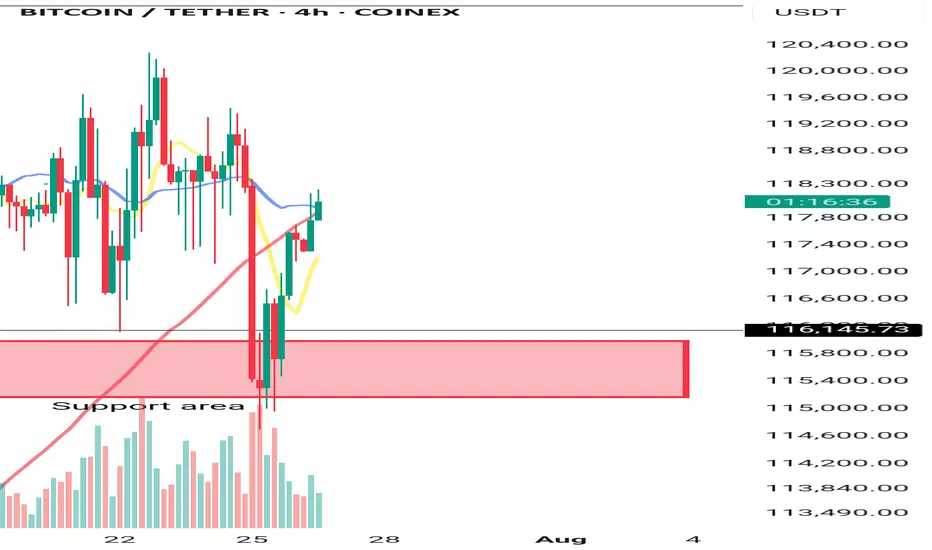
BTC Consolidates Below 119,300 Over the Weekend💎 BTC WEEKEND PLAN UPDATE (26/07)
NOTABLE BTC NEWS
The cryptocurrency market is attempting to stabilize after a wave of sell-offs during Friday’s Asian session, when Bitcoin (BTC) dropped to an intraday low of $114,723. A recovery trend is gradually strengthening, with BTC trading at $115,868 at the time of writing, indicating that buying interest at lower levels may increase in upcoming sessions.
TECHNICAL ANALYSIS PERSPECTIVE
Symmetrical Triangle Pattern
BTC is currently fluctuating within a symmetrical triangle pattern, with converging upper and lower trendlines. This pattern typically signals a strong consolidation phase before a decisive breakout.
Scenario unfolded as planned:
• The price failed to break the resistance zone around $120,000 (previously forecasted as a likely failed breakout zone).
• BTC then dropped sharply to the support zone around $115,000, touching the lower trendline and the potential breakout zone.
• At this level, the price rebounded as expected, indicating strong buying pressure at support.
MA lines supporting the trend:
• The price is currently moving around the 200-day MA (red line), showing that the dynamic support is working effectively.
• The 50-day MA (yellow line) is acting as short-term resistance. If broken, it could support the recovery momentum.
Two potential upcoming scenarios:
🔼 If BTC breaks above the $119,500 – $120,000 zone with strong volume, it may continue to test higher levels around $123,000 – $125,000.
🔽 Conversely, if it faces strong rejection around $119K and turns downward, BTC may retest the support zone at $114,000 – $115,000 once again.
Stay tuned to the channel for the latest and continuous updates on XAUUSD, CURRENCIES, and BTC.

USOIL LONG FROM SUPPORT
USOIL SIGNAL
Trade Direction: long
Entry Level: 65.00
Target Level: 66.37
Stop Loss: 64.09
RISK PROFILE
Risk level: medium
Suggested risk: 1%
Timeframe: 2h
Disclosure: I am part of Trade Nation's Influencer program and receive a monthly fee for using their TradingView charts in my analysis.
✅LIKE AND COMMENT MY IDEAS✅

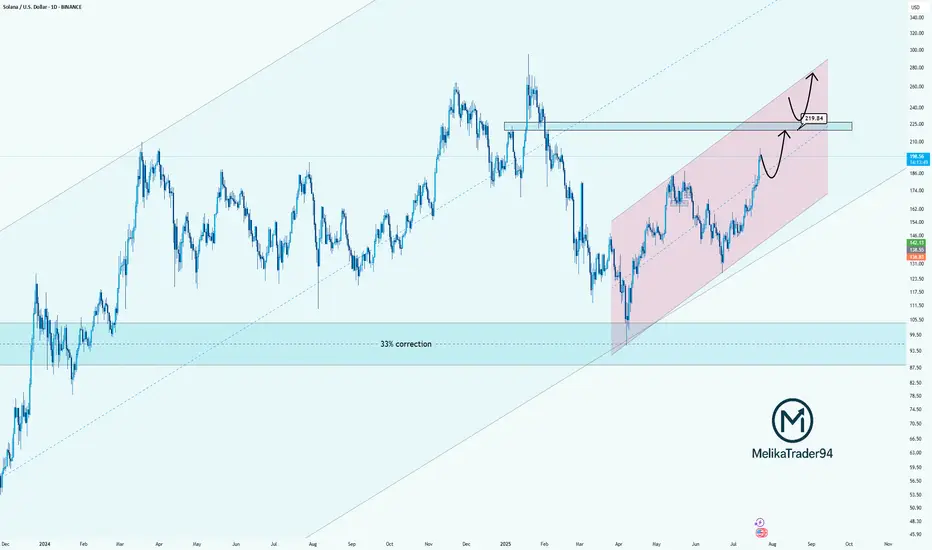
Solana Approaching Key Resistance: watch for $219Hello guys!
Solana has been trending strongly inside a rising parallel channel, recovering steadily after a significant 33% correction. The bullish momentum is clear, and the price is now approaching a key resistance zone near $219.84, which previously acted as a major turning point.
Here’s what I’m watching:
Strong uptrend within the pink channel shows controlled and healthy growth.
$219.84 is a critical decision zone. Price could:
React with a pullback before pushing higher,
Or break through it and flip the level into support for the next bullish leg.
The reaction in this zone will determine the next structure.
Whether we see a temporary correction or continuation to new highs.
SOL/USDT Technical OutlookPrice may push higher towards the $194 resistance zone.
From there, a sharp rejection is expected, targeting the $171 support area.
If the market fails to hold $171, the next potential downside target lies around $140.
Key Levels:
Resistance: $194
Support: $171, then $140
Structure: Rising channel breakdown in play
📉 Bearish scenario activated if $171 fails to hold.

ondo bullish🔹 Harmonic Pattern (Possibly a Gartley or Bat)
The chart shows a clear ABCD pattern, suggesting a potential reversal zone around point D.
• A → B → C → D structure is visible.
• Based on Fibonacci ratios:
• AB ≈ 0.75 retracement (close to Bat or Gartley pattern)
• BC ≈ 1.32 extension, which also fits harmonic rules
📌 Point D is around 1.1077, which is likely a resistance/reversal area.
⸻
🔹 RSI (Relative Strength Index)
• RSI is around 50, indicating neutral momentum (not overbought or oversold).
• It’s starting to curve upward, which could signal a build-up in buying strength.
⸻
🔹 MACD
• A bullish crossover is visible (MACD line crossing above the signal line).
• Histogram turning positive = early bullish signal.
⸻
🔹 Summary & Trade Scenarios
✅ Bullish Scenario:
• If price breaks above 1.1077 with strong volume, it may target 1.15 or higher.
• Confirmation needed: candle close above D zone (1.1077) with volume support.
❌ Bearish Scenario:
• If price retests 1.1077 and fails, it might reverse toward support around 1.00 or even 0.95.
• Watch for bearish divergence or rejection candles near D.
⸻
🎯 Suggested Strategy:
• Long setup: If price breaks and holds above 1.108, target 1.15, stop-loss below 1.05
• Short setup (more conservative): If price rejects from 1.1077, consider short with target 1.00

ICL on the Daily TFScrip is currently at around 87. Took a correction of 0.382 Fib level and moving up and there is a potential Bearish ABCD Reversal pattern Point D at around 109-110.lets c how it plays further, hopefully InSha Allah.

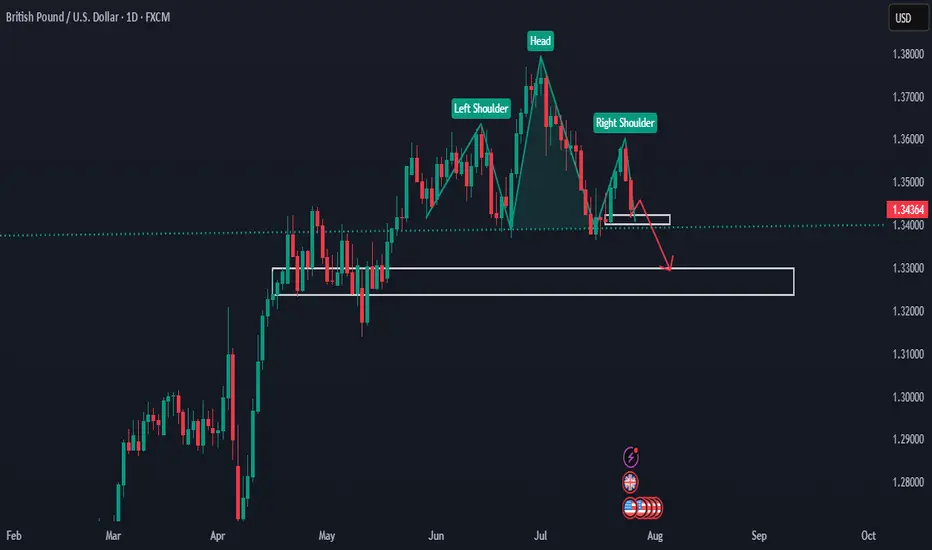
GBP Forming Head & Shoulders - Possible Bearish Scenario AheadHello traders!
As you can see, price has formed a Head and Shoulders pattern on the daily chart.
If it breaks below the current support/demand area, it could move lower toward the 1.32000 – 1.33000 zone.
We’ll be watching closely to see what it does in the coming weeks.
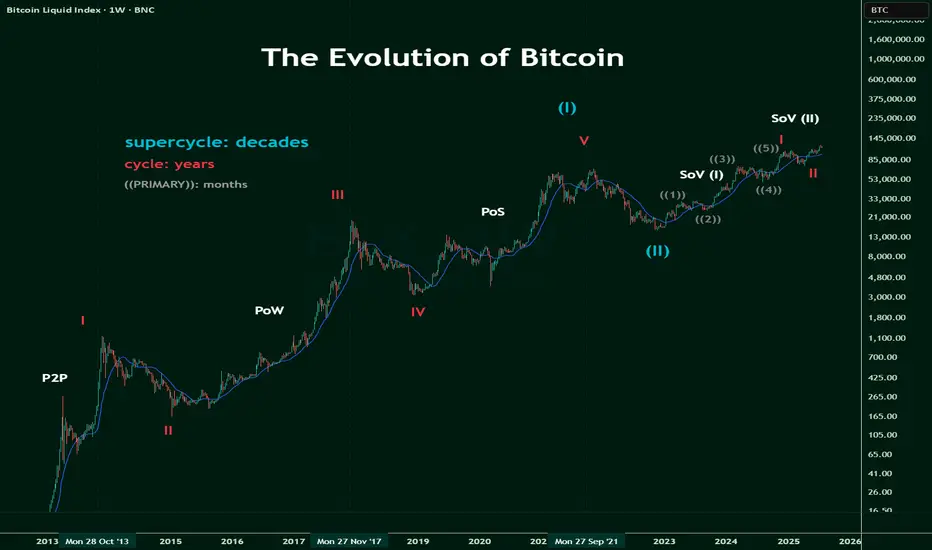
The Evolution of BitcoinNot Financial Advice
Born in 2009, bitcoin was a proof of concept out of an esoteric online forum.
It was intended as a secure, swift, P2P solution to transact on a global stage without global scrutiny nor supervision.
Sure it worked, but would it last?
Then Proof of Work, PoW , showed it's efficacy and prowess as years quickly approach a decade's worth.
It's value was recognised as the world gets stunned by CRYPTOCAP:BTC 's rally.
But then crypto winter came.
So did Ethereum, but this was to be Bitcoin's catalyst.
Programmers soon carved DeFi niche propelling Bitcoin's value as a staked token, by 'bridging' the asset onto Ethereum, where a slew of financial products and Dapps began to fight for dominance.
The world of Proof of Stake, PoS , began to take shape, cementing itself as the perfect complementary power to Bitcoin's security.
Of course, where there is money, bad actors appear, causing CRYPTOCAP:BTC to tumble as rugs get pulled and users are caught in the turmoil of poor regulation.
But regulators caught up and has since given the industry a fresh wind for its sails.
Institutions pile in, eager to avoid mass adoption, and Bitcoin cements itself as a Store of Value (SoV).
To note that there will be multiple stages for this SoV, as the first stage was the acceptance from corporations that Bitcoin is safe: SoV (I).
Cue SoV (II) today where blue chips and central banks are circling bitcoin, tempted to bite.
And the final form, SoV (III) will be the day when bitcoin is simply, ubiquitous.
Ethereum Bitcoin pair bottom confirmed!As confirmed by CRYPTOCAP:ETH \ CRYPTOCAP:BTC momentum, we can say that a local bottom was seen at 2019 accumulation levels. With a major reversal from the current region, we can see major movements across Altcoins, with Ethereum being an undeniable leading force and leader for altcoins.

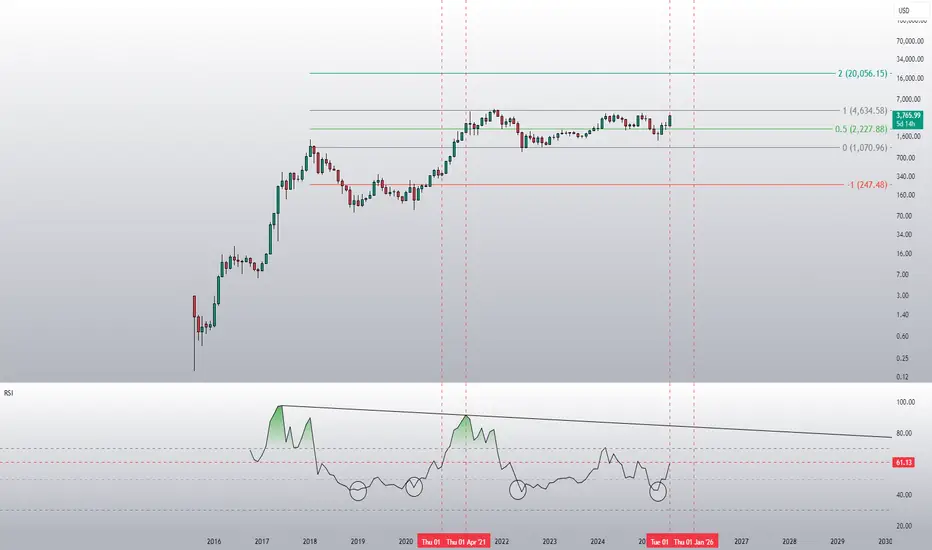
ETH is about to go parabolicDid people realise that Ethereum hit its historical lows on the monthly RSI in April this year? Some people are laughing at the idea of a target of 20k this year, but that would only represent a 20x increase from 2022 to 2025. In contrast, Ethereum achieved a 60x increase from 2018 to 2021.
USDJPY Breakout and Potential RetraceHey Traders, in today's trading session we are monitoring USDJPY for a buying opportunity around 146.300 zone, USDJPY was trading in a downtrend and successfully managed to break it out. Currently is in a correction phase in which it is approaching the retrace area at 146.300 support and resistance area.
Trade safe, Joe.

Market Structure is Not Strategy — It’s Your Starting Point“The chart doesn’t hide anything. But your mind does.”
Before any indicator, setup, or signal… comes structure.
🔍 What is Market Structure?
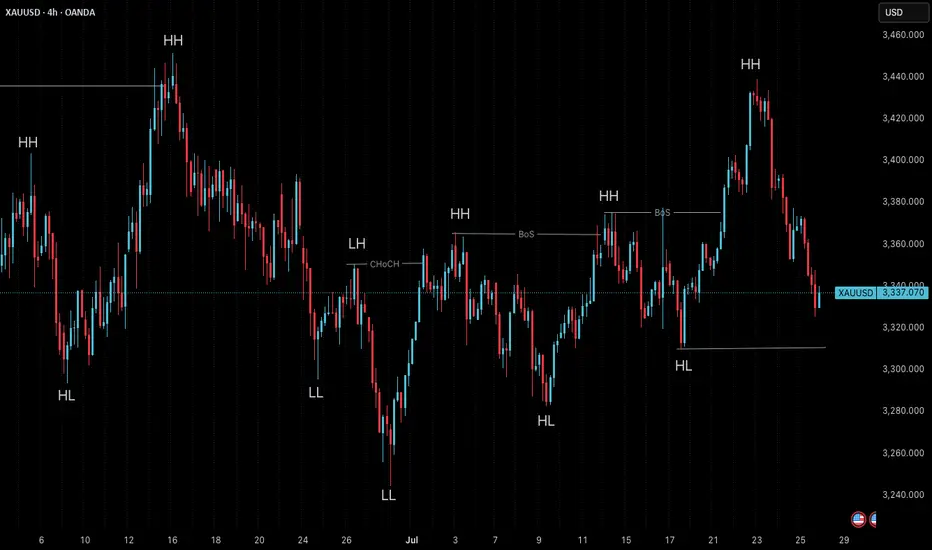
At its core, market structure is the sequence of higher highs (HH) and higher lows (HL) in an uptrend, or lower lows (LL) and lower highs (LH) in a downtrend.
It is the skeleton of price .
Everything else — entries, zones, signals — is just clothing.
If you can’t see the skeleton, you’re reacting to noise.
🎯 Why It Matters:
It’s not a signal. It’s context .
It tells you whether you’re trading with the market or against it .
It defines where your patience begins — not where your entry is.
Market structure helps you let go of the urge to chase. It brings order to the chaos.
🧩 Key Components to Track:
Break of Structure (BoS): Confirms trend continuation
Change of Character (ChoCH): Signals a potential reversal
Swing Points: Define the intent behind price moves
Liquidity Sweeps: Often mask real structure beneath short-term traps
🛑 Common Mistake:
Most traders jump straight to the setup without asking the most important question:
“Where am I in the structure?”
They try to buy a pullback — in a downtrend.
They try to fade a move — right before continuation.
They chase candles — instead of waiting for alignment.
That’s not strategy. That’s stress.
🛠 Tip to Practice:
Use this simple framework to build clarity:
Start from the H4 chart — this gives you the broader directional bias
Drop to M15 — here’s where structure begins to form tradeable setups
Finally zoom into M1 — this is where confirmation happens before entry
Ask yourself:
Where did the last BoS or ChoCH happen on each timeframe?
Is M15 aligning with H4 intent — or contradicting it?
Did you enter after M1 confirmation , or based on impulse?
You don’t need to predict price. You need to align with it.
🪞 Final Thought:
Structure isn’t strategy.
It’s the mirror that shows what’s real before your bias speaks.
When you master structure, you stop forcing trades — and start flowing with them.
💬 Want more like this?
If this post resonated with you — drop a comment below.
Let me know what you'd like to dive deeper into — price action, gold setups, market structure, or the psychology behind your trades.
I’ll build future tutorials based on what matters to you.
📘 Shared by @ChartIsMirror
SILVER Analysis - Can buyers push toward 4,100$?TRADENATION:XAGUSD is trading within a clear ascending channel, with price action consistently respecting both the upper and lower boundaries. The recent bullish momentum indicates that buyers are in control, suggesting there's chances for potential continuation on the upside.
The price has recently broken above a key resistance zone and now came back for a retest. If this level holds as support, it would reinforce the bullish structure and increase the likelihood of a move toward the 4,100 target, which aligns with the channel’s upper boundary.
As long as the price remains above this support zone, the bullish outlook stays intact. However, a failure to hold above this level could invalidate the bullish scenario and increase the likelihood of a deeper pullback.
Remember, always confirm your setups and use proper risk management.
Disclosure: I am part of Trade Nation's Influencer program and receive a monthly fee for using their TradingView charts in my analysis.

XAUUSD - SHORT TO $2,900Gold sellers have now pushed down to where price opened on Monday, turning the weekly candle bearish. A huge move down, compared to where price was at on Tuesday high!

XRP: Double zigzag correction scenario for Jun/July 2025 impulseA possible double zigzag pullback scenario correcting June & July's impulsive breakout, upon which normies & bears might say "head & shoulders" but then it climbs the wall of worry for a massive Wave 3 parabola.

EURUSD : Status @ 25/7Direction: Sell
Signal triggered: 25/7/2025
Stop when:
a) Stop Loss @ 1.1790; or if
b) Buy signal triggered
Action:
Sell the rally
Good luck.
P/S: It seems that 1.1790 is a good resistance line as anticipated. The price may reach as low as 1.1500, which will serve as the next support level. Then we wait there for the next sell or maybe buy signal!
And a BIG congratulation to those who sold @ D - 1.1780 :-)
