BITCOIN PREDICTION - MASSIVE CANDLE INCOMING!!! (WARNING) Watch this Bitcoin Prediction video now, you will love it!
Yello, Paradisers! Big warning sign: #Bitcoin is about to liquidate more traders soon if we get these confirmations that I'm sharing with you in this video. Loads of people will get wrecked again. Be careful not to get trapped into fakeouts.
In this video, I'm describing exactly what I'm seeing on Bitcoin, what patterns I'm waiting to form, and what confirmations I want to see before being able to say with 100% accuracy guaranteed that MARKETSCOM:BITCOIN is moving in that direction.
I'm sharing with you all the important targets and also how professional trading works: how risk-reward proper ratio trading works, and how high-probability trading depends a lot on how you choose to create your trades.
Watch this Bitcoin prediction to understand what I'm seeing right now on the chart and how I'm acting and making my decisions.
Community ideas

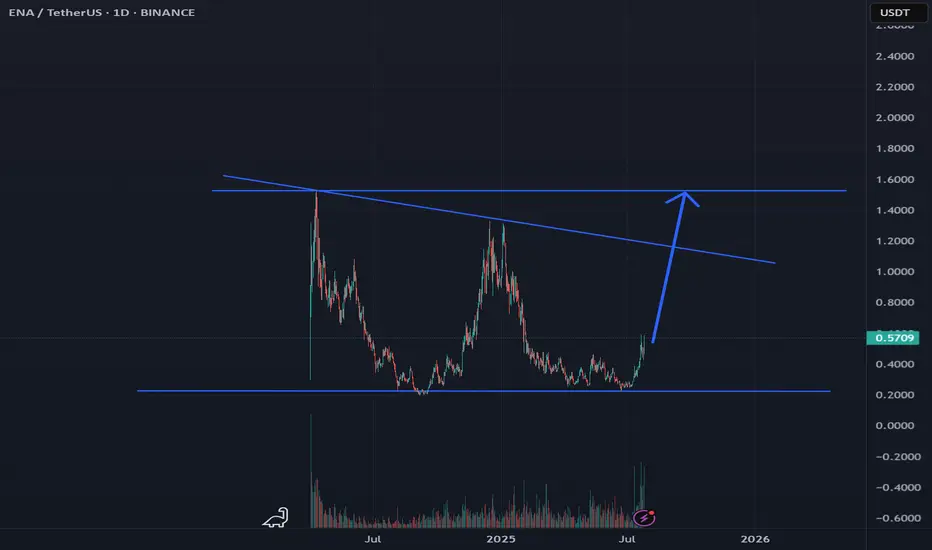
ENA Coin Forms a W Pattern: Reversal Potential GrowsOn the global chart of the ENA coin, a W pattern is forming, indicating a possible reversal and growth. It is worth noting that since the launch, the coin has not yet realized its full potential.
Current price: $0.56
If the pattern is realized, a movement to the $0.58 zone is expected and in the case of an increase in momentum to $0.73
Also, according to the structure of the pattern, a correction to the $0.43 region is possible before continuing the upward movement
This analysis is based on the technical pattern and also incorporates AI to provide more accurate results.
BCH/USD Chart Analysis: Higher Highs Fuel Bullish Outlook
Price is riding the upper half of the Bollinger Band.
Price recently bounced from the middle band, a bullish continuation signal.
Multiple bullish candles with small upper wicks, showing buyers are in control.
Recent pullbacks have been shallow, indicating strong buying interest on dips.

PLTR is doing it... pullback honeyThis video has my thoughts about PLTR and a trading view tip... the data window!!! Who knew?
Hope the talk inspires you as you decide on future investments; especially when it's stalling or pulling back.
My short term bias is bearish for a pullback on PLTR. Not sure when it will happen, but <155 is my trigger to see what I see.
What do you see?
**>162... slow your roll to see if 160 holds.

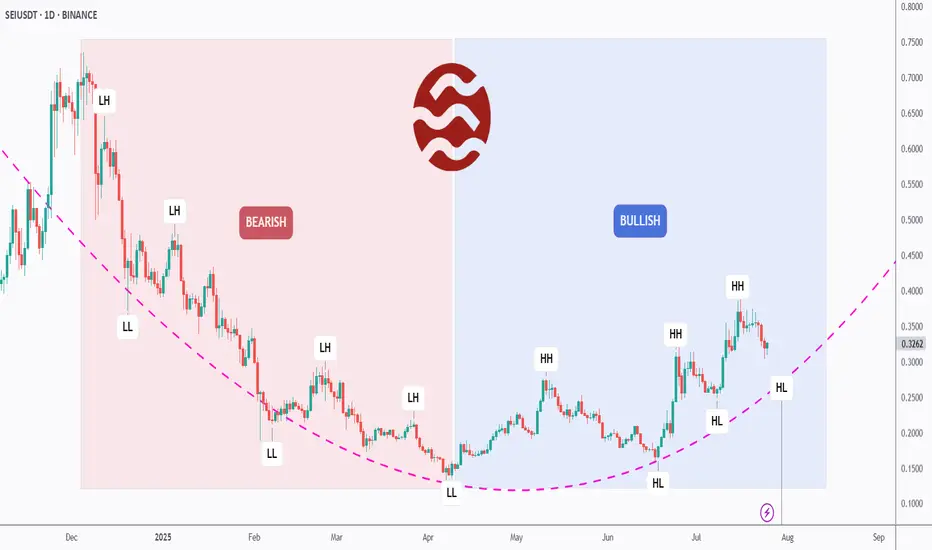
[Deep Dive] SEI – Edition 2: From Pain to Power: A Bull Cycle?SEIUSDT may have just flipped the script.
After months of consistent lower highs and lower lows, SEI has officially broken its bearish structure and is now printing clear higher highs (HH) and higher lows (HL) — a textbook sign of a trend reversal.
📉 Left Side: Bearish Breakdown
From late 2023 to Q2 2025, SEI was stuck in a painful macro downtrend. The structure was brutally clean: LH → LL → LH → LL. Each bounce was weaker than the last, reflecting exhausted buyers and relentless supply.
But something changed in late Q2…
📈 Right Side: Bullish Rebuild
Since its final low around April, SEI began to carve a new path. What started as a subtle accumulation quickly morphed into a solid structure of higher highs and higher lows.
The arc-shaped pink trendline tracks this momentum shift — and we’re now watching a potential continuation of the bullish cycle.
The most recent HL is forming exactly on that curve — a critical moment where bulls may step in for the next impulsive move.
🔥 What’s Fueling the Shift?
SEI is gaining traction as a high-performance Layer 1 designed for trading apps, with native parallelization and a focus on speed and throughput.
Its recent ecosystem growth — including projects in DeFi, gaming, and infrastructure — has started to attract both retail and VC attention.
On-chain metrics are showing increased activity, and whispers of upcoming protocol incentives could be the spark that pushes SEI toward the $0.45–$0.50 range.
🧠 What We’re Watching
- The current HL zone — will bulls defend this level?
- If SEI can break above the previous HH, the bullish structure strengthens.
- A failure to hold this HL would suggest a range or even deeper correction — so risk management is key.
Let’s recap:
- Structure has flipped bullish ✅
- SEI is riding a fresh higher low ✅
- Fundamental momentum is building behind the scenes ✅
It’s now up to the market to decide if this was just a bounce — or the beginning of a much bigger move.
💬 What do YOU think: Is SEI building steam for a breakout, or just teasing us with a fakeout?
🔔 Disclaimer: This analysis is for educational and informational purposes only. It does not constitute financial advice or a recommendation to buy or sell any asset. Always do your own research and manage your risk accordingly.
📚 Always follow your trading plan => including entry, risk management, and trade execution.
Good luck!
All strategies are good, if managed properly.
~ Richard Nasr
Gold remains in a bearish trendGold followed our previous analysis closely, rejecting from the strong resistance level at $3430, confirming bearish momentum. This rejection has opened the door for a potential move toward the 3400 level, and further downside is likely.
Gold remains in a bearish trend. A temporary pause or minor consolidation may occur, but the overall direction remains to the downside. This week, markets are watching the outcome of the ES–US agreement closely. If a resolution is reached, it could strengthen the USD and increase risk appetite—potentially pushing gold even lower.
We expect gold to remain under pressure unless major market sentiment shifts. A break below 3400 could accelerate the drop toward 3322.
You May find more details in the chart.
Ps Support with like and comments for better analysis Thanks.

Lingrid | USDJPY Potential Channel Breakout. LongFX:USDJPY is retesting the breakout zone after reclaiming support from a prior swap area near 146.9. Price action has broken above a downward trendline and is forming a bullish retest structure. As long as USDJPY holds above 146.920 zone, the setup favors a continuation toward the resistance barrier. A breakout above the red descending trendline could accelerate upside momentum.
📉 Key Levels
Buy trigger: Break and hold above 147.500
Buy zone: 146.900 – 147.000
Target: 148.250
Invalidation: Break below 146.000
💡 Risks
Failure to break the descending red trendline may trigger renewed selling
Consolidation below resistance could signal buyer exhaustion
Break below 146.000 would invalidate bullish retest setup
If this idea resonates with you or you have your own opinion, traders, hit the comments. I’m excited to read your thoughts!

2025 Is a Big Year for Bitcoin Miners—Who’s Winning the Hash War
Bitcoin’s resurgence in 2025 has reignited the mining race. The halving came and went, hashprice bounced from the abyss, and a fresh wave of capital is pouring into the space. So we figured: time to catch you up on who’s making real moves and pulling ahead — both in market cap and megawatts.
⚡ CleanSpark (CLSK): The Sharpshooter
If Bitcoin mining were a sport, CleanSpark would be the athlete that trains all year, eats clean, and shows up for every match. No drama, just execution.
In 2025, CleanSpark continues to grow fast — but smart. It’s acquiring distressed sites, upgrading facilities with immersion cooling, and pushing its fleet beyond 50 EH/s. Its Tennessee expansion (a deal scooped up for pennies on the dollar) was classic CLSK: low cost, renewable-powered, and ready to scale.
In Q1 2025, CleanSpark posted $162.3 million in revenue, up a blistering +120% YoY, and delivered $246.8 million in net income, or $0.85 per share. It's one of the few miners that’s profitable and expanding — at the same time.
The stock is up 25–30% YTD, trading around $12. While it’s been volatile like the rest of the sector, CLSK remains the benchmark for cost-effective, execution-focused Bitcoin mining. If you’re looking for a fundamentals-backed growth story, this is it.
🏗️ Iris Energy (IREN): The AI-Ready Dark Horse
Iris Energy may have flown under the radar in past cycles, but in 2025 it’s turning heads — not just because of Bitcoin, but because of data infrastructure.
While IREN runs a lean BTC mining operation powered by 100% renewable energy in Australia and Canada, the real story is its pivot toward modular data centers. It’s one of the few miners actively positioning itself for GPU workloads and AI compute as a hedge against mining volatility.
The upside? Flexibility. If BTC mining margins compress again, IREN has the facilities and roadmap to reconfigure its power-hungry machines for AI hosting. The market likes the optionality. The stock’s up ~70% this year and may still be cheap if the data center thesis catches on.
🔥 BitFuFu (FUFU): The Challenger
BitFuFu came in hot after its 2024 IPO — vertically integrated, Bitmain-backed, and global from day one. It’s the largest cloud mining provider in the mining space. It provides cloud mining, sells miners, hosts them, runs its own mining pool (BitFuFuPool), and operates a global fleet clocking over 36 EH/s under management.
While others focused on HPC & AI business, BitFuFu doubled down on mining scale and infrastructure. It aims to own over 1 GW of power capacity and launched its own mining operating system.
The post-halving reality has been rough. Q1 2025 revenue came in at $78 million, down 46% YoY, with self-mining revenue dropping 70.7%. But the company has a track record of being profitable every year since founded, plus its P/S is only 1.6, well below other mining giants such as Mara and Riot.
Watch this one. Especially if BTC pushes above $150K.
🐋 Marathon Digital (MARA): The Goliath, Still Standing
Marathon is the largest public miner by market cap — and has been the face of institutional mining exposure for years. It’s also the most debated name in the game.
On one hand, MARA controls a monster fleet with over 75 EH/s expected by year-end, global mining operations from the U.S. to the UAE, and a budding software business for managing hashrate.
On the other, critics argue it’s bloated, overly reliant on third-party infrastructure, and too slow to pivot in a fast-moving landscape.
Still, when Bitcoin’s hot, Marathon runs. The company holds a large BTC treasury of over 50,000 BTC, is adding immersion-cooled sites, and remains a proxy trade for many traditional investors wanting in on mining without picking niche plays.
Love it or hate it, MARA isn’t going anywhere. And if BTC moons in Q4, it’ll be one of the first tickers to feel the heat.
🧊 Cipher Mining (CIFR): The Quiet Killer
Cipher isn’t flashy. It doesn’t dominate headlines or make bold predictions. What it does do: mine Bitcoin efficiently, at low cost, with minimal dilution and maximum discipline.
Based in Texas, CIFR locked in long-term power contracts at enviably low rates and steadily grew its fleet past 13.5 EH/s. It has some of the best cost-per-BTC metrics in the industry and avoids unnecessary spending or debt.The Texas-based miner produced 602 BTC in Q1, and benefits from low power contracts and disciplined growth.
The market loves it: CIFR is up ~35% YTD, trading at $6.52. It’s becoming a favorite among investors who want hash exposure with less volatility and more transparency. The monthly production updates are clear, consistent, and confidence-building.
👀 Trends to Watch in H2 2025
1. Hashprice Rollercoaster: Hashprice (BTC earned per TH/s per day) has bounced from $39 post-halving lows to nearly $60. If BTC rallies again, miners with fixed-cost power will reap the upside.
2. GPU Hosting Pivot: With AI demand surging, some miners are repurposing infrastructure to host GPUs — think IREN.
3. M&A Season: Expect smaller players with weak cash flow to get scooped up.
4. Regulatory Shifts: Crypto Week laws passed in the U.S. provide more clarity. But ESG pressure and power usage scrutiny will remain part of the narrative.
💭 Final Thought
Bitcoin mining stocks aren’t just about Bitcoin anymore.
They’re about infrastructure. Data. Energy. Efficiency. Optionality. And in 2025, the winners will be those who can balance raw hashpower with strategic foresight.
Whether you’re team CLSK, FUFU, IREN, MARA, or CIFR — the landscape is shifting fast. And with BTC momentum building again, this might just be the beginning.
So — which miner are you backing this cycle?

BTCUSD LONGIt's a long time to write and explain everything, just buy the level with the limit that is at ~117.550. You can count on a short-term rebound.
The one below the touchdown is not worth taking. I'll let you know if it works or not later.

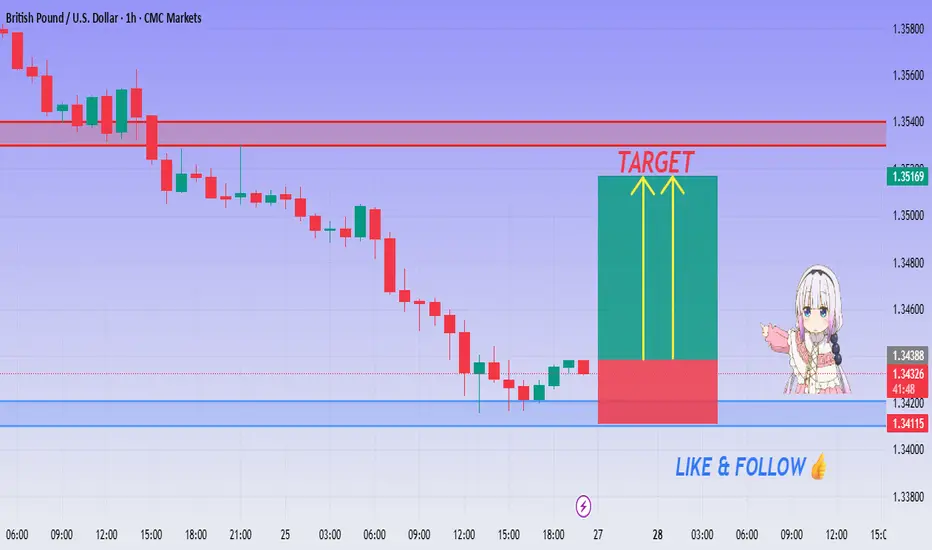
GBP/USD BUY Setup - Big Pump Loading Above Support!💚 GBP/USD Demand Rejection ! BUY Setup Activated!
👩💻 Dear traders,
GBP/USD is bouncing from a clear demand zone between 1.3420 – 1.3440 on the 1H timeframe. Early signs of rejection are forming, signaling a high-probability intraday long.
Bias – Bullish
🎯 Target – 1.34900
🎯 Target – 1.35160
🎯 Final Target – 1.35400
🛑 Safe Stop Loss – 1.34110
📊 Reasoning:
– Price tapped a well-defined demand zone (blue box)
– Small red box marks optimal stop placement below zone
– Two yellow arrows show projected upside path
– Previous support held strongly, momentum shifting bullish
– Excellent R:R for intraday buyers
🍀 Stay patient, wait for the bounce confirmation, and trade smart!
5 Lessons from My First 100 TradesAfter executing and reviewing over 100 real trades in crypto, forex, and gold — I found patterns. Bad patterns. Repeating mistakes. And lessons I wish someone had told me earlier.
So I broke them down into 5 key insights that changed how I trade — and might just save you thousands.
📘 Here’s what’s inside:
1️⃣ Smart Profit-Taking:
How I turned 10 R/R into 32 R/R using a dynamic exit plan.
📘Further resource:
Cycle Mastery (HWC/MWC/LWC)
---
Multi-Timeframe Mastery
2️⃣ The Sleep Edge:
70% of my losing trades happened after bad sleep. Here’s why that matters more than emotions.
3️⃣ No More Blind Stop Orders:
Why I stopped using buy/sell stops without real candle confirmation — and what I do instead.
📘 Further reading:
Breakout Trading Mastery
---
Indecision Candle Strategy
4️⃣ Multi-Layered Setups Win:
How structure, S/R, patterns, and timing stack into high-probability entries.
5️⃣ News Trading? Just Don’t.
The data behind why most of my SLs were hit near news time — and how I avoid the trap.
💡 These aren’t theories. These are real lessons from real trades.
If this video helped you or sparked an “aha” moment, give it a boost, commenting your takeaway, and sharing it with a fellow trader.
lets grow together :)

GOLD NEXT MOVE (expecting a mild bullish(24-07-2025)Go through the analysis carefully and do trade accordingly.
Anup 'BIAS for the day (24-07-2025)
Current price- 3357
"if Price stays above 3345, then next target is 3370, 3320 and 3400 and below that 3330 and 3310 ".
-POSSIBILITY-1
Wait (as geopolitical situation are worsening )
-POSSIBILITY-2
Wait (as geopolitical situation are worsening)
Best of luck
Never risk more than 1% of principal to follow any position.
Support us by liking and sharing the post.

META CANT KEEP THE HULK DOWN!!!!META has been consolidating for a few weeks now, but it's still in this bull flag that looks like it might break out soon, hopefully before earnings on Wednesday, July 30. I love technical analysis on charts, and this inverse head and shoulders pattern has been effective on most semiconductor names lately. We will know for sure next week.

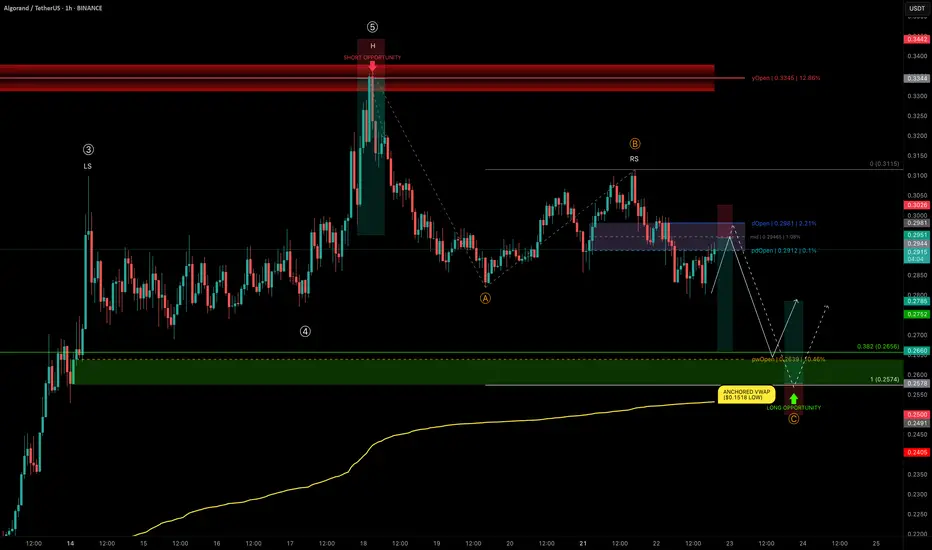
ALGO rejects at yOpen — Mapping High-Conviction Trade ZonesALGO has delivered an impressive +124% rally from $0.1518 to $0.336 in just 25 days, completing a 5-wave Elliott impulse right into the yearly open resistance.
We are now in a correction phase, and the current structure is showing a head and shoulders pattern, with the right shoulder currently forming.
Let’s break down the key levels and setups.
🧩 Technical Breakdown
➡️ ABC Corrective Structure:
Targeting wave C near the trend-based fib extension (TBFE) at $0.2574
➡️ Fib Retracement Confluence:
0.382 retracement of the entire 5-wave move → $0.2656
Previous weekly open (pwOpen) → $0.2639
Liquidity pocket likely to be swept
Anchored VWAP from the $0.1518 low (start of the bullish trend) → currently at $0.2532, acting as a major support layer
Conclusion: Long opportunity zone between $0.2656–$0.2574
Trade Setups
🔴 Short Setup:
Why? ALGO has lost dOpen and pdOpen — a bearish sign for downward continuation.
Entry Zone: Between dOpen and pdOpen
Stop-loss: Above dOpen
Target (TP): 0.382 fib retracement (~$0.2656)
R:R: ≈ 1:3.5
🟢 Long Setup:
Entry Zone: Laddered Entries between $0.2656–$0.2574
Stop-loss: Below anchored VWAP (~$0.2532)
Target (TP): ~$0.2785+
R:R: ≈ 1:2.65
🛠 Indicator Note
I’m using my own indicator called "DriftLine - Pivot Open Zones " for this analysis, which I recently published.
✅ Feel free to use it in your own analysis!
Just head over to my profile → “Scripts” tab → apply it directly to your charts.
💡 Educational Insight: Why Confluence Matters
High-probability trades aren’t based on just one tool or level — they come from confluence, where multiple signals align: fib levels, VWAP, liquidity pools, price structures , and key levels.
For example, in this ALGO setup, it’s not just the fib retracement or just the VWAP — it’s the stacking of all these elements together that creates a precise zone with a better statistical edge.
✍️ Lesson: Don’t chase trades off single signals; stack tools for confirmation.
Patience, confirmation, and confluence — as always, the keys to high-probability setups. 🚀
_________________________________
💬 If you found this helpful, drop a like and comment!
Want breakdowns of other charts? Leave your requests below.
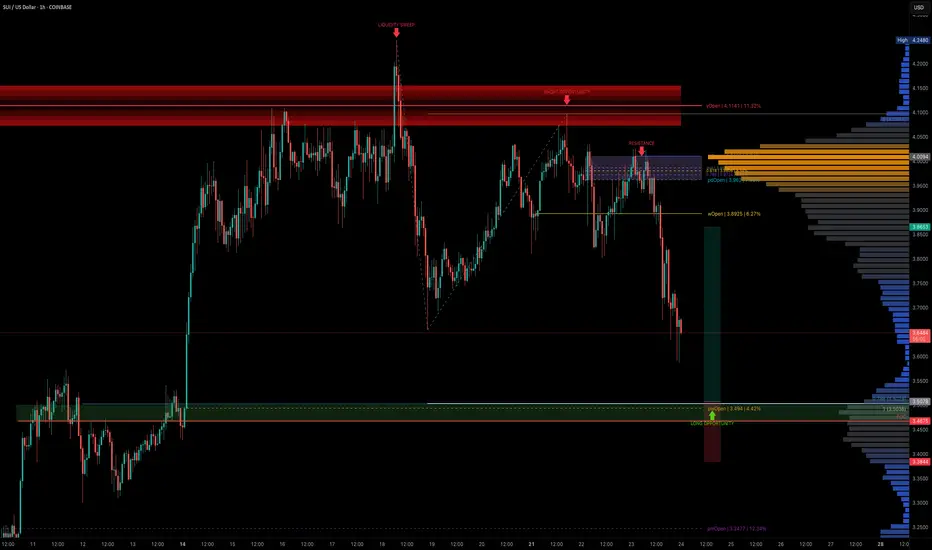
SUI — Structured Dip Buy Zone You Shouldn't IgnoreSUI has been technically clean, with well-respected Elliott Wave counts and fib levels.
As the broader market dips, it's time to look for sniper long entries and SUI is setting up beautifully for one around the $3.50 zone.
🧩 Key Confluence Zone: $3.50
This level offers a high-probability buy zone, backed by multiple layers of technical confluence:
0.786 Fib Retracement: $3.5029
1.0 Trend-Based Fib Extension: $3.5036
Previous Trading Range POC: $3.4675
Previous Weekly Open (pwOpen): $3.494
🟢 Long Trade Setup
Entry: ~$3.500
Stop-loss: $3.4675
Target (TP): $3.85+
R:R: ~1:3
🛠 Indicator Note
In this analysis I'm using my own indicator:
➡️ DriftLine — Pivot Open Zones
It helps identify key market opens (daily, weekly, prior), which often act as magnet levels and reaction zones.
➡️ You can use it for free — just check out my profile under “Scripts” and apply it to your charts.
💡 Pro Insight: Build Trades Where Tools Agree
A single level is just noise. But when fib retracements, extensions, POCs, opens, and price structure all line up — that’s where conviction trades are made.
The more overlap, the more likely the market reacts — this setup shows just that.
Final Thoughts
SUI is approaching a technically rich zone around $3.50, and this could be one of those low-risk, high-reward long entries if confirmed by price action.
With a clean invalidation and 1:3 R:R, this is the kind of setup you want to plan — not chase.
Set your alerts, stay patient, and trade with structure. 🚀✍️
_________________________________
💬 If you found this helpful, drop a like and comment!
Want breakdowns of other charts? Leave your requests below.
GBP/USD 4H Bearish Reversal Setup. GBP/USD 4H Chart Analysis (July 24, 2025):
Price is rejecting resistance near 1.35709, forming a bearish setup. A short position is highlighted with entry around 1.35067, stop loss above resistance, and target near the 1.33786 support zone. Bears aim for continuation toward 1.33745.

XRP to 2.80So, conjugate waveform or Elliot wave retracement is 5 steps. With 3 being the longest. 5 obviously the lowest. Once a demand or supply zone is tapped/broken into, they want the extreme of that zone. That's why I think 2.80 low.
With, 1234 break on Z out of the bearish Pennant into the demand. Forming the bottom of the, now larger C&H.
And aAaAway we go!

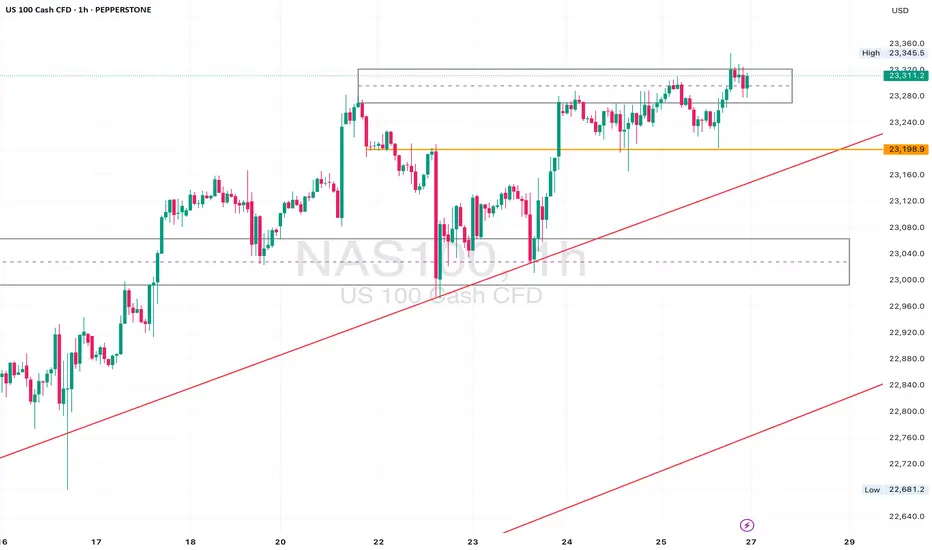
NAS100 Retesting Breakout – Eyes on 23170 for Bullish PushDaily Analysis:
Price is testing the upper boundary of the long-term ascending channel. Structure is still bullish with no major breaks of support. If momentum holds, we could extend toward the channel top.
4H Analysis:
Retesting breakout structure. Support is forming around 23000–23050. Bullish momentum remains valid unless price closes below this zone.
1H Analysis:
Micro-breakout confirmed with bullish impulse above 23120. If 23170 holds, continuation toward 23280–23320 is likely.
Confirmation & Entry:
Watch for continuation above 23170. SL below 23080. TP: 23280+
Use caution if 23000 breaks — this would weaken short-term bias.
A tale of two wedgesIn early 2025 we’ve seen two classic wedge patterns on two of the market’s most watched charts: a falling wedge on the U.S. Dollar Index ( TVC:DXY ) and a rising wedge on the S&P 500 ETF ( AMEX:SPY ). Alone each tells its own tale—but together they sketch a tug‑of‑war between a fading dollar and resilient equities.
The Falling Wedge on DXY
A falling wedge in a downtrend signals waning bearish momentum and often precedes a bullish reversal once price breaks the upper trendline.
The Rising Wedge on SPY
A rising wedge in an uptrend is classically a bearish reversal pattern —a breakdown below the lower trendline confirms sellers are gaining control.
A Converging Reversal
Given the well‑known inverse correlation between the dollar and most assets, it’s noteworthy that both asset classes are flashing signs of a reversal. Taken together that makes a compelling argument.

XRPUSD broke the trendline resistance likely will go upXRPUSD was trading in down ward and recently formed the double bottom and broke the resistance and will likely to go up.

XAGUSD - Silver - Important levels for the next few years!!These are important levels for the next few years.
I expect a new ATH for Silver. Better know where you buy and where you should sell.
Several CUP & Handle show how much silver is bullish.
After Gold, it's Silver's turn..

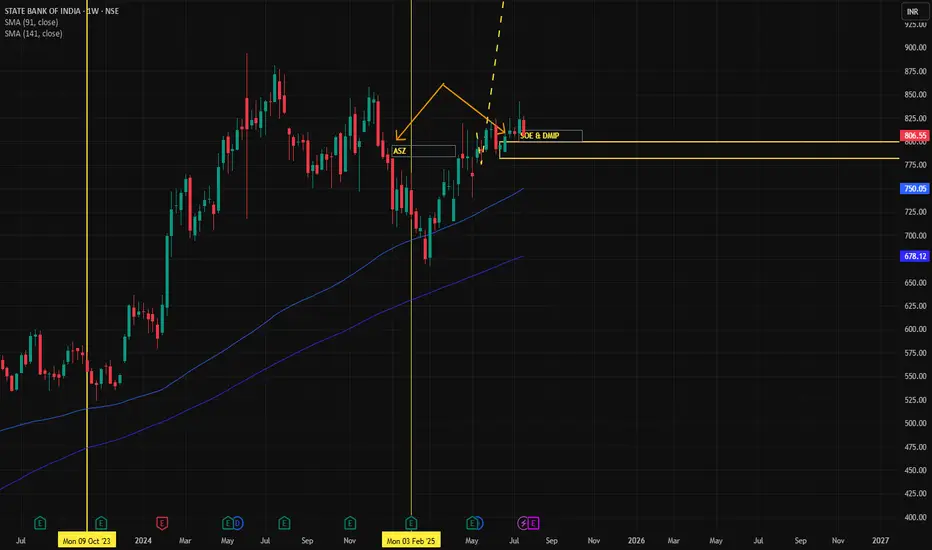
SBIN✅ Updated Trade Plan Summary
✅ Updated Trade Plan Summary
Metric Previous Value Updated Value
Entry 800 800
Stop Loss (SL) 757 775
Risk 43 25
Target 1256 1256
Reward 456 456
Risk-Reward (RR) 10.6 18.2
🔍 Implications of the Change
🔽 Risk reduced from 43 to 25 points
✅ RR improved significantly from 10.6 to 18.2, showing a more optimized entry
🔐 Stop Loss at 775 is now just below the Daily Demand zone (775–757) — tighter but still inside structure
🎯 Target remains the same, making the setup more efficient from a capital allocation and position sizing standpoint
⚠️ Caution Point
SL is just at the edge of the Daily Proximal Zone. If there's volatility and a liquidity grab below 775, there’s a minor risk of being wicked out before direction resumes.
You may consider partial entry or buffer SL at 770 if price volatility is high.
🧠 Key Trade Logic Still Holds
All Higher, Mid, and Intraday Timeframes show strong UP trend.
ASZ + DMIP + SOE confirmation from Weekly zone at 799 still valid.
Price trades well above Gann level of 766 and above ITF Demand clusters (782–787).
Weekly Demand at 800–780 is your live demand engine.
📌 Supportive Zones Recap
Timeframe Demand Zone (Proximal–Distal)
Weekly 800 – 780
Daily 775 – 757
ITF (Avg) 788 – 782
📈 Conclusion
This is an optimized entry with better RR (now 18.2), assuming volatility is managed.
Good structure, strong MTF alignment, and you're sitting inside the Weekly Demand Zone.
Monitor 775-770 zone — if broken with volume, re-evaluation may be needed.
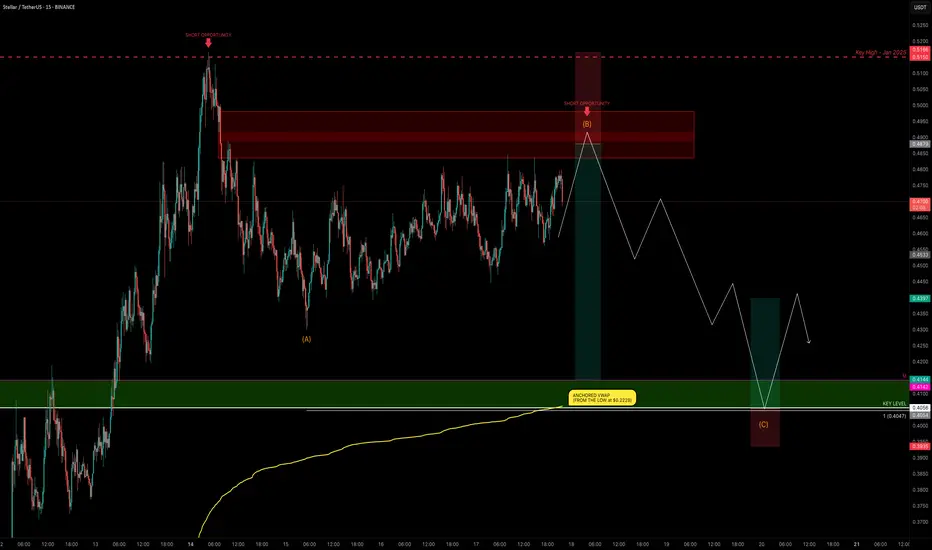
XLM Explodes +132% — Is the Party Over or Just Starting?XLM has been one of the top movers, sweeping the January 2025 swing high at $0.515 before stalling and moving sideways for the past 4 days.
Is XLM gearing up for another push toward the highs, or is a correction imminent?
Let’s dive into the details.
🧩 Market Structure & Fractal Pattern
XLM skyrocketed +132% in just 13 days, mirroring the explosive move seen back in November 2024.
If we apply the November fractal, the current price action suggests we could be setting up for an ABC corrective move.
📉 Key Levels & Confluences
FVG Zone: ~$0.49–$0.50 — likely to be swept before any major move down.
Monthly Support: $0.4142
Key Level / Liquidity Pool: $0.4056 — likely cluster of stop-losses.
Anchored VWAP (from $0.2228 start of trend): currently near $0.4056, adding strong confluence.
1.0 Trend-Based Fib Extension (ABC projection): If price pushes to ~$0.49 to complete wave B, the projected 1.0 TBFE for wave C lands right on the $0.4056 key level + VWAP, creating a perfect confluence zone.
➡️ Conclusion: The $0.4142–$0.4056 zone is a critical support and liquidity area with multiple confluences lining up.
Trade Setups
🔴 Short Setup:
Entry zone: $0.48–$0.50 (ladder in)
Stop-loss: Above $0.5166 (prior high)
Take-profit: $0.4142–$0.4056 zone
R:R ≈ 1:3
🟢 Long Setup:
Entry zone: $0.4142–$0.4056 (preferably near VWAP)
Stop-loss: Below $0.395
Take-profit: $0.44
⚡ Final Thoughts
Watch for a potential final push toward $0.49–$0.50 before a corrective wave unfolds.
The confluence at the $0.4142–$0.4056 zone — including monthly/weekly levels, VWAP, liquidity pool, and the 1.0 TBFE target — makes it a key area for decision-making.
Stay patient and wait for confirmation at these levels. Will post an update as things unfold!
_________________________________
💬 If you found this helpful, drop a like and comment!
Want breakdowns of other charts? Leave your requests below.