CHECK USDJPY SIGNAL UPDATE GO AND READ THE CAPTAINEntry Point: Around 147.750 TO 147.650
Take Profit 1: 147.200
Take Profit 2: 146.650
Last Target: 146.050
Stop Loss: 148.250
Community ideas

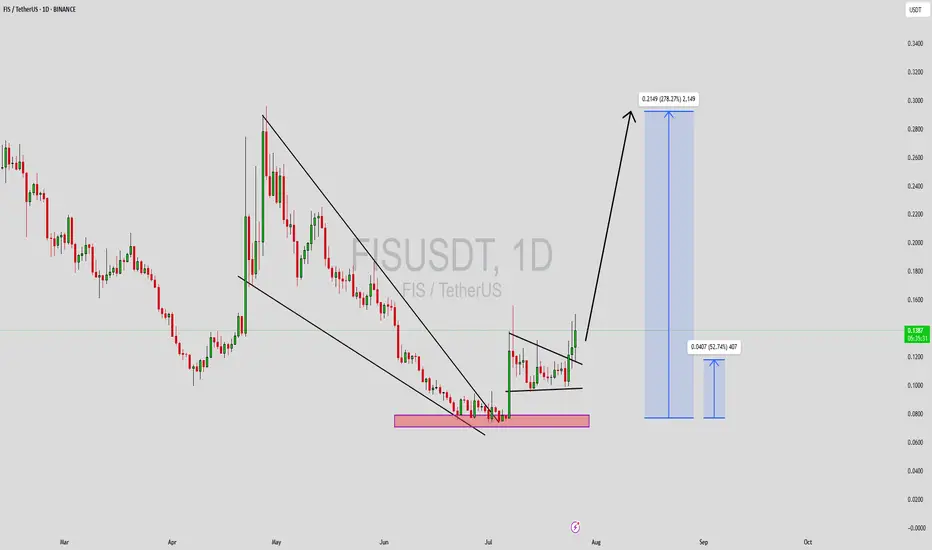
FISUSDT Forming Falling WedgeFISUSDT is forming a textbook falling wedge pattern on the daily timeframe, a well-known bullish reversal signal that often precedes explosive upside breakouts. After an extended corrective phase marked by declining price and compressed volatility, the asset appears to be nearing a breakout zone. The narrowing structure of the wedge, paired with a gradual increase in volume, is a promising setup that signals growing buyer accumulation and a potential shift in market sentiment.
The falling wedge is one of the most reliable bullish continuation and reversal patterns in technical analysis, especially when backed by solid volume, as we’re now observing with FISUSDT. Once the price decisively breaks above the wedge’s resistance line, momentum could accelerate rapidly, triggering a sharp move to the upside. Based on current market conditions and historical price behavior, a target of 240%–250% gain is not out of the question as FIS reclaims previous support levels turned resistance.
Increased investor interest in this project is another key factor to monitor. Social metrics and on-chain activity suggest renewed enthusiasm in the ecosystem, which often precedes strong price performance. Coupled with favorable technicals and a bullish overall structure, FISUSDT offers a compelling opportunity for traders and long-term investors looking for high-risk, high-reward setups.
As always, patience is crucial when trading patterns like the falling wedge. But with technicals aligning and volume confirming accumulation, FISUSDT may soon begin its breakout phase and enter a powerful uptrend.
✅ Show your support by hitting the like button and
✅ Leaving a comment below! (What is You opinion about this Coin)
Your feedback and engagement keep me inspired to share more insightful market analysis with you!
Breakout or pullback?Update on the previous analysis:
We had anticipated a pullback due to the lower high, and that view remains unchanged — unless buying volume increases and we manage to break through the resistance.

A GOOD SELL OPPORTUNITY FINALLY EMERGE ON EURGBPA good sell opportunity is what’s envisaged on EURGBP. Price has reached a high of 0.87387 therefore I expect some form of sell off as it’s already at the resistance level.


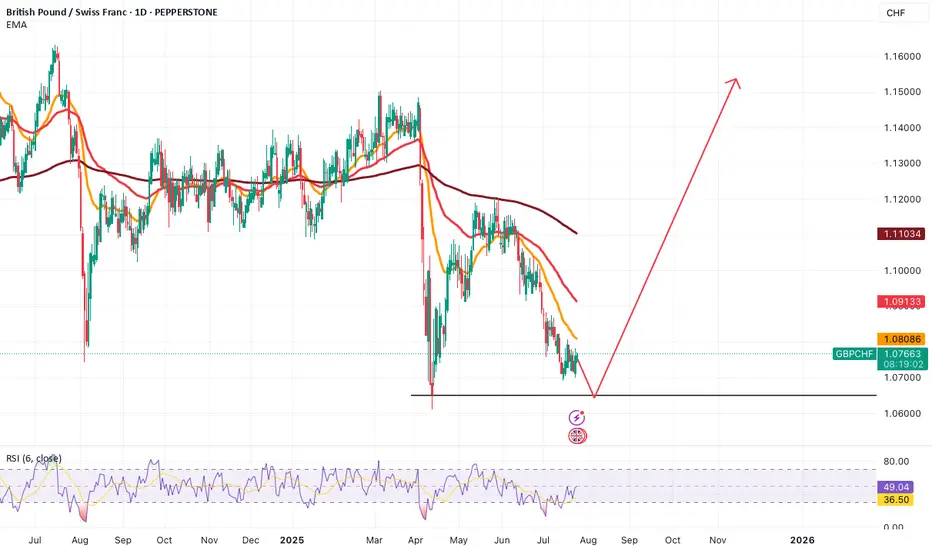
GBPCHF Forming Double BottomGBPCHF seems to be forming a visible double bottom.
The second bottom has to still form, we are waiting for that.
If the second bottom does form, we'll be looking for buys.
XRPThe primary regulatory catalyst boosting XRP's bullish outlook in 2025 is the resolution of Ripple Labs' long-standing lawsuit with the U.S. Securities and Exchange Commission (SEC). In March 2025, Ripple settled the case by agreeing to pay a $50 million fine, and crucially, it was clarified that XRP is not considered a security in the context of secondary market sales. This settlement removed years of significant regulatory uncertainty that had suppressed XRP's price and led exchanges to delist XRP. Following this resolution, major U.S. exchanges reinstated XRP trading, and institutional confidence in XRP surged, unlocking large-scale adoption and market participation by regulated investors.
Another key regulatory development providing bullish momentum is the passage of the GENIUS Act in the U.S. House of Representatives, approved around mid-July 2025. This legislation establishes a clearer federal framework for stablecoins and digital assets like Ripple's RLUSD stablecoin, further reducing regulatory risks and positioning XRP for broader mainstream utility and adoption.
In summary, the decisive legal settlement with the SEC and U.S. legislative progress (notably the GENIUS Act) have greatly clarified XRP's regulatory status, providing a green light for institutional entry through regulated channels such as exchange-traded funds (ETFs). The proliferation of XRP ETFs—including the approved ProShares XRP Futures ETF—amplifies this effect, enabling easier institutional and retail investment and fueling bullish price momentum
XRP Real-Life Use Cases in Finance
XRP REAL LIFE APPLICATION IN THE ECOSYSTEM.
1. Cross-Border Payments
XRP’s core financial use case is to act as a bridge for cross-border payments.
Traditional international money transfers often take days and involve high fees due to intermediary banks (the SWIFT system).
With XRP, financial institutions can instantly convert and transfer value across borders. Typical settlement times are 3–5 seconds, with transaction costs usually less than a cent.
Numerous global banks and remittance providers have adopted XRP and the RippleNet system to cut costs and provide real-time international payment services.
2. On-Demand Liquidity (ODL) & Liquidity Bridging
Banks and payment providers use XRP to manage liquidity.
With XRP as a bridge currency, financial institutions do not need to pre-fund nostro accounts in multiple countries. Instead, they can source liquidity ‘on demand’ using XRP, freeing capital and reducing operational costs.
On-demand liquidity flow improves cash efficiency and speeds settlements between a wide variety of global fiat currencies.
3. Micropayments
Due to low fees and fast settlement, XRP is suitable for micropayments.
This enables new use cases in digital content (e.g., pay-per-article, tipping creators) and gaming, where sending tiny amounts is otherwise unfeasible.
Such micropayment abilities open the door to innovative business models in finance and online services.
4. Tokenization and DeFi
The XRP Ledger supports tokenization of financial assets and decentralized finance (DeFi) use cases.
Financial firms can issue stablecoins or tokenized assets (including stocks, bonds, or other real-world assets) on-chain, fostering new kinds of investment products, automated trading, and settlement.
XRP’s ledger powers “sector-based index funds,” asset baskets, and other financial instruments, expanding real-world utility within decentralized finance.
5. Remittances
Remittance companies use XRP to offer faster and cheaper international transfers.
This is particularly valuable for migrant workers sending money home, reducing transaction times from days to seconds and cutting fees, thereby increasing the amount recipients receive.
6. Banking and Trade Finance
Some banks and trade finance platforms use XRP to improve operational efficiency.
By digitizing trade documentation and facilitating instant payments, XRP is helping modernize the traditionally slow and paperwork-heavy trade finance sector.
7. Collateral & Trading
XRP can be used as collateral in digital asset trading and arbitrage.
Traders and financial institutions leverage XRP for high-speed transfers between exchanges, using its liquidity to seize arbitrage opportunities and service margin calls rapidly.
Countries adopting XRP for real-life payments, especially cross-border transactions, include several key nations across Asia, the Middle East, and beyond. Here are some notable examples of countries actively integrating XRP into their financial systems and payment infrastructures as of 2025:
Japan: A pioneer in cryptocurrency adoption, Japan has multiple banks partnered with Ripple using XRP to streamline cross-border payments. The Bank of Japan and major institutions like SBI Holdings support XRP integration to provide faster, lower-cost international transactions across Asian markets.
United Arab Emirates (UAE): The UAE is proactively integrating blockchain technology, including XRP, with banks such as Zand Bank and fintech firms using Ripple’s platform for faster cross-border payments. Dubai’s financial initiatives leverage XRP to boost transaction efficiency within and beyond the region.
South Korea: Known for its vibrant tech ecosystem and supportive crypto regulations, South Korea has seen local banks experimenting with XRP to reduce international payment costs and increase speed, making it part of the broader fintech innovation landscape.
Mexico: Financial institutions in Mexico use XRP to improve remittances, especially those coming from the U.S., reducing processing time and fees significantly.
India: Given its large remittance market and fintech growth, India is exploring the use of XRP to address the need for low-cost, quick international payments.
Singapore: XRP adoption is growing here, with increasing numbers of users and integration of Ripple’s stablecoin RLUSD into payments.
United States: Some American banks and financial institutions are starting to integrate XRP for international payments, signaling growing institutional interest.
Canada: Banks like Canadian Imperial Bank of Commerce (CIBC) and remittance services use Ripple technology, including XRP, to enable faster cross-border money transfers.
Brazil: Various financial players collaborate with Ripple to modernize the country’s payment infrastructure using XRP.
United Kingdom: Institutions and fintech firms in the UK leverage Ripple’s technology for faster, cheaper international transactions.
Thailand and Sweden: Banks in these countries are partnering with Ripple to enhance their cross-border payment capabilities by leveraging XRP.
Egypt: Major banks are collaborating with Ripple to improve payment efficiency, including through XRP-based solutions.
In essence:
XRP directly addresses major friction points in global finance by cutting costs, increasing speed, and providing new ways for banks, companies, and individuals to move and manage money—all with increasing real-world adoption in cross-border payments, liquidity management, and digital asset innovation.

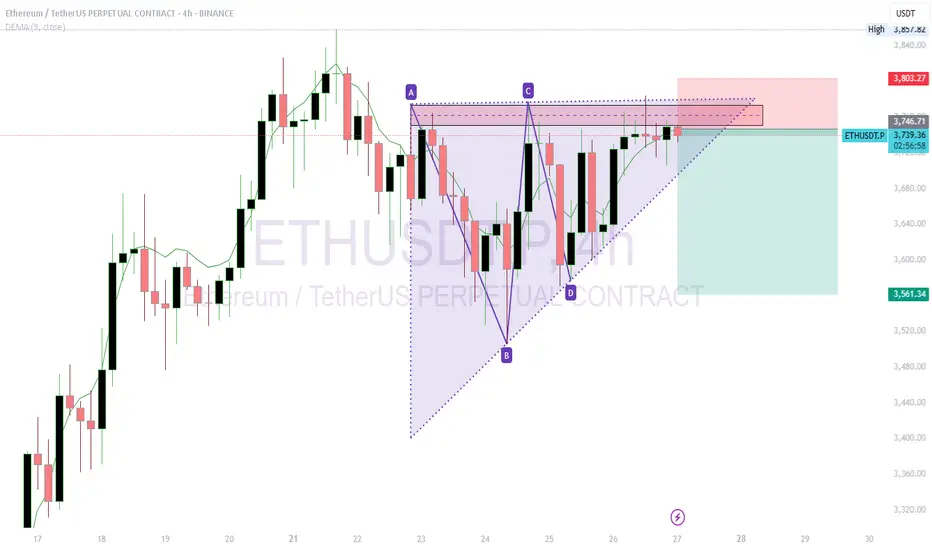
ETHUSDT Short Trade IdeaShort ETHUSDT at $3,745.22 with a target of $3,561.34.
Reason for Short: The 4-hour chart shows a symmetrical triangle pattern with resistance around $3,745-$3,800. The price is testing this upper trendline, and a recent bearish candle suggests potential rejection. The DEMA at $3,747.75 indicates overextension, supporting a pullback.
What I See: Heavy sell pressure is forming near $3,745, with the triangle nearing a breakout/breakdown point. Support lies around $3,561, aligning with prior lows.
Stop Loss: Set at $3,802, above the recent high and triangle resistance, to avoid a bullish breakout.
Trade Rationale: A breakdown from the triangle with volume confirmation could drive the price to $3,561. The tight stop above resistance minimizes risk while targeting a key support level.
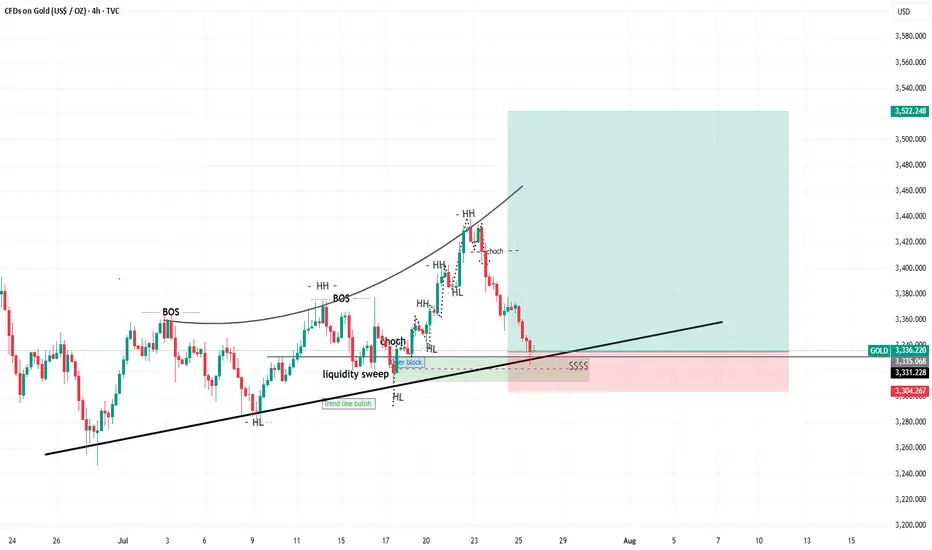
xauusd i think buy from here its not a bad ideatrend lines oder block fvg liquidity sweep choch higher high higher low.
Market shows signs of indecisionThe market is in a state of indecision, and no indicator or oscillator can help determine the next move — none of them are useful right now.
The market is waiting to make a decision, and so are we.
We need to stay patient and see which direction it chooses.

AUDCAD Resistance Ahead!
HI,Traders !
#AUDCAD is trading in an
Uptrend but the pair is locally
Overbought so after the pair
Hits the horizontal resistance
Level of 0.90210 we will be
Expecting a local bearish
Move down !
Comment and subscribe to help us grow !

BTC – Bulls still in controlBTC is trading around 117,800 USD, well above both the EMA 50 (111,800) and the pivot level (105,300), confirming bullish dominance. Price remains below the upper Bollinger Band (123,400), leaving potential room for continuation.
Momentum stays constructive, with RSI at 60 and MACD in a strong positive zone, reflecting sustained upward pressure. As long as price holds above EMA 50 and pivot, the next upside targets lie at 123,400 and R1 at 110,000 has already been surpassed.
Volume has dropped significantly (-31%), suggesting the latest move could lack conviction or represent a pause rather than a breakout.
As long as BTC holds above 111,800, the bullish scenario remains intact.
Watch for any rejection near 123,400 or a close back below the EMA as potential invalidation signals.

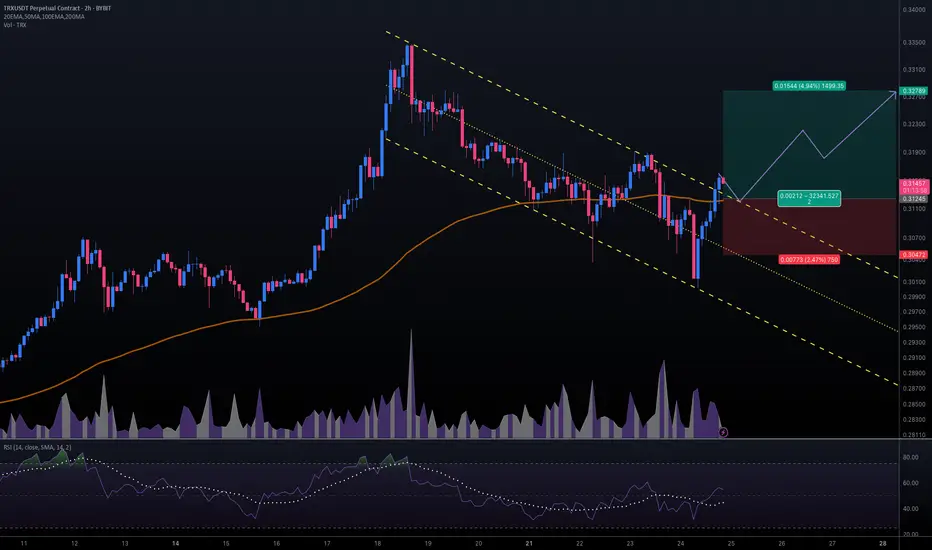
#TRXUSDT #2h (ByBit) Descending channel breakout and retestTron just regained 100EMA support and seems ready for bullish continuation after a pullback to it.
⚡️⚡️ #TRX/USDT ⚡️⚡️
Exchanges: ByBit USDT
Signal Type: Regular (Long)
Leverage: Isolated (16.0X)
Amount: 5.1%
Entry Targets:
1) 0.31245
Take-Profit Targets:
1) 0.32789
Stop Targets:
1) 0.30472
Published By: @Zblaba
CRYPTOCAP:TRX BYBIT:TRXUSDT.P #2h #TRON #DPoS #L1 #Web3 trondao.org tron.network
Risk/Reward= 1:2.0
Expected Profit= +79.1%
Possible Loss= -39.6%
A Legends Continuation. BTCHello I am the Cafe Trader.
Today we are going to look at a trade inspired by the Legendary Trader and Scalper Al Brooks.
If you are not familiar with him I recommend having a strong foundation with price action before giving him a look.
It's no secret that BTC is at levels many thought it would never reach, and yet many others are convinced of 5 - 10x more from this run alone. It can be crushing to feel like you missed out on the move, so instead of getting FOMO, I've detailed a guide to help you in the short or the long term.
Long Term
As of right now you are looking at 4 different levels of demand. It is up to you to measure your conviction, understanding why you want to invest, and how much you are willing to risk. Recognize that Many Big hedge funds have been hesitant with accumulating hoards of Crypto do to its volatile nature, considering it too risky.
So with this in mind, I have given you 4 levels to add BTC to your long term depending on your personal conviction.
Hyper Aggressive = Top of Demand $115,500 (willing to risk 50%)
Aggressive = Demand $99,500-101,250 (willing to risk 40%)
Fair Price = Strong Demand $74,000 - 78,000 (willing to risk 25%)
Steal = Extreme Demand $42,000 - 50,800 (willing to risk 10%)
Thinking about how much you are willing to risk will help you level out your Fear of missing this move, and get pricing that meets your personal demand.
Short Term
My fellow traders, this is a nugget (inspired) from Al Brooks. The "Two Bar Trend Break" .
In a strong trend (not in a range), When you get a trend break (I like to go top of wick to top of wick for this trade), if the second bar doesn't have a huge topping tail, but closes near the top, you can enter this trade.
Here is a trade that happened this month That hasn't filled yet (it got close).
Entry At the close of the second green candle $116,000.
Measure the bottom of the First candle that broke (called the Signal candle) to the top of the second bar that broke (called the Entery Candle). If you take that measurement, and add it to your take profit, you will have a 1R Scalp (1 measure of risk to 1 measure of reward).
This isn't a true scalp, typically they should be in the same bar or next bar, but this follows similar principles.
That's all for BTC, stay tuned for more analysis as we go over Ethereum, XRP, and one more of your choosing.
Happy Trading!
@thecafetrader

GBPUSDHello Traders! 👋
What are your thoughts on GBPUSD?
GBP/USD has broken below a trendline and has completed a retest (pullback) to the broken level.
The pair is now positioned for a potential downward move.
After some short-term consolidation, we expect price to drop at least toward the next identified support level.
As long as GBP/USD stays below the broken trendline, the bearish bias remains valid, and further downside is likely.
Don’t forget to like and share your thoughts in the comments! ❤️
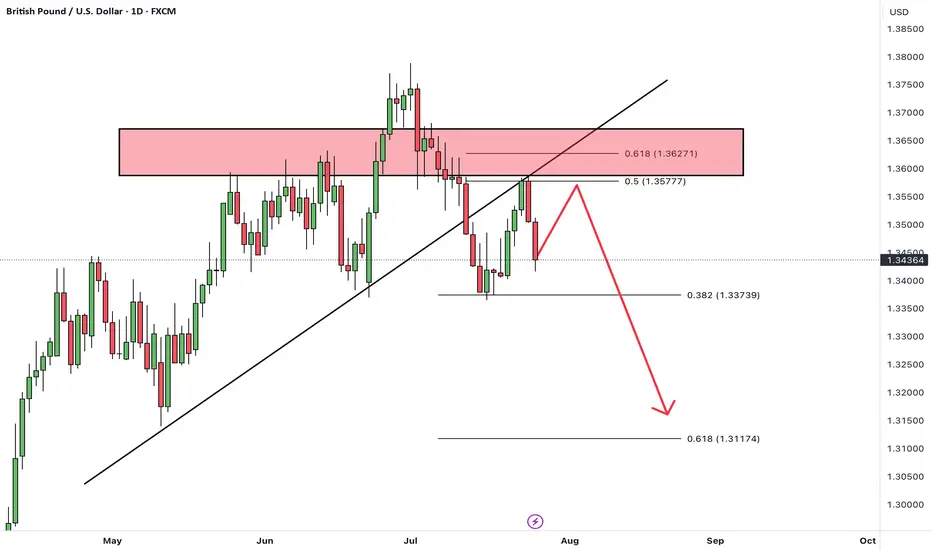
GBP/USD Holds Trendline Support as USD Shows StrengthThe US dollar showed some strength against the British pound during Thursday and Friday session, reflecting overall USD resilience.
Despite the prevailing uptrend, it's possible that GBP/USD may begin to consolidate, given how extended the pound's bullish run has been.
Currently, price is holding above a rising trendline, with additional support near the 1.3350 level. That trendline could play a key role if price pulls back further.
This pair often acts as a gauge for broader USD strength, considering the pound's relative strength. A decisive break above the 1.3600 level could open the door for a move toward 1.3750 in the sessions ahead.

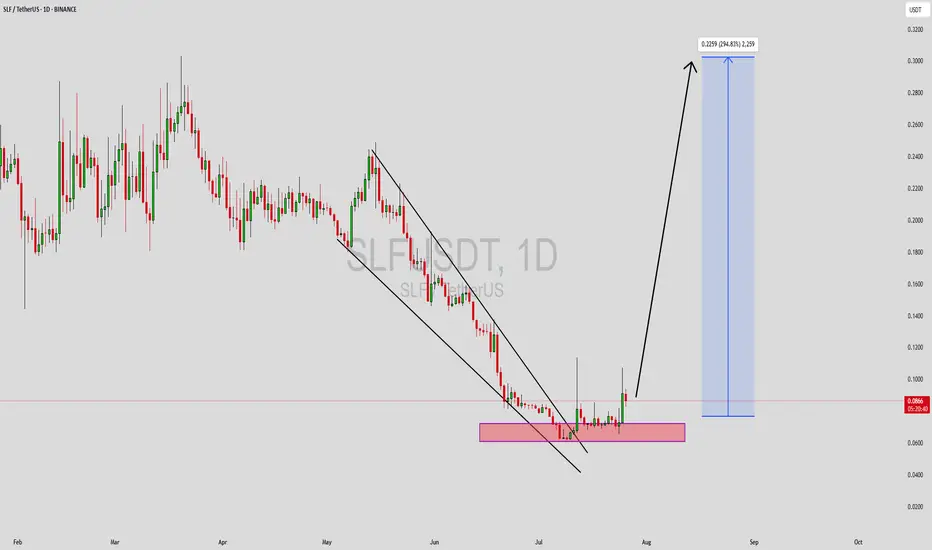
SLFUSDT Forming Falling WedgeSLFUSDT is currently exhibiting a classic falling wedge pattern, a bullish formation that typically signals a potential trend reversal. The narrowing of the wedge, combined with consistent price compression and higher lows, indicates that sellers are losing control while buyers begin to step in. This pattern often results in a strong breakout to the upside, and given the current structure, SLF is poised for a potential explosive move.
Volume levels remain healthy, which reinforces the likelihood of an impending breakout. Increased trading activity at support zones shows that investors are accumulating, anticipating a shift in momentum. Historically, falling wedges with strong volume confirmation have led to aggressive rallies, and in SLF’s case, analysts are expecting gains in the range of 190% to 200%+. This aligns well with both technical and psychological targets on the chart.
The market sentiment around SLFUSDT is turning increasingly positive as the project garners more attention in crypto communities. With on-chain metrics improving and social mentions growing, SLF is being recognized as a potential breakout play. If the price breaks out of the wedge and flips resistance into support, a sharp rally could follow—making it one of the high-reward setups currently in the altcoin market.
Traders should watch for a decisive breakout candle backed by rising volume, which could be the key confirmation to enter this trade. The structure is well-formed, investor interest is rising, and all technical indicators point toward an upcoming bullish move.
✅ Show your support by hitting the like button and
✅ Leaving a comment below! (What is You opinion about this Coin)
Your feedback and engagement keep me inspired to share more insightful market analysis with you!
BTC Balanced Volume Profile BTC is now trading in a textbook D-Shape Volume Profile. In english - Buyers & Sellers are happy to transact here and will stay inside the value area & consolidating sideways until further notice.
Consolidation at POC is a signature of this profile, and one of the easiest and least stressful trade setups because now, your mission, should you chose to accept. Is to fade the Highs (VAH) and Lows (VAL) and avoid the middle unless you love donating money to the market.
I'll have buy limit orders waiting right below the VAL where we have the single prints. It doesn't get any easier than this.
Doesn't mean price cant rip through, but this is always the best entry with less risk, especially when the single prints have not been tested yet..
BINANCE:BTCUSD CME:MBT1!

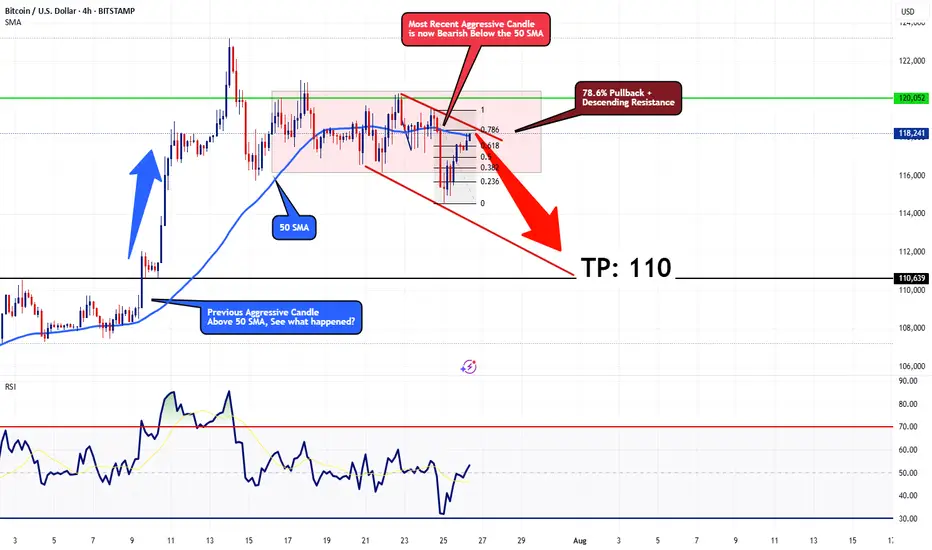
Bearish Outlook for BTCUSDOn the 4-hour timeframe, Bitcoin seems to be starting a corrective phase, likely moving toward the $110 mark. Current price action is facing resistance at a descending trendline, aligned with the 78.6% Fibonacci retracement level, which should limit any short-term upward moves. The price is also trading below the 50-period SMA, with a strong bearish candle from a few sessions back supporting the downward trend.
For a bullish outlook to take hold, Bitcoin would need to decisively break above the 78.6% Fibonacci level with a robust bullish candle closing above the 50 SMA. Until that happens, I remain bearish, with a target of $110.
This technical perspective aligns with the scenario where the Federal Reserve opts to maintain interest rates at 4.50% at this Wednesday's FOMC meeting
Stay cautious and trade wisely!
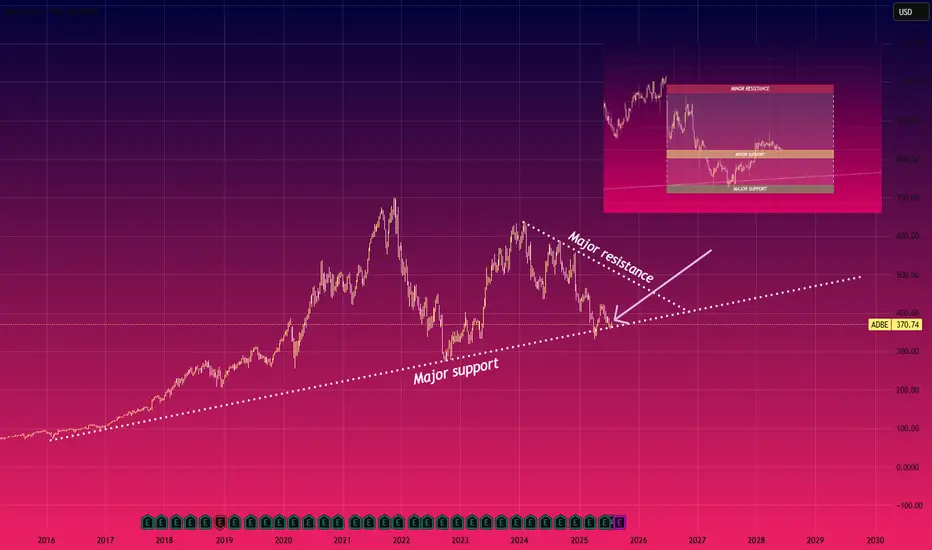
L: Quick Analysis on $NASDAQ:ADBE Support and ResistanceQuick Analysis on NASDAQ:ADBE Support and Resistance
The chart shows NASDAQ:ADBE nearing a major support level around $370, Which has held since 2016, the downward resistance line suggests continued pressure, but a breakout above $400 levels could signal a bullish reversal
Please note this is not financial advice
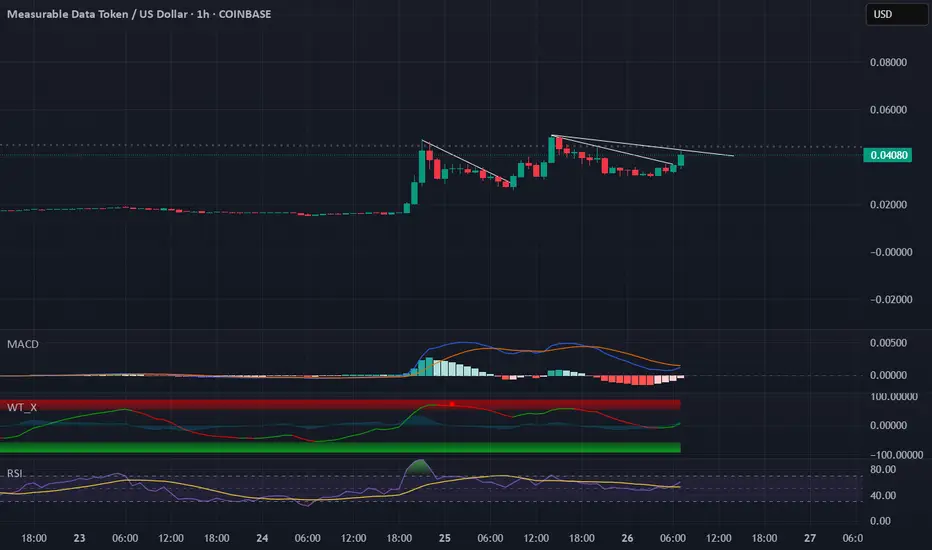
MDT lowcap gem on coinbaseMDT lowcap gem on coinbase
MDT low cap altcoin 25 million mcap with ethereum growing in marketcap defi has lots of potential as well
trading at $0.0.41
mcap 25 million
rsi = avg bullish
macd = avg
osc = bullish
LTC Litecoin USD Textbook Cup & HandleLitecoin should finish its correction over the weekend and as we get into August the momentum will shift back to the upside. This is a washout of over-leveraged positionsbefore the next massive leg up. I still see a correction down to about 100 dollars. Could be a wick lower but not too confident. There is quite a bit of strength in Litecoin, and for good damn reason.
Not financial advice just my opinion. Thank you

Newtusdt.pIt might get pump back to the top.
We need to see some bullish momentum before entering to the trade..
Always take 50% profit when price starts to move.
Rest DYOR
