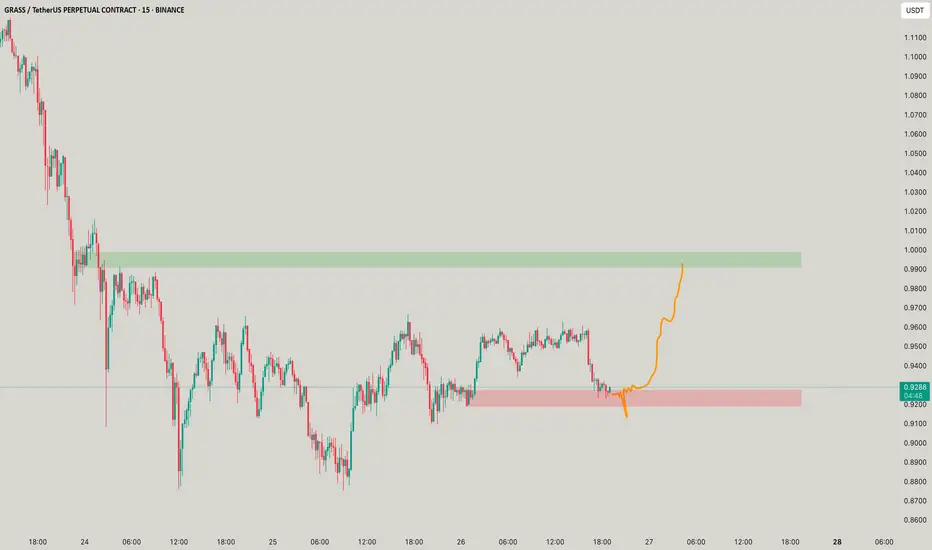
Are you cow to eat GRASS?GRASSUSDT looks a perfect trade, too perfect to be true! Just wait for the right buys!
Community ideas
bitcoin technical chart movingwe are provide bitcoin next falling expected after big chance to buying level
JUPUSDT 1D#JUP is moving inside an ascending channel on the daily chart, and it also appears to be forming a Rounding Bottom Pattern within the same timeframe.
It has recently bounced from the midline of the channel and the daily EMA50, and is now facing the daily EMA200.
In case of a breakout above the EMA200, the upside targets are:
🎯 $0.6660
🎯 $0.7785
🎯 $0.8910
🎯 $1.0371
🎯 $1.1249
⚠️ As always, use a tight stop-loss and apply proper risk management.

Btcusd techinical analysis.Btcusd techinical analysis next move posibale at h1 time.not finchinal advice.

C / UsdtBINANCE:CUSDT
### **📊 Chart Overview – CUSDT (1H):**
* **Current Price:** \$0.3225
* **Recent Trend:** Price is consolidating below a **descending trendline (red)** after a sharp decline from \$0.44–\$0.45.
* **Key Levels:**
* **Support:** \$0.31 – \$0.32 (highlighted zone).
* **Resistance:** \$0.34 – \$0.35 (trendline breakout needed).
* **Major Resistance:** \$0.4456.
---
### **🔍 Technical Breakdown:**
1. **Downtrend Continuation:**
* Price is still below the **red descending trendline**, which acts as dynamic resistance.
* As long as it stays below \$0.34, the bears remain in control.
2. **Bullish Scenario:**
* A **clear breakout above \$0.34** with strong volume could lead to a push toward **\$0.37 – \$0.40**.
3. **Bearish Scenario:**
* Failure to hold **\$0.31 – \$0.32 support** could open doors to a drop towards **\$0.30 or even \$0.28**.
---
### **📌 Summary:**
CUSDT is in a **critical consolidation zone**. Watch the **\$0.32 support** and **\$0.34 resistance** closely — a breakout or breakdown could decide the next move.
---
⚠️ **Disclaimer:**
*This analysis is for educational purposes only, not financial advice. Always do your own research and trade carefully.*

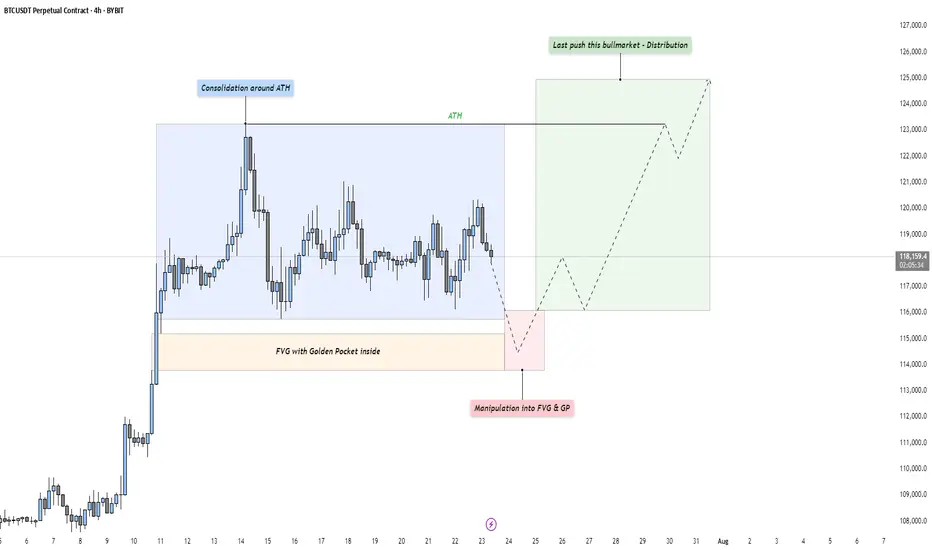
BTC - Last Push: Consolidation, Manipulation & DistributionMarket Context
After a strong upward impulse, Bitcoin has entered a mid-term consolidation phase just below its all-time high. This kind of price action is typical as the market digests recent gains and larger participants prepare for the next move. These pauses in momentum often precede either trend continuation or a reversal — and the structure here suggests we might be witnessing the former, but not without a final shakeout.
Phase 1: Consolidation Around the All-Time High
The first phase is defined by a tight range just beneath the all-time high, where price moves sideways in a balanced struggle between buyers and sellers. This is often where retail participants become overly bullish, anticipating a breakout. However, the lack of a sustained move higher indicates that smart money may be waiting for better entries — or preparing to engineer liquidity to fuel the next move.
Phase 2: Manipulation Into the Fair Value Gap and Golden Pocket
Directly below the range lies a clean Fair Value Gap, with a Golden Pocket retracement nestled inside it. This zone represents a strong area of interest. A sharp move into this area would likely sweep late long positions and trigger stop-losses from range traders — a classic manipulation pattern. This phase serves two purposes: collect liquidity and offer favorable pricing for larger players looking to position themselves before expansion. Watch for signs of absorption or reversal as price enters this zone.
Phase 3: Expansion – The Last Push of the Bull Market?
Following the liquidity sweep and reaction from the Fair Value Gap and Golden Pocket zone, we could see a renewed expansion toward higher highs. This is the phase where volume returns, sentiment shifts, and price accelerates. If this plays out, it could mark the final leg of this bull cycle — potentially driving Bitcoin to new all-time highs with strength.
Execution Thoughts
If you're looking to participate, it's wise to wait for a confirmation signal on a lower timeframe — like the 5-minute or 15-minute chart — once price enters the Fair Value Gap and Golden Pocket zone. Watch for a strong bullish reaction, break of structure, or shift in order flow to signal that buyers are stepping back in.
Final Thoughts
Let the market come to your level and don’t chase moves without context. These three phases — consolidation, manipulation, and expansion — are timeless patterns seen across all markets. Stay patient, stay objective, and react with clarity.
If this breakdown helped you see the setup more clearly, a like would mean a lot — and I’d love to hear your thoughts in the comments! Are you watching the same zone, or do you see something different?
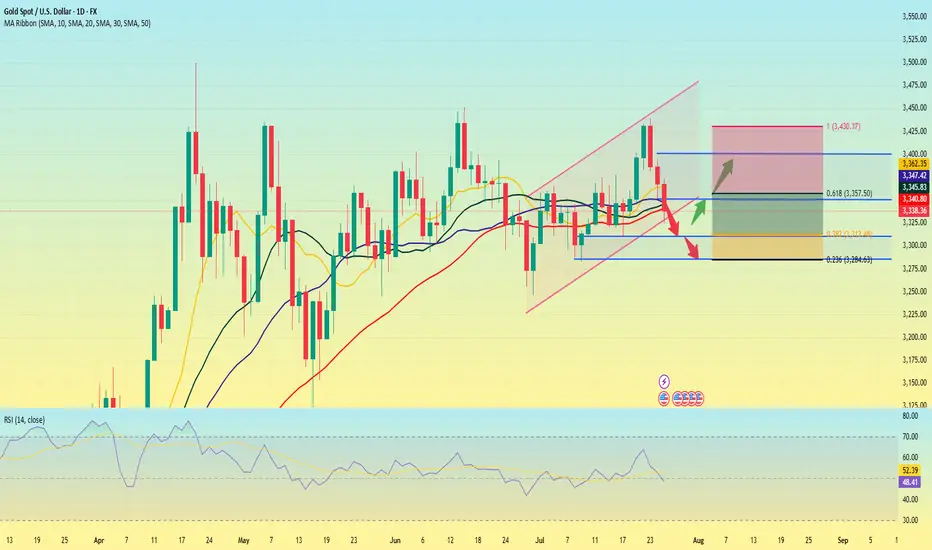
Gold (XAU/USD): Supply Zone Rejection & Bearish Breakdown Chart Breakdown:
Supply zone rejection: Gold revisited the “supply zone” (light green/grey area) and failed to break above — a classic signal of seller dominance.
Uptrend invalidated: A sharp rise (steep black trendline) ended with a peak marked by the green arrow, followed by a decisive breakdown.
Ichimoku Cloud test: Prices slipped through the Ichimoku components, reinforcing the shift to bearish sentiment.
Potential targets: The red/green risk‑reward box highlights a short position, targeting ~3,347 then ~3,318 levels (blue labels) as initial support zones.
Strong supply base: The extensive grey zone below marks a "stronger supply zone" — this could cap any modest bounce and keep the downtrend intact.
🔍 Interpretation:
Bias: Bearish — sellers have taken control after a failed breakout.
Strategy: Short on rallies toward the mid‑green/red box (~3,373–3,380), targeting ~3,347 first and then ~3,319. Watch for support at the strong supply region (~3,292) for potential reversal or consolidation.
Risk management: Keep stop above the red zone—above recent highs (~3,380+) to limit risk.
🚀 In a nutshell: After failing to break supply and losing its short‑term uptrend, gold appears poised for a pullback. The next key levels to watch are ~3,347 and ~3,319—where buyers might step back in, or the downtrend continues toward the deeper supply base.

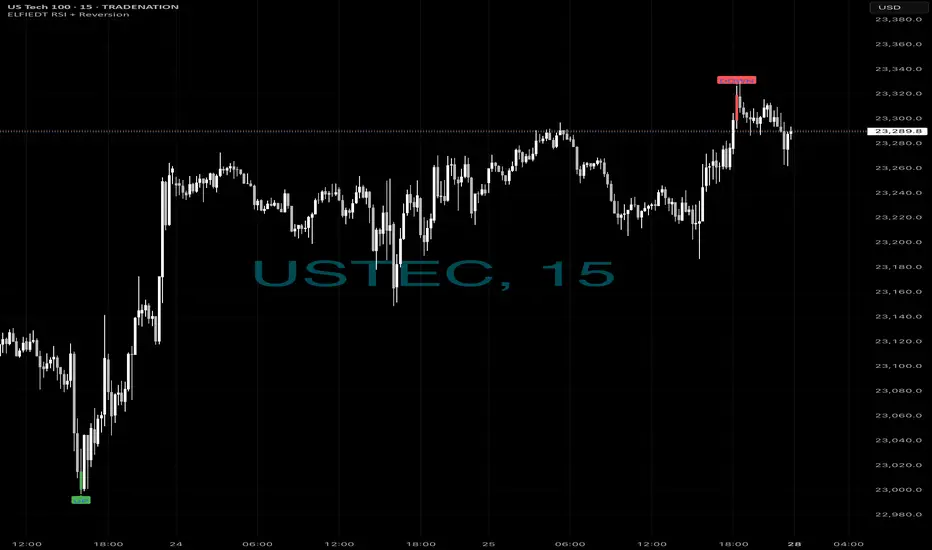
Longs then short - $$$🚀 Caught the Bottom. 🔻 Sold the Top.
Same chart. Same system. Same day.
While most traders were guessing,
ELFIEDT RSI + Reversion was sniping both ends on the US Tech 100.
📍 Long Signal:
At the dead low — green UP arrow fired.
The reversal followed instantly. Momentum exploded.
📍 Short Signal:
At the top of the rally — red DOWN printed.
Perfect spot. Price reversed hard within 1 candle.
⸻
🎯 How It Works:
✔️ Combines RSI overshoots + volatility reversion
✔️ Filters false signals using structure + time of day
✔️ Works on any index or FX pair
✔️ Real-time signals. No lag. No repainting.
⸻
💡 These weren’t “lucky trades.”
They were high-probability SETUPS.
Backed by logic. Confirmed by RSI extremes.
And now? Proven on the chart.
⸻
👉 Want to catch the next reversal like this?
💬 DM me “USTEC” or drop a 🚀
🔒 Access is limited to serious traders only.
📲 Follow for daily setups & training.
EURNZD Continuation setup following recent bearish momentumThe market has recently pushed down with momentum.
Price attempted a timid "echo bounce" back into the broken support but was rejected, confirming this area now serves as area for bearish re-entries.
From what I can tell, we're entering the next leg of what I call the “Gravity Spiral Phase”, where sellers take over after taking a clear zone. Each wave down is not just a move, but a continuation of momentum migration into new bearish move.
Target: 1.93500
This level marks the next gravity anchor, a zone where price memory may attempt to stabilize, but only temporarily.

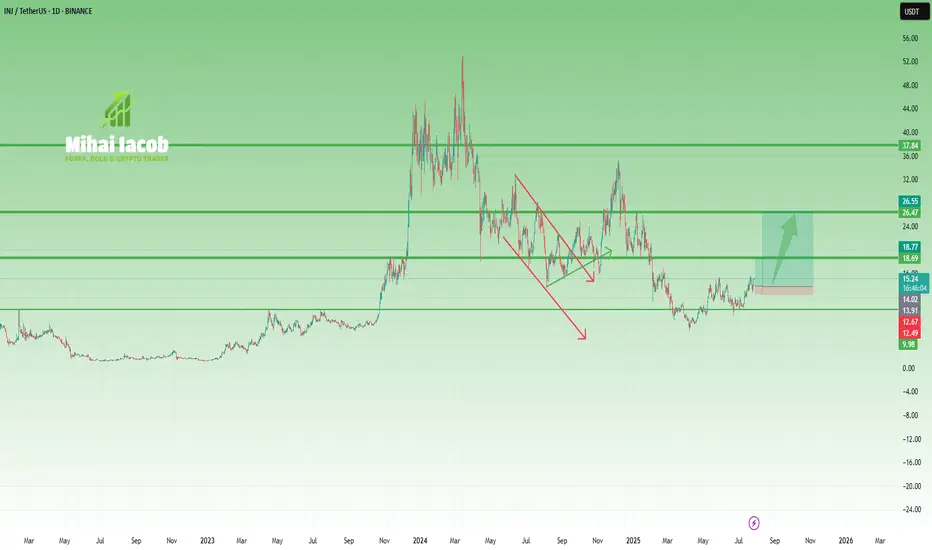
INJ – From Overhyped to Reasonable OpportunityA year and a half ago, INJ was in full hype mode, with fantasmagorical predictions of $200+, even though the coin had already done a 40x move.
(And not to brag—but at that moment, with INJ trading around $40, I said that $10 was far more likely than $200. It actually dropped to $6.5...)
Fast forward to today, and things are starting to look more constructive—at least, if you're not aiming for the moon:
🔹 After the local low at $6.5, price formed a small inverted Head & Shoulders
🔹 Then it confirmed new support at $10, a key psychological level and neckline zone
🔹 Now it's pressing into the $15.5 resistance
From my perspective, the setup is starting to favor the bulls.
If we get a clean breakout above $15.5, the next resistance is around $20, but I wouldn’t be surprised to see a push to $25–26, or even slightly above $30, if momentum builds.
📌 Not a hype call.
It’s a realistic technical setup, built on structure—not dreams.
EURUSD: NEW WEEK TECHNICAL BIAS (MARKET OPEN)REVIEW SUMMARY
▪︎ On the Higher Timeframes (HTFs), the Buy-Side Bias Environment (BBE) remains intact, with no confirmed breach of the ongoing Ascend Sequence.
▪︎ However, the 4H chart reveals a developing Descend Sequence within a steep, channel-like structure, recently triggering a Rejection Block (Activated).
▪︎ If this Rejection Zone holds, I expect a potential Trend Shift that resumes the broader Ascend Sequence.
▪︎ Otherwise, a decline into the discount region near 1.16523 may unfold before any significant rally toward the primary Target Zone.
▪︎ Invalidation occurs with a structural breakdown to and below 1.15571, which opens the door toward the pending ARBs lower.
📌 This is not trade advice. Just technical observations and market perspective. Validate independently before acting.
#IntelEdgeProtocol

S&P 500 Counter-Trend Setup After Bullish Week US500Currently watching the S&P 500 (US500) closely 👀. The index has been in a strong bullish trend 📈, but I’m now evaluating a potential counter-trend opportunity.
Given the strength we’ve seen this week — possibly a “foolish rally” — there’s a chance we’ve either printed or are close to printing the high of the week 🧱. That opens the door for a retracement setup, particularly as we head into Monday’s open 🗓️.
🧠 Trade idea: If we get a bearish market structure break, I’ll be looking to enter short — targeting a 1R take profit initially, and holding a portion for a 2R–3R extension 🎯.
Friday sessions, especially after strong trends, often present clean intraday pullbacks — and when Monday’s low is set early, it can trap late buyers and fuel the move 📉.
⚠️ This is not financial advice — just sharing my thought process and trade plan.

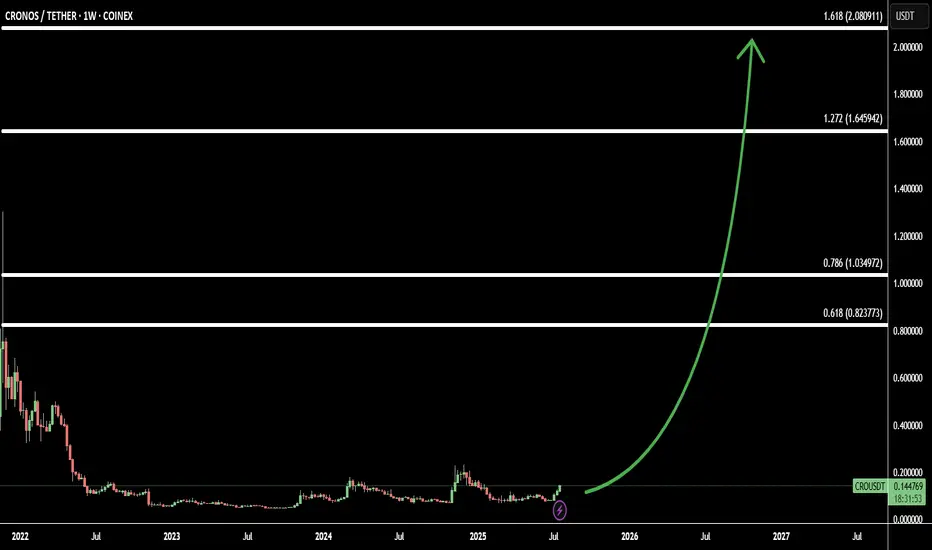
CRO Signals Big Move: 3 Soldiers Pattern + 4 Fibonacci Target(CRO/USDT) is showing a strong bullish reversal on the chart, forming the classic Three White Soldiers pattern — a powerful signal of trend reversal and sustained momentum.
This move comes after a prolonged consolidation phase, making CRO an ideal low-capital investment with the potential for a high reward.
Using Fibonacci extensions, I’ve identified 4 bullish targets:
Target 1: 0.618 Fib – 0.82 - confirmation of trend shift
Target 2: 0.786 Fib – 1.03 - key resistance zone
Target 3: 1.272 Fib – 1.64 - major breakout level
Target 4: 1.618 Fib – 2.08 - full bullish potential zone
With technicals and sentiment aligning, CRO may be gearing up for a big move, and current prices offer one of the best risk-reward opportunities in the market.
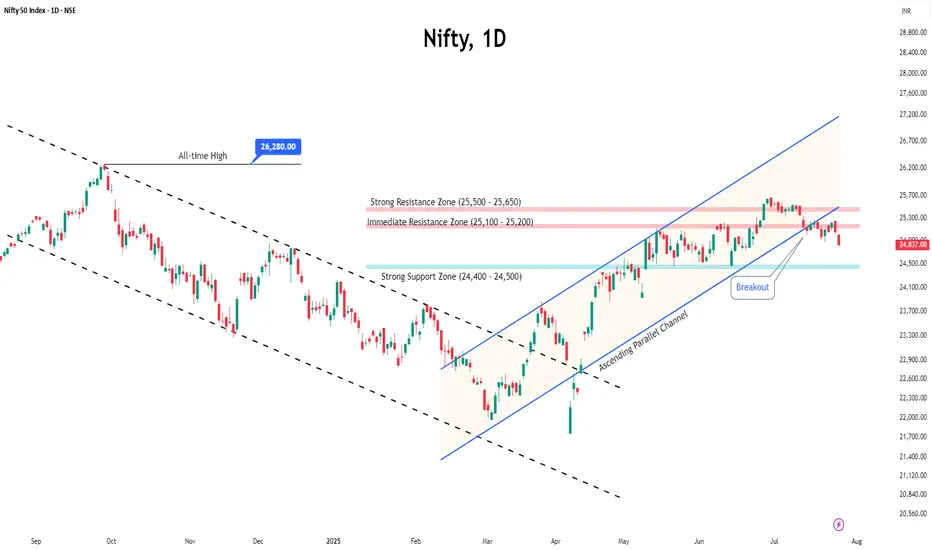
Pressure Builds on Nifty Before ExpiryThe Nifty traded in a tight range for most of the week but eventually slipped below the 25,000 mark, ending on a weak note.
With the monthly expiry approaching, the index is likely to remain under pressure, and volatility may pick up in the coming sessions.
Key resistance levels are seen at 25,200 and 25,500. A decisive move above 25,500 could trigger an upside breakout. On the downside, support is expected around 24,500 and 24,400.
Given the current structure, traders are advised to stay cautious, focus on selective opportunities, and avoid aggressive positions until a clearer trend emerges.
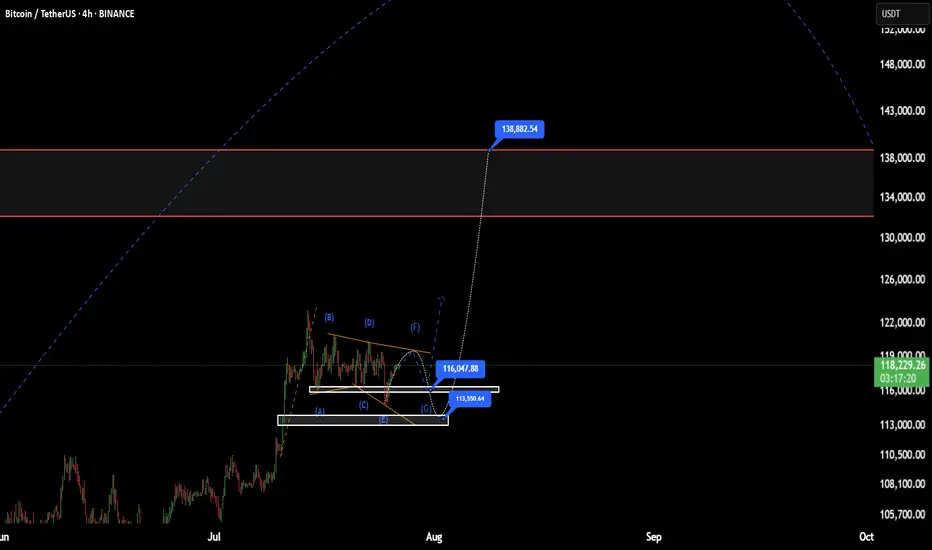
BTC(based on NEo wave)This range price is shown as a bow-tie diametrical.
I think G wave will end at one of those prices, 113 or 116
after this it will start a good bullish wave.
stop loss is 110K and the first target is 138K.
Gold is weak. Will it explode next week?Gold prices failed to stabilize above $3,400 after a bullish breakout this week. The technical outlook highlights the recent indecision of gold bulls.
In the first two trading days of this week, spot gold prices rose by 2.4%, but the cumulative decline in the last three trading days of this week reached nearly 3%. The sharp fluctuations this week were due to the positive progress in Trump's trade negotiations, and the rebound in market risk appetite, which hit the safe-haven demand for gold.
Looking at next week, the economic calendar will provide several high-impact data releases. The Federal Reserve will announce its monetary policy decision after the policy meeting on July 29-30; the US Bureau of Labor Statistics will release the July employment report; and some important news such as the US-China trade negotiations may trigger the next major move for gold.
From a technical perspective, the current market short-term technical outlook highlights the hesitation of gold buyers. The daily chart shows that the RSI is still slightly below 50, and gold prices have difficulty staying away from the 20-day and 50-day MAs after breaking through these two levels earlier this week.
On the upside, 3450 constitutes the first resistance for gold prices. If it breaks through this resistance, gold prices will most likely hit the 3400 integer mark again.
On the downside, if gold prices remain below 3340, technical sellers may still be interested. In this case, 3310 can serve as the first support level, followed by the second support level near 3285.
A new week is about to begin, and I wish all traders good luck.
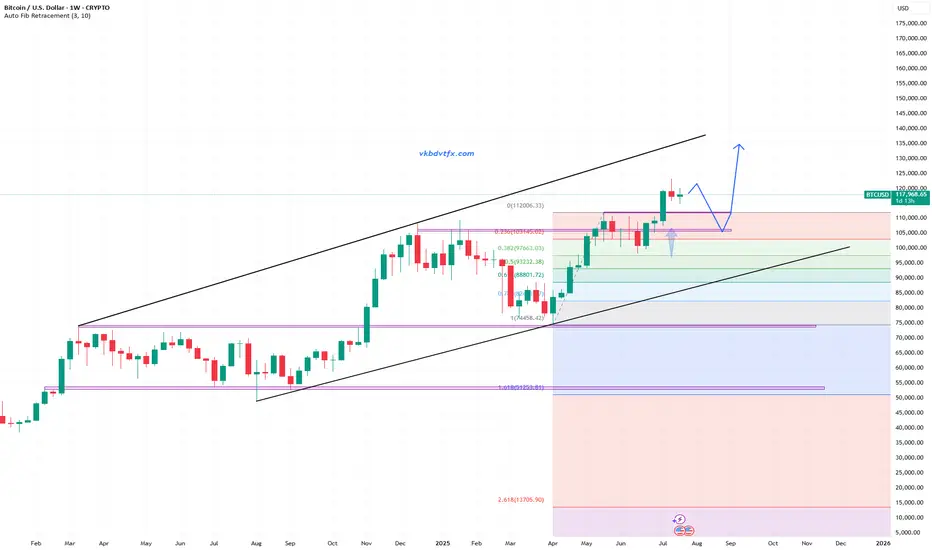
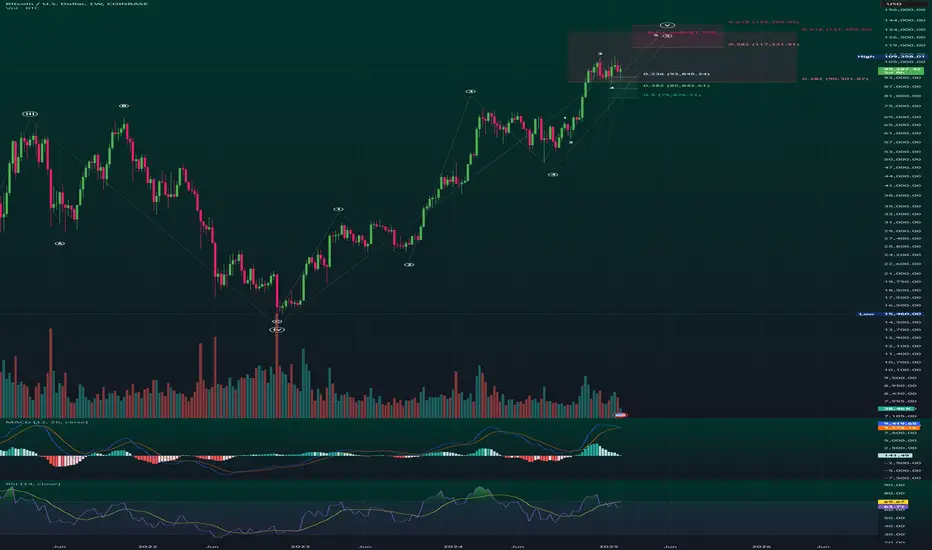
Bitcoin (BTC/USD) Weekly Analysis. Bull Market Top1️⃣ Key Market Structure - Elliott Wave Analysis
📉 Elliott Wave Progression:
BTC is in Wave 5️⃣, which historically marks the last bullish impulse before a potential correction.
Wave 3️⃣ was strong, confirming the trend continuation.
Now BTC is approaching the potential Bull Market Top 🚀.
🟢 Current Market Position:
BTC is forming Wave 5, targeting $117K - $139K as per Fibonacci extensions.
The final Wave 5 completion zone is projected within this range.
2️⃣ Fibonacci Retracement & Extension Levels
📊 Fibonacci Levels to Watch:
📍 0.236 Retracement: $93,845.34 ✅ (Minor pullback support)
📍 0.382 Retracement: $85,842.61 ✅ (Stronger correction zone)
📍 0.5 Retracement: $79,876.11 ⚠️ (Critical mid-level support)
🎯 0.382 Extension: $117,331.51 (Potential first target resistance)
🎯 0.618 Extension: $139,205.03 (Bull Market Top Projection)
📌 BTC Weekly High: $109,358.01
📈 BTC Current Price: ~$99,449.97
3️⃣ Technical Indicators - Confirmation Signals
📊 MACD (Momentum Indicator)
✅ MACD Histogram is still positive ➝ Confirming bullish momentum.
⚠️ Flattening MACD lines ➝ Indicates momentum might be slowing.
📊 RSI (Relative Strength Index):
🔼 RSI is near overbought zone (~69-70)
⚠️ Possible local top - BTC might need a correction before further upside
4️⃣ Key Support & Resistance Zones
🛑 Major Support Levels:
🟢 $93,800 (0.236 Fib - Short-term pullback zone)
🟢 $85,800 (0.382 Fib - Stronger correction zone)
🟢 $79,800 (0.5 Fib - Must hold support for long-term bullish trend)
🎯 Resistance Levels - Price Targets:
🔴 $109,000 (Current High - Short-term resistance)
🔴 $117,000 (First Major Resistance - 0.382 Fib Extension)
🚀 $131,000 - $139,000 (Bull Market Top Zone - 0.618 Fib Extension)
5️⃣ Trading Strategy & Market Outlook
💹 Bullish Bias Until BTC Breaks Below $93,800
🎯 Target Areas for TP (Take Profit):
✅ Conservative Traders: Exit near $109,000 - $117,000
✅ Higher Risk Targets: $131,000 - $139,000
⚠️ Risk Management:
🛑 Stop-loss: Below $93,000 to protect against a deeper correction.
📈 Scaling In: Consider adding positions if BTC retraces to the 0.382 ($85,800) or 0.5 ($79,800) Fibonacci level.
💡 Summary & Final Thoughts:
✅ BTC is in the final Elliott Wave 5 move, targeting a potential Bull Market Top of $131K - $139K based on Fibonacci extensions.
⚠️ However, RSI is overbought, and MACD momentum is slowing, meaning a pullback to $93K or $85K is possible before the next move higher.
🚀 Bullish until BTC breaks below key supports. Watch $109K and $117K for short-term resistance.
📊 Strategy: Hold long positions with profit-taking targets at $117K, $131K, and $139K. Use $93K as a support level for risk management.
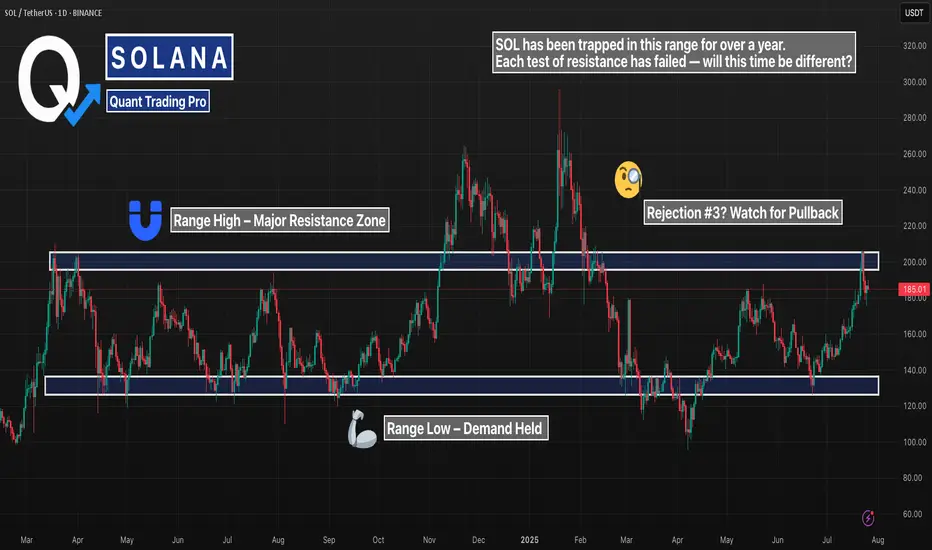
SOL 1D – Range High Rejected… Again?Solana just tapped major resistance — the same level that’s capped every rally since early 2024. This is now the third clean rejection off the $200 zone, and the structure couldn’t be more clear:
– Long-standing range between $115 and $200
– Previous rejections at the top led to full retracements
– This latest attempt? Rejected again — for now
If bulls want to flip the script, they’ll need a confirmed breakout with volume and a clean retest. Otherwise, this chart is screaming “range still intact.”
Until proven otherwise, this zone remains supply-heavy. Keep your risk tight — the next leg could move fast.
#Solana #SOL #RangeTrading #ResistanceZone #CryptoAnalysis #TechnicalBreakdown #QuantTradingPro #PriceAction
$ETH MAJOR FALLING TREND BREAKOUT!CRYPTOCAP:ETH MAJOR FALLING TREND BREAK AND RETEST COMPLETE.
Eth season seems to be just around the corner
MORE TO COME

PERPUSDT – Right Setup, Right PlaceThe target is clear, the green line.
But how you get there matters more than if you get there.
🧊 Inclusion Plan
The blue boxes are where I’d consider entry.
They’re not just price zones — they’re areas of alignment:
Historical consolidation - Volume profile acceptance
Footprint showing seller weakness
Yes, you could enter earlier,
but that wouldn’t be optimal.
✅ Smart Execution
Wait for price to revisit the box with control.
Watch CDV for demand confirmation,
and structure reclaim on LTFs before committing.
“You don’t win by being early. You win by being precise.”
No chasing. No guessing.
Just smart inclusion where the math makes sense.
📌I keep my charts clean and simple because I believe clarity leads to better decisions.
📌My approach is built on years of experience and a solid track record. I don’t claim to know it all but I’m confident in my ability to spot high-probability setups.
📌If you would like to learn how to use the heatmap, cumulative volume delta and volume footprint techniques that I use below to determine very accurate demand regions, you can send me a private message. I help anyone who wants it completely free of charge.
🔑I have a long list of my proven technique below:
🎯 ZENUSDT.P: Patience & Profitability | %230 Reaction from the Sniper Entry
🐶 DOGEUSDT.P: Next Move
🎨 RENDERUSDT.P: Opportunity of the Month
💎 ETHUSDT.P: Where to Retrace
🟢 BNBUSDT.P: Potential Surge
📊 BTC Dominance: Reaction Zone
🌊 WAVESUSDT.P: Demand Zone Potential
🟣 UNIUSDT.P: Long-Term Trade
🔵 XRPUSDT.P: Entry Zones
🔗 LINKUSDT.P: Follow The River
📈 BTCUSDT.P: Two Key Demand Zones
🟩 POLUSDT: Bullish Momentum
🌟 PENDLEUSDT.P: Where Opportunity Meets Precision
🔥 BTCUSDT.P: Liquidation of Highly Leveraged Longs
🌊 SOLUSDT.P: SOL's Dip - Your Opportunity
🐸 1000PEPEUSDT.P: Prime Bounce Zone Unlocked
🚀 ETHUSDT.P: Set to Explode - Don't Miss This Game Changer
🤖 IQUSDT: Smart Plan
⚡️ PONDUSDT: A Trade Not Taken Is Better Than a Losing One
💼 STMXUSDT: 2 Buying Areas
🐢 TURBOUSDT: Buy Zones and Buyer Presence
🌍 ICPUSDT.P: Massive Upside Potential | Check the Trade Update For Seeing Results
🟠 IDEXUSDT: Spot Buy Area | %26 Profit if You Trade with MSB
📌 USUALUSDT: Buyers Are Active + %70 Profit in Total
🌟 FORTHUSDT: Sniper Entry +%26 Reaction
🐳 QKCUSDT: Sniper Entry +%57 Reaction
📊 BTC.D: Retest of Key Area Highly Likely
📊 XNOUSDT %80 Reaction with a Simple Blue Box!
📊 BELUSDT Amazing %120 Reaction!
📊 Simple Red Box, Extraordinary Results
📊 TIAUSDT | Still No Buyers—Maintaining a Bearish Outlook
📊 OGNUSDT | One of Today’s Highest Volume Gainers – +32.44%
📊 TRXUSDT - I Do My Thing Again
📊 FLOKIUSDT - +%100 From Blue Box!
📊 SFP/USDT - Perfect Entry %80 Profit!
📊 AAVEUSDT - WE DID IT AGAIN!
I stopped adding to the list because it's kinda tiring to add 5-10 charts in every move but you can check my profile and see that it goes on..

SoFi: On the Road to ATH ResistanceAfter clearing over 100 lines off my chart, I wanted to take a clean, fresh look at SoFi heading into the upcoming earnings report — just to gain a new perspective on where we stand.
Weekly chart. As simple as it gets.
What I’m seeing: a breakout from a classic cup-and-handle formation, with the breakout point around $16.5.
This setup carries potential for a move toward all-time highs near $28.
— Important note:
A pullback to the $16.5 zone would still not break the breakout structure — in fact, this would be a textbook retest of the breakout level.
Yes, there’s still room for a ~20% downside from current levels, but this would still be within the structure of a larger bullish move toward ATH.
No doubt in my mind — if we revisit $16.5, I’ll be loading up on SOFI like crazy.

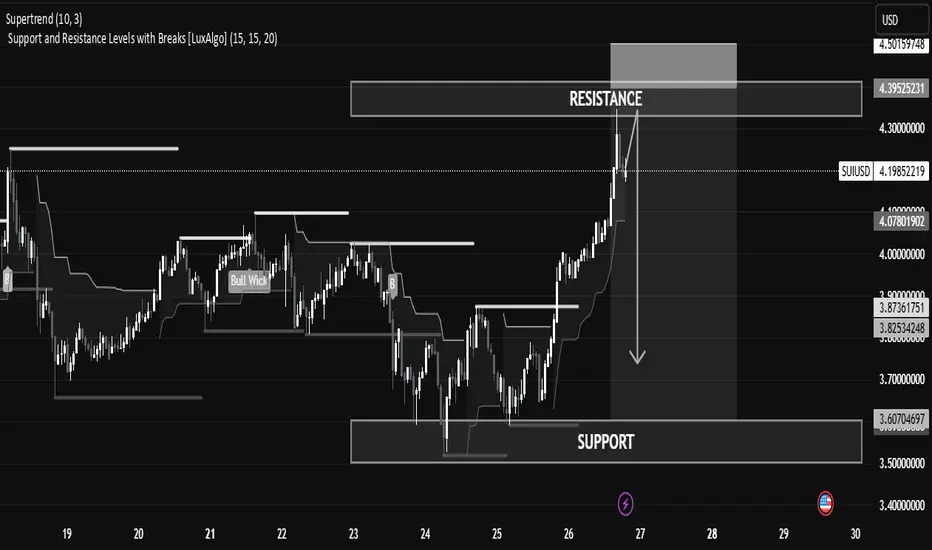
SUI/USD Technical Analysis – Potential Reversal Zone IdentifiedSUI/USD Technical Analysis – Potential Reversal Zone Identified
The current SUI/USD price action shows a strong bullish impulse reaching into a well-defined resistance zone, suggesting a potential pullback or reversal in the short term.
🔍 Key Levels
Resistance Zone: Between 4.30 – 4.39 USD, currently being tested after a strong bullish run. This is a historical supply area where price previously reversed.
Support Zone: Found between 3.60 – 3.70 USD, where price consolidated and accumulated before initiating the current rally.
Current Price: 4.2044 USD, slightly below the resistance zone, showing early signs of rejection.
📊 Technical Indicators & Structure
Supertrend (10,3): Bullish signal still active, suggesting trend strength, though traders should be cautious near resistance.
Break of Structure (BoS): Clean upward breaks suggest buyer dominance, but profit booking or sell-side liquidity may emerge near resistance.
Volume & Momentum: Impulse candles show strength, but volume tapering near resistance could indicate exhaustion.
📘 Educational Perspective
This setup highlights the importance of trading within key zones:
Buying at support, where demand is strong.
Monitoring resistance for signs of exhaustion or reversal patterns like wicks, doji, or bearish engulfing.
Risk Management Tip: In such cases, aggressive traders might short from resistance with tight stops, while conservative traders wait for confirmation (e.g., break and retest of the support or resistance).
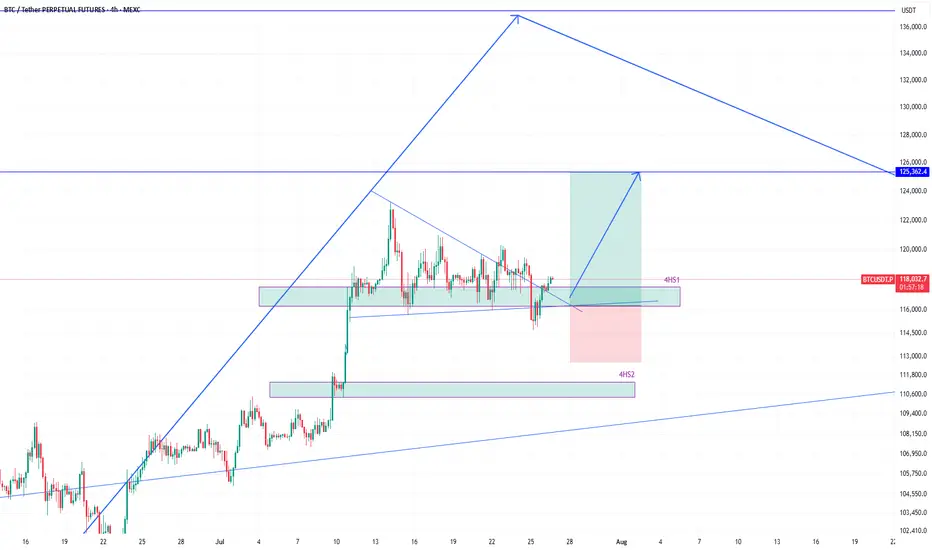
BTCUSDT eyeing 125k next after bounce from 116k zoneEarlier I shared the high time frame view of #BTCUSDT. We know that its heading higher and that helps in holding spot positions.
However, the move to the high frame target will not happen in a straight line, instead with various push to the upside and then subsequent corrections to the down side.
Therefore, as a trader, we must profit from those movements as we see some good high probability setups.
And there is one right now which is a long position.
The price broke 4h support 4HS1, but quickly reclaimed it. That is a sign of demand and strength required to move higher.
Therefore, this presents a long opportunity where the target of this long position should be 125k.
As the price enters into 4HS1 zone, I will scale into long position.
It is quite likely that the price will bounce hard once it taps into 4HS1 zone.
I am talking this long position targeting 125k. What about you? Share with me what you think.