LUMIA/USDTLUMIA/USDT has shown strong bullish momentum, with the first leg printing over +100% gain—signaling early strength and buyer dominance. Over the past two weeks, price action has been consolidating in a tight re-accumulation phase, forming a healthy base just above previous resistance . This phase appears to be nearly complete, and the chart structure suggests it's gearing up for the next impulsive leg upward.
A break above the short-term range high with strong volume will likely confirm the continuation. We’ve marked the green box as the ideal entry zone, aligning with recent demand and structural support.
Community ideas

CHECK USDJPY SIGNAL UPDATE GO AND READ THE CAPTAINEntry Point: Around 147.750 TO 147.650
Take Profit 1: 147.200
Take Profit 2: 146.650
Last Target: 146.050
Stop Loss: 148.250

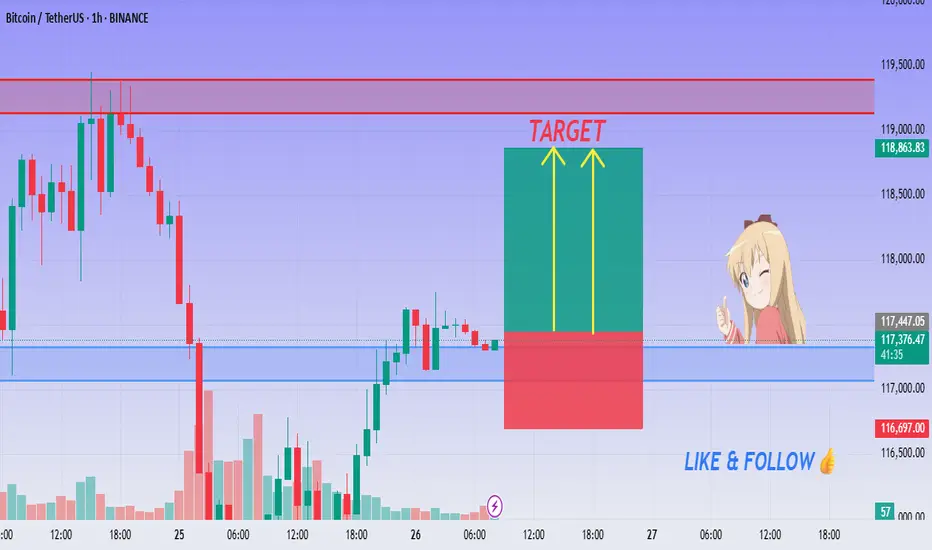
BITCOIN Ready to Pump - 1H Buy Setup Active!💚 BTC/USDT Bullish Breakout Setup ! Entry Activated!
👨💻 Dear traders,
BTC/USDT is showing a sharp rebound from a temporary base structure near $116,500, forming strong bullish momentum on the 1H timeframe. The breakout above local resistance signals the possibility of an impulsive move toward higher levels.
Bias – Bullish (Intraday)
🎯 Target 1 – $118,800
🎯 Target 2 – $119,200
🎯 Final Target – $119,500
🛑 Stop Loss – $116,500
📊 Reasoning:
– Clean bounce from previous structure support
– Bullish engulfing confirms short-term reversal
– Green zone = reward area, red = safe SL zone
– Two yellow arrows project upside momentum
– Strong volume spike during reversal
– R:R favors long scalpers and intraday swing
⚡ Stay disciplined. Let price confirm the zone and follow the momentum!

A tale of two wedgesIn early 2025 we’ve seen two classic wedge patterns on two of the market’s most watched charts: a falling wedge on the U.S. Dollar Index ( TVC:DXY ) and a rising wedge on the S&P 500 ETF ( AMEX:SPY ). Alone each tells its own tale—but together they sketch a tug‑of‑war between a fading dollar and resilient equities.
The Falling Wedge on DXY
A falling wedge in a downtrend signals waning bearish momentum and often precedes a bullish reversal once price breaks the upper trendline.
The Rising Wedge on SPY
A rising wedge in an uptrend is classically a bearish reversal pattern —a breakdown below the lower trendline confirms sellers are gaining control.
A Converging Reversal
Given the well‑known inverse correlation between the dollar and most assets, it’s noteworthy that both asset classes are flashing signs of a reversal. Taken together that makes a compelling argument.

BITCOIN PREDICTION - MASSIVE CANDLE INCOMING!!! (WARNING) Watch this Bitcoin Prediction video now, you will love it!
Yello, Paradisers! Big warning sign: #Bitcoin is about to liquidate more traders soon if we get these confirmations that I'm sharing with you in this video. Loads of people will get wrecked again. Be careful not to get trapped into fakeouts.
In this video, I'm describing exactly what I'm seeing on Bitcoin, what patterns I'm waiting to form, and what confirmations I want to see before being able to say with 100% accuracy guaranteed that MARKETSCOM:BITCOIN is moving in that direction.
I'm sharing with you all the important targets and also how professional trading works: how risk-reward proper ratio trading works, and how high-probability trading depends a lot on how you choose to create your trades.
Watch this Bitcoin prediction to understand what I'm seeing right now on the chart and how I'm acting and making my decisions.

"GOLD Bandit Strategy: Loot Pips Like a Pro!🏆 GOLD HEIST ALERT! 🏆 XAU/USD Bandit Strategy (Swing/Day Trade)
Steal Pips Like a Pro! 💰🔓 Bull vs. Bear Raid Plan
🌟 Greetings, Market Pirates! 🌟
"The trend is your accomplice—time to loot!"
🔮 Thief’s Technical & Fundamental Intel:
XAU/USD (The Gold Vault) is flashing BEARISH signals, but we’re ready to raid both sides! Follow the heist blueprint below 👇
🎯 ENRY POINTS (Where to Strike!)
🏴☠️ LONG RAID (Bullish Thieves):
Break & Grab: Enter above 3450.00 (Pullback Zone)
"Wait for the breakout, then ambush!"
🐻 SHORT RAID (Bearish Bandits):
Sneak Attack 1: Sell below 3300.00
Sneak Attack 2: Sell below 3260.00 (Support Wall Cracked!)
🛑 STOP-LOSS (Escape Routes)
Bullish Trade: SL at 3230.00 (Guard your loot!)
Bearish Trade 1: SL at 3360.00 (Don’t get caught!)
Bearish Trade 2: SL at 3280.00 (Risk = Reward!)
(Adjust SL based on your risk appetite & lot size!)
💰 TAKE-PROFIT (Cash Out & Flee!)
Bullish Thieves: TP at 3270.00 (Or escape early!)
Bearish Bandits (1): TP at 3270.00
Bearish Bandits (2): TP at 3210.00 (Big score!)
⚠️ WARNING: Market Traps Ahead!
News = Danger Zone! 📢 Avoid new trades during high-impact news.
Trailing SL = Your Getaway Car! Lock profits & evade reversals.
📰 FUNDAMENTAL BACKUP (Why This Heist Works)
Bearish momentum fueled by macro trends, COT data, & sentiment.
Stay sharp—markets shift fast!
💥 BOOST THIS HEIST! 💥
Like & Share to strengthen our pirate crew! 🚀 More alerts = More profits!
🚨 Next Heist Coming Soon… Stay Tuned! 🚨

EURUSD: Detailed Support Resistance Analysis For Next Week
Here is my latest support & resistance analysis for EURUSD
for next week.
Consider these structures for pullback/breakout trading.
❤️Please, support my work with like, thank you!❤️
I am part of Trade Nation's Influencer program and receive a monthly fee for using their TradingView charts in my analysis.

UNIUSDT.P – LONG SETUPCandle Craft fam — here’s a clean long opportunity shaping up on UNIUSDT.P (2D) that aligns with our strategy: momentum continuation backed by structure, not hype.
UNI just broke out of a multi-month range and is now consolidating right below resistance, printing a textbook bullish continuation flag on the 2D chart. The trend is strong, volume confirms, and the structure is respecting higher lows.
This is the kind of move that builds legs if BTC remains stable. Here’s how I’m positioning:
⸻
🟢 LONG ENTRY PLAN (2 Options):
1. Breakout Entry
• ✅ Entry Trigger: Above 11.10
• ⛑️ SL: 9.95 (below structure low)
• 🎯 Targets:
• TP1: 13.00
• TP2: 15.50
• TP3: 18.00+
2. Retest Entry (More Conservative)
• Entry Zone: 9.60 – 10.00
• SL: 8.80
• Targets: same as above ☝️
⸻
📊 Why This Setup Matters:
• Broke major range on strong volume
• Consolidating in a controlled pullback — bullish sign
• 2D structure showing strength (HH + HL)
• No divergence, no breakdown — just accumulation and compression
⸻
🧩 Candle Craft Note:
We favor structured breakouts, not emotional pumps. This setup gives us both entry flexibility and clean invalidation levels. Perfect R/R, perfect structure — we’re executing with discipline.
Let’s stay sharp, team. The market rewards patience and precision.
— Candle Craft

Analysis of gold price trend next week!Market news:
This week, international gold recorded its biggest weekly decline in a month. Spot gold turned sharply lower after a sharp rise and finally closed lower. Signs of progress in US-EU trade negotiations hit the safe-haven demand for London gold prices. Geopolitical situation is also a factor in the downward trend of gold prices. On the 25th local time, Tahir Noonu, a senior Hamas official, said that Hamas was absolutely positive about the efforts of the relevant mediators, but was surprised by the US statement. Before the United States and the European Union made progress in trade negotiations, fund managers raised their bullish bets on gold to the highest level since April this year. The trade war has pushed gold prices up 27% this year. Although the easing of trade tensions will weaken safe-haven demand, gold has also been supported by strong buying from central banks.Next week, international gold prices will focus on US-EU and US-China trade negotiations. If the negotiations are optimistic, gold prices may continue to test the $3,300/ounce mark; in addition, focus on the Federal Reserve's resolution. After Trump's visit to the Federal Reserve headquarters, whether the Federal Reserve will maintain its independence will be highlighted in this resolution. Non-agricultural data will also be released on Friday, which needs attention.
Technical Review:
From the weekly gold level, gold is still in a wide range of 3500-3120. It has been fluctuating for ten weeks. The Bollinger Bands are gradually shrinking. MA5 and MA10 are running horizontally, indicating that gold fluctuations will continue. This time, gold stabilized and rose from 3247 to 3438 and then fell back. The current short-term range is 3247-3438! Next week, pay attention to the range of fluctuations and choose a new direction after the narrowing. The daily level is currently in the 4th wave adjustment. There is a high probability that there will be a 5th wave rise after the adjustment, and then a large-scale ABC adjustment will be started. At present, there are two changes in the structure of the 4th wave, one is the triangle contraction and the other is the ABC structure. No matter how it runs, the market outlook is to wait for low-level long positions to see the 5th wave rise. In the short term, gold is still oscillating and selling.
Next week's analysis:
Gold is still adjusting, but it has basically adjusted in place. The current daily price has also adjusted to the key support level of 3300. Similarly, the four-hour chart just stepped back to the upward trend line support, which is the short-term long order entry. Buy above the 3300 mark next week! Next week, gold is expected to further test the 3310-3280 support level. Gold at the 4-hour level peaked at 3438 and then fell back. It has now formed a unilateral trend. The K-line is under pressure from the 5-day moving average and continues to set new lows, and breaks the short-term upward trend line. The Bollinger band opens downward and diverges, and the MACD water cross diverges downward to underwater, indicating that the current gold trend is in an absolute weak position! Next, gold will continue to test the support near the previous low of 3300. If 3300 is not broken, gold buying will continue to have momentum. If 3300 is broken, the short-term rise will end, and the subsequent rebound will basically be just a correction. However, the current 4-hour green column shows signs of shrinking volume, so it is not easy to sell at a low level. Try to sell after the rebound correction, or buy at a low level!
Operation ideas:
Short-term gold 3305-3308 buy, stop loss 3297, target 3350-3370;
Short-term gold 3350-3353 sell, stop loss 3362, target 3320-3300;
Key points:
First support level: 3320, second support level: 3309, third support level: 3300
First resistance level: 3346, second resistance level: 3360, third resistance level: 3375

XAUUSD Gold closed bearish and I’ll continue looking for sells. I’d prefer gold to retrace and create a LH and continue selling towards 3310. Last time price was around 3310, it had a massive bullish run so that’ll be the only area I’d sell to unless price breaks that support.

PHBUSDT Bounces from the Golden Pocket?🧠 Market Context & General Analysis
Phoenix (PHB) is currently at a critical juncture in its market structure. After a prolonged downtrend from its 2024 highs, price has now reacted strongly off a key Fibonacci Golden Pocket retracement zone (0.5–0.618), which also aligns with a historically respected demand area.
This level is not just a technical formality – it’s a zone where smart money typically enters, and historically it has provided reliable bullish reversals.
---
📍 Key Zones to Watch
🟨 Demand / Accumulation Zone:
0.549 – 0.608 → Fibonacci 0.5–0.618 + Historical support
⤷ Has been retested and shows early signs of a bullish reaction.
📈 Layered Resistance Zones (Fibonacci Targets):
0.834 → Minor resistance + potential double bottom neckline
1.028 → Previous structural resistance
1.200 → Psychological round level
1.458 → Key Fibonacci extension
1.945 – 2.735 – 3.648 → Mid/long-term Fibonacci targets
4.149 → All-Time High (ATH) on this chart
🔻 Major Support if Breakdown Occurs:
0.326 → Historical bottom / last line of defense
---
🧩 Pattern Formation: What’s Emerging on the Chart?
🔄 Potential Double Bottom:
Price structure is showing signs of a potential reversal formation in the form of a double bottom near the 0.55–0.61 zone. A confirmed breakout above the neckline at 0.834 would validate this bullish setup.
📉 Broken Downtrend Channel?:
PHB was previously trading in a downtrend channel. The current move suggests a possible breakout and the beginning of a trend shift or accumulation phase.
---
✅ Bullish Scenario: The Rise of the Phoenix
If the price holds above 0.608 and confirms with a strong breakout above 0.834, a bullish trend reversal could follow.
🚀 Short-term targets: 0.834 → 1.028
🔥 Mid-term targets: 1.200 → 1.458 → 1.945
🌕 Long-term potential: 2.735 – 3.648 – 4.149
Validation Key: Break above 0.834 with strong volume
Bullish confirmation candle: Bullish engulfing / Marubozu on 4D or Daily
---
⚠️ Bearish Scenario: Breakdown Threat Looms
If the price fails to hold the 0.549 support level, we could see a continuation of the downtrend, potentially targeting:
💀 First stop: 0.45 – 0.40 zone
🧊 Extreme case: Drop toward 0.326 (historical low)
Breakdown Confirmation:
Daily or 4D close below 0.549
Followed by selling volume and no quick recovery
---
🎯 Potential Trading Strategies (Not Financial Advice):
🟢 Bullish Swing Entry: Buy zone at 0.55–0.61
⤷ Targets: 0.834 – 1.028
⤷ Stop-loss: Below 0.52 (close basis)
🔴 Breakout Trade: Enter on breakout above 0.834 with volume
⤷ Targets: 1.200 – 1.945
⤷ Stop-loss: Below 0.80
🔵 Bearish Play / Re-entry: Short if break below 0.549
⤷ Targets: 0.40 – 0.326
⤷ Stop-loss: Above 0.60
---
🧲 Final Thoughts
PHBUSDT is in a make-or-break zone, sitting atop the Golden Pocket and showing early bullish momentum. If buyers step in and maintain the momentum, we could be witnessing the early stages of a significant market reversal.
However, failure to hold the key support at 0.549 would likely shift the sentiment back into bearish territory. Volume and confirmation candles will be the deciding factor for the trend’s next direction.
#PHBUSDT #PhoenixCrypto #AltcoinReversal #GoldenPocket #CryptoTA
#FibonacciLevels #BullishSetup #BearishBreakdown #ChartPatterns

GOLD (XAU/USD) SHORT TRADE PLAN
July 25, 2025
Trade Overview (My setup)
- Direction: Short (SELL)
- Entry Price: $3,330
- Take-Profit: $3,270
- Stop-Loss: $3,370
- Lot Size: 0.18 lots (18 oz)
- Risk: $720
- Reward: $1,080
- Risk/Reward Ratio: 1.5 : 1
Technical Analysis Supporting the Bearish Bias
1. Price Structure & Trend
- Descending channel observed on the 4H chart - strong short-term bearish signal.
- Series of lower highs and lower lows confirms bearish trend.
- Price is testing $3,325-$3,300 support - breakdown opens downside to $3,270-$3,250.
2. Key Support/Resistance Zones
- Key support: $3,300 being tested.
- Resistance: $3,360-$3,370 zone - logical stop-loss location.
3. Indicator Confirmations
RSI (4H): ~35-40, bearish territory, no bullish divergence.
Moving Averages: Price below 50 EMA and 200 EMA - bearish crossover.
MACD: Bearish crossover, histogram confirms selling momentum.

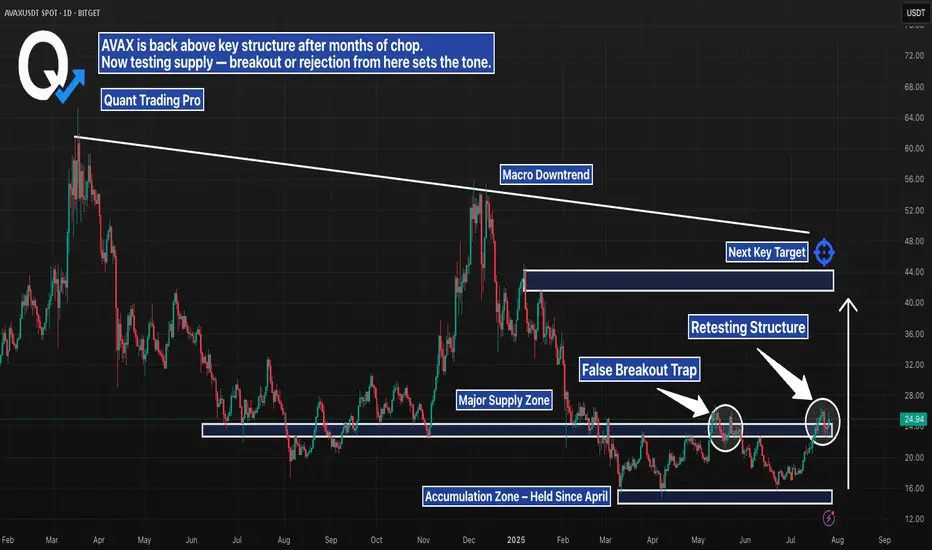
AVAX Daily – Breakout or Another Trap?AVAX just pushed into a major supply zone, testing structure that’s capped price since early 2024. After months of chop and accumulation, bulls have finally reclaimed key support — but the real test is happening now.
Here’s the setup:
– Retesting structure after first rejection
– Sitting below a clear macro downtrend line
– Above an accumulation zone that held for months
– Next key target sits near $40–44, with confluence from prior highs and trendline resistance
This is the kind of move that either builds serious momentum — or turns into another trap. Wait for confirmation. Volume and reaction here will say everything.
#AVAX #Altcoins #CryptoBreakout #SupplyZone #TrendlineResistance #TechnicalAnalysis #QuantTradingPro #PriceAction
CRYPTO ALT SEASON One blue box, two different stories:
Above - Bull season
Below - Bear season
Not a financial advice

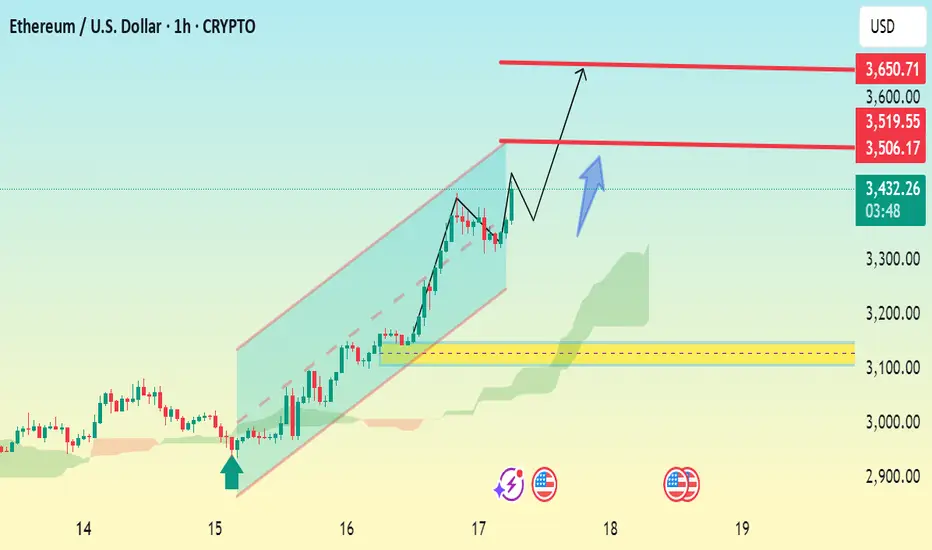
ETHUSD 1h Bullish Reversal SetupChart Analysis Summary:
Current Price:
$3,429.21 (at the time of the screenshot)
Trend:
Strong uptrend within a bullish ascending channel.
Price has been respecting the trendline and moving upward steadily.
Key Chart Patterns & Tools:
Ascending Channel: ETH is trading within an upward sloping channel, suggesting bullish momentum.
Ichimoku Cloud (green): Price is trading well above the cloud, reinforcing bullish sentiment.
Breakout Structure: The chart shows a small consolidation/pullback with a projected bullish breakout.
📈 Key Levels:
Type Price Level (USD) Notes
Current 3,429.21 Live price
Resistance 1 3,506.17 Minor resistance
Resistance 2 3,519.55 Immediate breakout target
Final Target 3,650.71 Major resistance and potential price objective
🧭 Price Action Forecast:
If ETH holds above $3,429 and breaks above $3,519.55, the path toward $3,650 remains open.
A small pullback (as indicated by the blue arrow) is expected before continuation.
As long as price remains within or near the ascending channel, the bullish scenario .
✅ Bullish Confirmation:
Break and retest of $3,519.55.
Continued support above the Ichimoku cloud.
Holding the trendline from the ascending channel.
BULLISH H4 MOMENTUM ACTIVATED...?📊 Pattern & Structure:
The chart shows a downward channel (falling wedge) pattern that has recently been broken to the upside, indicating a bullish breakout.
The breakout is clean, with a sharp upward move, confirming the reversal from the bearish trend.
🔍 Key Levels Identified:
Support Zone:
142.284 – 141.790 (marked with an orange box)
This zone acted as a strong demand/support area.
Price bounced strongly after reaching this zone.
Immediate Resistance Levels:
145.799 – Near-term resistance.
147.000 – 147.629 – Key resistance zone (highlighted with a red horizontal line).
148.725 – Final bullish target/resistance on the chart.
📈 Bullish Scenario (highlighted with arrows and wave projection):
Price has broken out of the falling wedge, retested, and is pushing higher.
Target zone: 147.000–148.725.
The chart suggests a bullish projection, with further gains expected if the price sustains above 145.47.

AAPL HEADING INTO AUG 25'AAPL TOPPED @ 250-260 TO CLOSE OUT 24
BAD Q1
Consistent since then.
Consolidation happened @ key weekly support $194-198 range, solid move up after.
Long Apple currently.
They have the IPHONE 17 releasing in Sept with a few new colors and new back design as well as other affordable options to assist with consumer retention, entry and re entry into the apple hemisphere for consumers.
Earnings July 31st, currently expected to increase YOY for Q3.
I expect earnings to come in strong to assist with the move up to try and work back to retest ATH again.
Long back up to $247 range to close out 2025 for Apple. End of year Q3, Q4 is always their time to shine. Don't think we see a break of ATH in 2025 for Apple though. Retest, to come back down slightly again before major break.

#KDA/USDT Stay Adaptive ?#KDA
The price is moving within a descending channel on the 1-hour frame, adhering well to it, and is on its way to breaking it strongly upwards and retesting it.
We have a bounce from the lower boundary of the descending channel. This support is at 0.4260.
We have a downtrend on the RSI indicator that is about to be broken and retested, supporting the upside.
There is a major support area in green at 0.4186, which represents a strong basis for the upside.
Don't forget a simple thing: ease and capital.
When you reach the first target, save some money and then change your stop-loss order to an entry order.
For inquiries, please leave a comment.
We have a trend to hold above the 100 Moving Average.
Entry price: 0.4530
First target: 0.4625
Second target: 0.4754
Third target: 0.4932
Don't forget a simple thing: ease and capital.
When you reach the first target, save some money and then change your stop-loss order to an entry order.
For inquiries, please leave a comment.
Thank you.

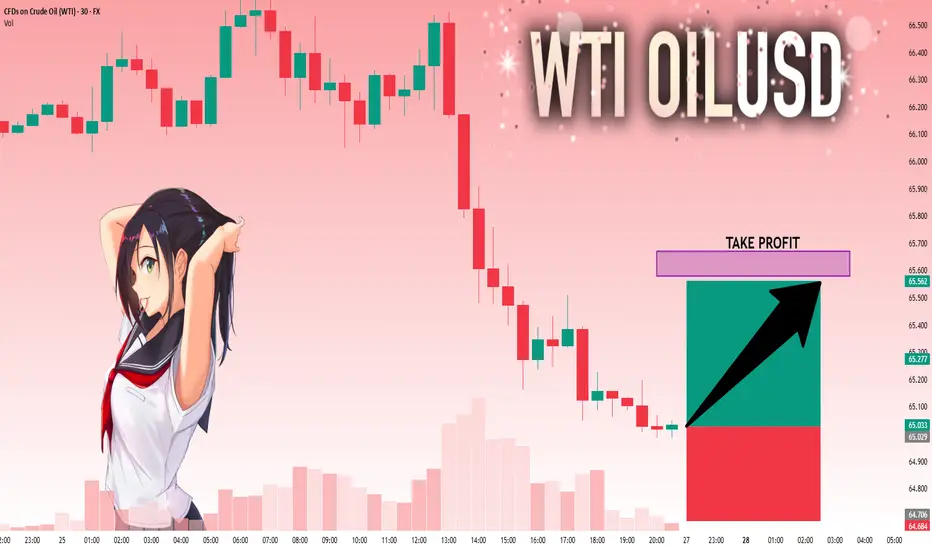
USOIL: Next Move Is Up! Long!
My dear friends,
Today we will analyse USOIL together☺️
The market is at an inflection zone and price has now reached an area around 65.029 where previous reversals or breakouts have occurred.And a price reaction that we are seeing on multiple timeframes here could signal the next move up so we can enter on confirmation, and target the next key level of 65.579.Stop-loss is recommended beyond the inflection zone.
❤️Sending you lots of Love and Hugs❤️
TOTAL 2 # 002 ( GOOD for Altcoins )Hello dear traders .
Good days .
First of all thanks for your comment and support.
----------------------------------------------------------------------
Total 2 is growing in rising wedge .
With refer to the last Daily Bullish Gann Square ( Blue Square) and Bearish Gann Square and with considering bitcoin dominance which start its correction, expected to ALTCOIN season started and it can rise up to 8-9 T dollars which is looks good opportunity for investment together great benefits within a year .
Safe trades and good luck

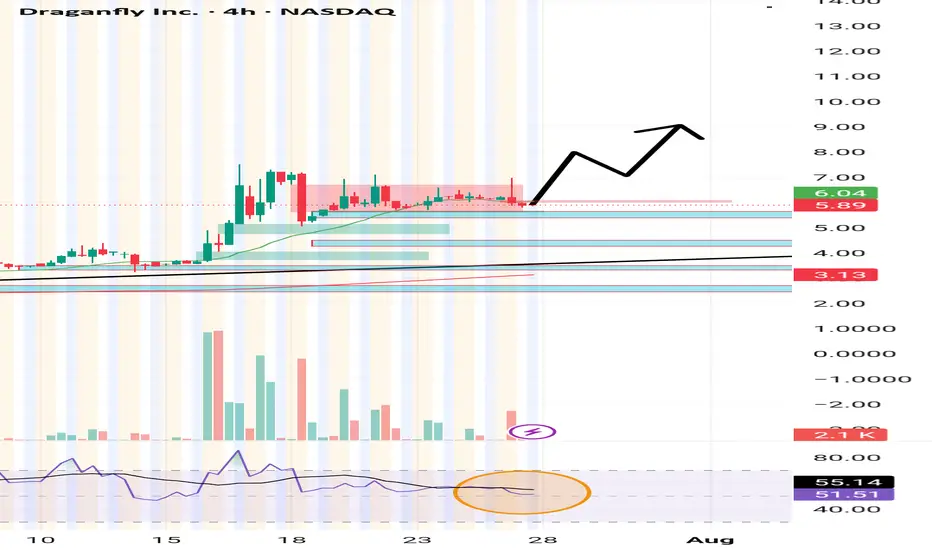
Possible upside continuation?If the Rsi curls off the center line and as price has maintained the $5.80 could we get a bounce or squeeze into next week?
TONUSD TONUSDT TONCOIN mid- to long-termIn my view, we are still in the accumulation phase. The current price action and reactions at key levels suggest ongoing accumulation.
🔻 Bearish Scenarios:
In the short term, a retest of the lower boundary of the accumulation zone (purple box) is possible if the market weakens.
The worst-case scenario would be a move down to the lower green support zone, which has historically triggered strong bullish reactions. This is a critical demand area.
🔼 Bullish Scenarios:
A confirmed breakout and hold above the white line (within the purple box) would signal strength and a potential move higher.
We would then likely see a retest of the upper boundary of the accumulation zone.
A breakout and consolidation above the yellow line would open the door for a move toward the wider yellow channel, which could act as a final target zone
🚨 High-Risk Zone:
The yellow channel might represent the final phase of the current move.
From there, we could see either a sharp correction
Or, if trend strength and macro conditions allow, a continuation towards a new ATH (purple line).
📌 📌 📌 :
All marked lines and zones represent key support and resistance levels.
Price reaction at these areas will be crucial for decision-making.
As always, risk management and trend confirmation are essential.
