GOATUSDT Retest at Key Demand Zone – Accumulation or Breakdown?🔍 Comprehensive Technical Analysis
After experiencing a prolonged downtrend since late 2024, GOATUSDT finally broke out of a long-term descending trendline in early May 2025 — a potential early signal of a medium-term trend reversal. However, the price has now pulled back, retesting a major support zone that coincides with the previous breakout structure.
---
🧱 Key Zone: Demand Area + Trendline Retest
Price is currently trading within a crucial demand zone between $0.090 – $0.100, which previously acted as a major resistance and now serves as support. This area is technically significant due to:
Confluence of horizontal support and the retest of the descending trendline.
A previous accumulation zone that led to a breakout.
Clear historical buyer reaction from this region.
---
📐 Price Structure & Pattern
Descending Triangle Breakout: Successfully broken to the upside in May.
Support-turned-Resistance-turned-Support: A classic structure flip.
Horizontal Consolidation: Price is ranging in a narrow zone, indicating either accumulation or distribution.
---
🐂 Bullish Scenario (Potential Rebound):
If the price holds and bounces with increased volume from the $0.090 – $0.100 zone, it could confirm a strong accumulation phase and initiate the next leg up.
🎯 Bullish targets:
1. $0.15745 — Minor resistance
2. $0.21071 — Psychological and technical resistance
3. $0.24889 — Fibonacci extension level
4. $0.41017 — Mid-term breakout target
> Bullish confirmation: Bullish engulfing or hammer candle with high volume from the demand zone.
---
🐻 Bearish Scenario (Breakdown Risk):
If the price breaks below $0.093 and closes with strong bearish volume, this may confirm weakness and trigger a deeper correction.
📉 Downside targets:
$0.06500 — Minor historical support
$0.04900 — Previous base level
$0.03550 — All-time low (critical support)
> Bearish confirmation: Clean breakdown followed by a failed retest back into the range.
---
📊 Strategic Summary:
GOATUSDT is currently at a pivotal decision point. The zone between $0.093–$0.100 acts as a battleground for bulls and bears. A bounce could signal accumulation and a bullish reversal, while a breakdown could lead to continuation of the bearish trend.
🎯 Key focus: Price action and volume reaction at the demand zone.
---
🧲 Bullish Narrative Catalysts:
Renewed interest in low-cap altcoins
Gradual increase in volume since the breakout
Selling pressure weakening near key support
#GOATUSDT #CryptoBreakout #TrendlineRetest #TechnicalAnalysis #AltcoinAnalysis
#DemandZone #SmartMoneyConcepts #BreakoutOrFakeout
Community ideas

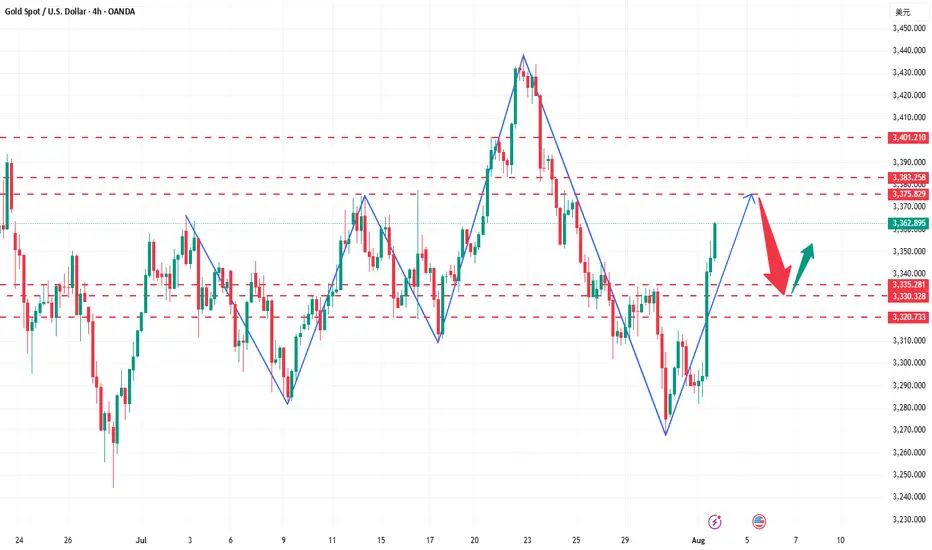
The trend is clear, why do I choose to be firmly bullish on goldGold Trend Analysis: Yesterday, the gold market demonstrated strong upward momentum, opening near 3290 before falling slightly to a low of 3281 before fluctuating upward. Boosted by the non-farm payroll data, the gold market surged during the US trading session, reaching a single-day gain of 2.02%, reaching a high of 3363 and closing there. The daily chart formed a long bullish candlestick with a long lower shadow, forming a Morning Star pattern, reinforcing the bullish trend. From the perspective of the cycle structure, the daily level is clearly in the 5-wave upward stage, and the upward trend of the large cycle has not changed. At the indicator level, the daily MACD momentum column (the column below the zero axis) represents the short-selling momentum. Its "gradual shortening" means that the short-selling force is weakening and the downward momentum is gradually fading. It is a potential signal of stopping the decline or rebounding. KDJ is about to form a golden cross between 20-50, which is a signal that short-term bullish power is beginning to increase, and the overall trend is bullish.
The 4-hour level shows typical bullish characteristics: the moving average system is arranged in a bullish pattern, but there is a certain deviation between the short-term price and the moving average. The technical side needs to correct the deviation rate through a callback before continuing to rise. The short-term support below is focused on the line near 3330-3335. This position is both the relay support level in the previous rise and the intersection of the 4-hour moving averages MA10 and MA20, which has strong support strength; the short-term resistance above is focused on the line near 3370-3383. This area is a pressure-intensive area near the previous high point. If it can be effectively broken through, it will further open up upward space. A successful breakout would open up further upside potential. A breakout would further open up the 3400 mark.
For gold trading, the short-term strategy is to buy on dips. If the price pulls back to the 3330-3335 support level, consider entering a long position with a target of 3355-3365. If it reaches 3370-3380, consider a short-term short position with a target of 3350-3340.
US30 Swing Short!
HI,Traders !
#US30 keeps falling down
And the index broke the
Key wide horizontal level
Around 43924.6 which is now
A resistance and the breakout
Is confirmed so we are very
Bearish biased and we will
Be expecting a bearish
Continuation on Monday !
Comment and subscribe to help us grow !

LONG WEEKLY ANALYSIS. USDCHF USDCHF may be starting a bullish reversal on the weekly chart. RSI shows bullish divergence (price made a lower low, but RSI made a higher low).
Stochastic RSI also supports the move up.
Next major resistance is near 0.8600 area
Wait for a retest in the next coming days before entering any long positions for better confirmation .
do not jump into long position right now !!! (It is a weekly chart) ,be patient ,the price may go down before reversing to the upside .

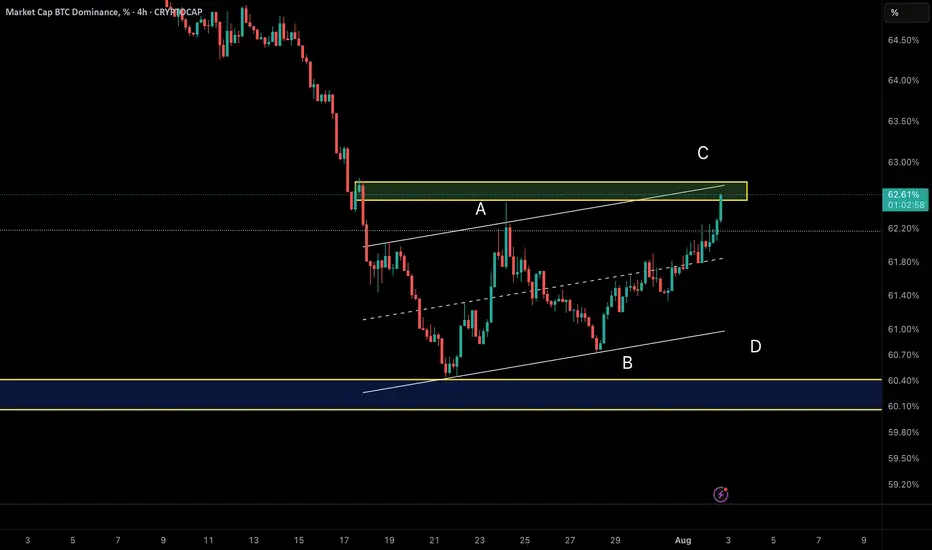
Smart Money Watching BTC Dominance – Rotation to Alts IncomingAfter a deep correction, BTC Dominance has entered a corrective upward phase inside an ascending channel.
Wave A rallied from 60.5% to 62.3%, followed by Wave B retracing to 60.74%.
Currently, Wave C is developing and has reached around 62.2%.
The key resistance sits near 62.7%, exactly at the upper trendline of the channel. This could act as a reversal point, potentially ending Wave C and triggering a bearish move.
💡 Implication:
If dominance drops from this zone, we could see capital rotation into altcoins, supporting a bounce across the broader altcoin market.
EPIC : Risky signal...Hello friends🙌
🔊Due to the good price growth, we have found important support points for you.
Now, due to the price correction, we have found buy points for you and you can buy with risk and capital management and move with it until the goals we have set for you.
🔥Follow us for more signals🔥
*Trade safely with us*

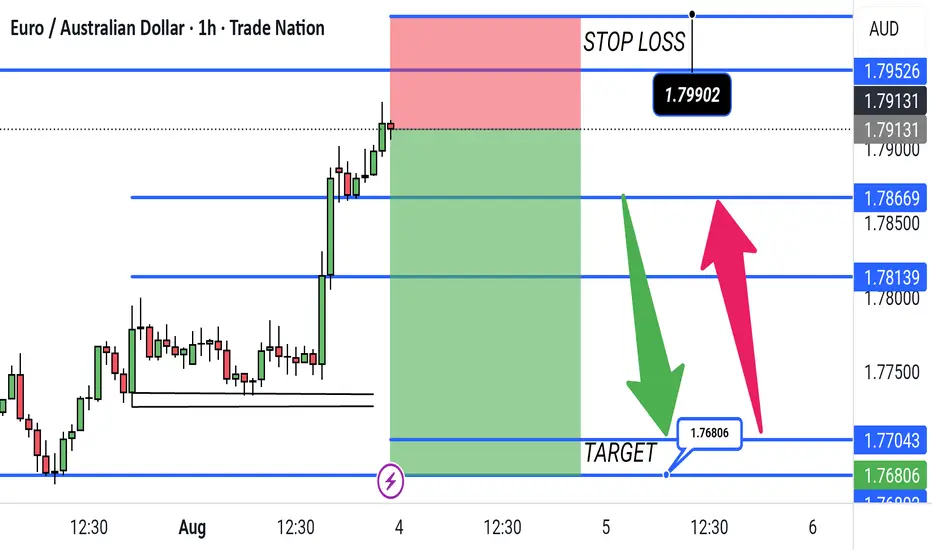
EURAUD Short Trade Setup Targeting 1.76806 with Stop at 1.79902This is a 1-hour EUR/AUD trading chart showing a short (sell) setup. The entry is near the current price level, with a target at 1.76806 and a stop loss at 1.79902. The green arrow indicates the expected downward move, while the red arrow shows the risk of upward movement if the trade goes against the plan.
Moodeng Liquidity Grab + ReversalStrategy: Liquidity Grab + Reversal
Entry: $0.15350-$0.15000
Stop Loss: $0.14490
Take Profits: $0.17600, $0.19500
📊 Rationale:
– HTF trend: Range-bound with engineered downside inducement
– LTF structure: Watching for bullish CHoCH after sweep below local support
– Liquidity targeting: Price is likely to run sell-side stops below $0.16000–$0.15000 and reverse from unmitigated demand
🧠 Volume remains calm, OI is stable, and market is setting up for a clean liquidity sweep into a prior reaction zone. Confirmation will follow from M5–M15 CHoCH after the sweep.
⸻
🧠 Stay sharp. Trade smart. Let the market come to us.

DOLLAR INDEX DXYThe U.S. Dollar Index (DXY) is a measure of the value of the United States dollar (USD) relative to a basket of six major foreign currencies. It reflects how strong or weak the dollar is compared to these currencies collectively. The index was created by the Federal Reserve in 1973
The six currencies included in the basket and their approximate weightings are:
Euro (EUR): 57.6%
Japanese Yen (JPY): 13.6%
British Pound Sterling (GBP): 11.9%
Canadian Dollar (CAD): 9.1%
Swedish Krona (SEK): 4.2%
Swiss Franc (CHF): 3.6%
The DXY is calculated as a weighted geometric average of the dollar's exchange rates against these currencies. When the dollar strengthens against this basket, the index rises; when it weakens, the index falls.
The index is widely used by traders, investors, and economists to gauge the overall strength of the U.S. dollar in global currency markets and to inform trading and economic decisions.
In essence, the Dollar Index provides a standardized barometer of the U.S. dollar's value against its major international trading partners' currencies.
The U.S. Dollar Index (DXY) is trading near 98.684 of August 1, Friday market close.
July saw the DXY record its first monthly gain in 2025 (rising nearly 1%) as a a result of the demand floor on ascending trendline acting as dynamic support .but selling has resumed at the start of August on ADP data report, the current supply roof presents resistance to upswing capping gains on economic outlook and immigration enforcement concern.
Key Fundamental Drivers (August 2025):
Fed Policy & Inflation: The Federal Reserve kept rates steady at 4.25–4.50% in July, but persistent inflation (core PCE up to 2.8% YoY in June) and the impact of new U.S. tariffs are keeping rate cuts on hold for now.
Tariffs & Trade Policy: Fresh, globally-applied U.S. tariffs announced at the end of July have heightened risk aversion, helped the dollar find support, and stirred inflation concerns—as import price increases feed into core inflation data.
Interest Rate Differentials: While the Fed holds rates high, other central banks (especially the ECB and BOE) are signaling further easing. The resulting policy divergence still gives the dollar some support, but large inflows into alternative markets (e.g., eurozone equities, gold, yen) have also pressured the greenback.
Safe-Haven Flows: Risk-off sentiment amid trade tension and global policy uncertainty continues to prompt investors to seek the relative safety of the dollar, limiting its downside.
Composition: The DXY measures the value of USD relative to a basket of currencies: euro (57.6%), yen (13.6%), pound (11.9%), Canadian dollar (9.1%), Swedish krona (4.2%), and Swiss franc (3.6%).
The path ahead depends on upcoming U.S. inflation prints, additional Fed commentary, and how global markets react to ongoing trade disputes and central bank moves.
Longer term,
The DXY remains under pressure at the start of August 2025 but is showing tentative signs of stabilization just below the key 100 mark. The trend will hinge on Fed policy, global inflation data, and the impact of new tariffs on both inflation and global risk appetite. If buying breaks and close above weekly resistance roof then 104-103 can be reclaimed.
trading is 100% probability ,manage your risk and know that any key level can fail.
#dollar #dxy #money #eurusd #gbpusd #audusd #usdjpy

Bitcoin: Expected Cool-Off or Cause for Concern?After rallying more than 25% off the June lows, Bitcoin is finally taking a breather with a much-anticipated pullback. But as expected, the fear meter is spiking, especially across CT.
Was this cool-off really a surprise? Not quite.
The signs were there: price stalling at upper extremes, responsive sellers stepping in at perceived overextensions, and inefficient zones left behind during sharp impulsive moves.
Of course, reading it in real-time is easier said than done. Emotions always complicate execution , but that’s a separate conversation.
In this post, let’s break down the current structure in detail —using volume profile, TPO charts, and market structure analysis, to give you a clearer picture of what’s unfolding. We’ll also explore a few scenarios worth watching as the next move shapes up.
Let’s dive in!
Table of Contents
➺ Volume Profile
➺ TPO
➺ Key Technical Insights
➺ Market Structure
➺ Trade Scenarios and What to Watch
➺ TLDR
⦿ Volume Profile
Currently, we’re seeing two key zones of balance : one broad range that held for over 60 days and a tighter 21-day structure that formed at higher levels. These are classic areas of value where buyers and sellers found temporary agreement, establishing balance.
The sharp move from ~111,000 to ~122,000 was largely impulsive , with little volume built along the way, suggesting initiative buying in early July. As is often the case with such thin zones, they tend to get revisited once momentum fades. That’s exactly what we’re seeing now.
As price dips into this low-volume pocket, the key question is:
Will the market accept this zone and begin building value here, or will it reject and bounce back toward higher ground?
Looking at the Volume Range Visible Profile (VRVP) since June 7th, the nearby Value Area High (VAH) sits around ~111,000 . If current support doesn’t hold, this becomes the next major volume magnet. That said, there’s also a low-volume node (LVN) just above 111,000 , which could act as a demand pocket and trigger a responsive bounce.
In simple terms:
– Acceptance into the LVN could lead to new range formation at lower levels
– A sharp bounce off ~110,000 might reestablish the prior higher balance, or create a fresh range between the two existing areas
The next few sessions will reveal whether the market is hunting for new value or just shaking out weak hands.
⦿ TPO
Zooming into the 4H TPO chart, we can clearly see the evolving monthly profiles from May through August. And as is often the case, the market found resistance right where you’d expect: at the extremes.
The upper end of July’s profile became a battleground. Buyers attempted multiple pushes above that upper balance, but each effort was consistently faded by responsive sellers , signaling growing exhaustion at the top.
Eventually, that pressure gave way to an impulsive breakdown, driven by initiative selling. Notably, price didn’t rotate gently back into the previous range, but it sliced straight into a thin zone of prior low participation.
Now, the market is sitting at the low-volume region , and the next key battle is shaping up. Additionally, The 108,000 to 110,000 area carries weight as it served as the Value Area High (VAH) for both the May and June profiles. If buyers are going to respond, this is one of the more likely places for them to step in.
⦿ Key Technical Insights
▸ Failed Acceptance Above 21-Day Balance
Repeated attempts to hold above the short-term balance were rejected, signaling buyer fatigue and a lack of conviction at higher levels.
▸ Initiative Sellers Took Control
Once demand dried up, sellers stepped in aggressively. The thin participation during the recent rally left little structural support, allowing price to drop quickly.
▸ No Value Built Below Yet
The zone currently being tested saw minimal trading earlier. If bulls want to reclaim control, they’ll need to build value here and establish a new base.
▸ Prior Balance High as Potential Support
Price is now retesting the top of the 60+ day balance area from above, a classic setup where previous resistance can become support. This area also aligns with a known demand shelf.
▸ Deviation Below the 200 MA Cloud
Price has slipped below the 200 MA cloud and is nearing a key flip zone. A test of the 110,000 level next week wouldn’t be surprising. That area could serve as a strong support zone where a new accumulation phase begins.
⦿ Market Structure
The broader market structure points to a transition in progress. After spending over two months in balance , price broke out to the upside —only to form another short-lived range at higher levels. That, too, gave way to a swift breakdown.
This kind of “failed acceptance at higher prices” is often an early signal that the market may revisit prior zones of interest, typically areas where value was last built.
All eyes now shift to the 110,000–111,000 zone , the high of the previous 60-day balance.
We’re in a classic test-retest phase, where the market is probing for conviction . These moments often set the stage for the next significant move, either continued distribution lower, or the beginning of a re-accumulation phase.
⦿ Scenarios & What to Watch
As Bitcoin pulls back into key structural zones, several scenarios are in play. Here's what to monitor in the coming sessions:
Scenario 1: Re-Acceptance into 21-Day Balance
▸ If price reclaims and holds above ~116K, we could see a rotation back toward the upper end of the short-term balance near ~120K.
▸ This would suggest the recent breakdown was a failed auction or bear trap, not the start of a broader trend reversal.
▸ Watch for initiative buying above the demand shelf with follow-through volume.
Scenario 2: Choppy Mid-Balance Activity
▸ Price remains range-bound between ~110K and ~116K, forming a new short-term balance zone.
▸ Expect slower movement and back-and-forth behavior as the market decides its next direction.
▸ Patience is key here. Watch volume and initiative behavior to gauge strength.
Scenario 3: Rejection and Continuation Lower
▸ If price fails to hold above ~110K, there’s potential for a move down to the POC near ~104K, or even deeper toward ~100K (Value Area Low).
▸ These are low-volume zones, which rarely offer strong support unless new value is built.
▸ This would signal a continuation of the current imbalance and potentially mark a structural trend shift.
I’m primarily focused on Scenario 1 and 2 , as we appear to be in a late bull phase. A deeper pullback toward 100K increases the risk of a broader trend change, making it less attractive from a risk/reward standpoint.
⦿ TLDR
▸ Buyers failed to hold the top of the 21-day balance. Clear signs of exhaustion.
▸ Price dropped into a prior low-volume zone, which now acts as potential demand.
▸ This area has never been accepted before - either buyers step in, or we go lower.
▸ Reclaiming ~116K could fuel a move back toward 120K+.
▸ Failure to hold ~110K opens the door to 104K, maybe even 100K.
What happens next week will likely set the tone for the next major move. Watch how the market responds to acceptance vs rejection zones, and let price action confirm your bias before you act.
If you found this analysis helpful, share it with someone who trades Bitcoin. 🥰
What’s your read on the current structure? Let me know in the comments! 📉
⚠️ Disclaimer
As always, this post is purely for educational purposes. I am not a financial advisor, and nothing here should be taken as financial advice. Always consult your financial advisor before making any investment or trading decisions. Or at the very least, consult your cat. 🐱

Continued recovery, positive after NFP news✍️ NOVA hello everyone, Let's comment on gold price next week from 08/04/2025 - 08/8/2025
⭐️GOLDEN INFORMATION:
Gold prices surged over 1.5% on Friday, climbing toward $3,350, as a weaker-than-expected U.S. Nonfarm Payrolls (NFP) report signaled a faster-than-anticipated slowdown in the labor market. Heightened geopolitical tensions between the U.S. and Russia further boosted safe-haven demand for the precious metal.
Following the disappointing July jobs data, markets began pricing in a potential interest rate cut by the Federal Reserve. While the Unemployment Rate held relatively steady, signs of labor market softness supported recent comments from Fed officials Michelle Bowman and Christopher Waller, who advocated for a 25-basis-point rate cut at the July 29–30 meeting.
Additional data added to the cautious sentiment: the ISM’s July report confirmed that U.S. manufacturing activity remains in contraction territory, while consumer confidence took a hit, according to the University of Michigan’s latest survey.
⭐️Personal comments NOVA:
Gold prices continue to be positively affected after last week's NFP news, market expectations of an early rate cut are rising
🔥 Technically:
Based on the resistance and support areas of the gold price according to the H4 frame, NOVA identifies the important key areas as follows:
Resistance: $3384, $3434
Support: $3331, $3307, $3268
🔥 NOTE:
Note: Nova wishes traders to manage their capital well
- take the number of lots that match your capital
- Takeprofit equal to 4-6% of capital account
- Stoplose equal to 2-3% of capital account
- The winner is the one who sticks with the market the longest

Market StructureIf we look at the underlying market structure, Bitcoin's structure isn't fully formed yet. There are still unsolved puzzles around 135,000. I believe Bitcoin will finalize its final structure around 135,000, which will be its expansionary structure.
The final candle on this weekly timeframe will determine Bitcoin's direction. This August, Bitcoin will either continue its bullish structure or continue its minor retracement.
Disclamer: Any information provided is for educational and informational purposes only and does not constitute investment advice.

EURUSD: NEW WEEK TECHNICAL BIAS (MARKET OPEN)CONTEXT
The Monthly and Weekly timeframes still maintain a valid Ascend Sequence, with no confirmed trend breakdown yet.
However, the Daily has signaled a down Trend Shift, which I currently interpret as a correctional move—likely a pause before a continuation toward the primary HTF target zone.
📈 Expecting a rally toward 1.16439 or further into the 1.17031 zone.
📉 From there, a pullback into the 1.15727, 1.3524 and 1.12421 price levels.
This retracement could:
1. Extend toward or beyond the Range Low (RH)
2. OR form a Bid Accumulation Zone (BAZ) for a fresh leg in the HTF bullish narrative.
⚠️ There’s also a slim probability of 1.15727 acting as an early base to launch the rally.
● This projection is based purely on technical structure. No fundamental overlays.
📌 This is a strategic directional bias, not financial advice. Execute only with confirmation and proper risk management.

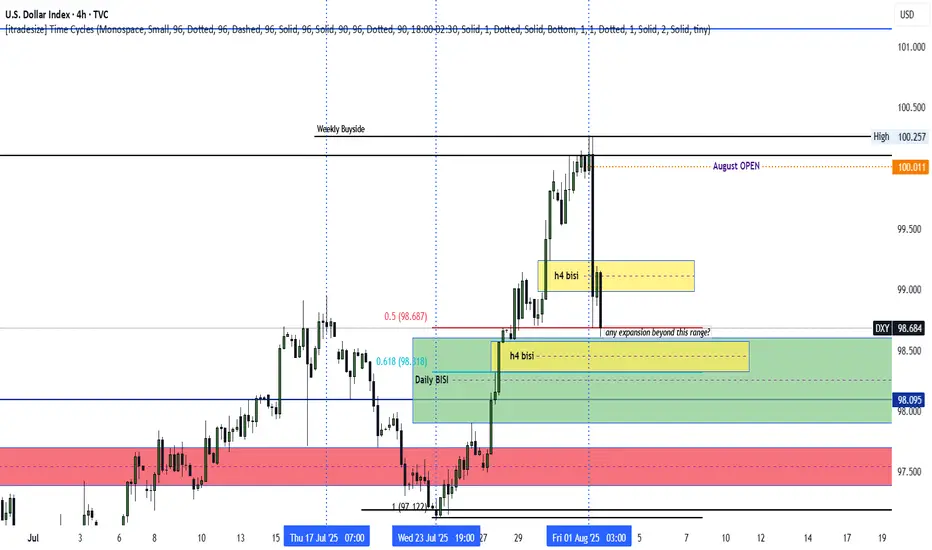
DXY bullish into AUGUSTThe dxy seems poised to rally following a rally above PMHs. The August OPEN decline could end up being nothing but a retracement as we rally high. Monday, Tuesday and Wednesday could range, while Thursday and the NFP push us above August's current highs. An expansion below Friday's New York AM lows (H4) could signal continued decline as we seek to establish weekly LOWS. Patience as the market unfolds is hand is ALWAYS key. Let's chat.

NZDUSD What Next? SELL!
My dear subscribers,
This is my opinion on the NZDUSD next move:
The instrument tests an important psychological level 0.5920
Bias - Bearish
Technical Indicators: Supper Trend gives a precise Bearish signal, while Pivot Point HL predicts price changes and potential reversals in the market.
Target - 0.5899
My Stop Loss - 0.5932
About Used Indicators:
On the subsequent day, trading above the pivot point is thought to indicate ongoing bullish sentiment, while trading below the pivot point indicates bearish sentiment.
Disclosure: I am part of Trade Nation's Influencer program and receive a monthly fee for using their TradingView charts in my analysis.
———————————
WISH YOU ALL LUCK

GBPJPY – Bearish Continuation Setup AheadPair: GBPJPY
Timeframe: 4H
Bias: Bearish
🔍 Technical Overview:
GBPJPY has broken down with high momentum and is now hovering at a 4H support zone (195.30). A clean break and close below this level opens the door for a deeper move toward the next support areas:
Entry Trigger: Break below 195.30
🎯 Target 1: 194.05
🎯 Target 2: 192.50
🛑 Stop Loss: Above 195.95 (previous resistance-turned-supply zone)
📉 RSI: 27.63 (Oversold but momentum-driven selloff suggests more downside)
🧠 Macro + Fundamental Confluence:
🏦 Central Bank Policy:
BOE (Bank of England) cut rates by 25bps (to 4.25%) in a hawkish tone, with internal disagreement (7–2 vote), signaling uncertainty and potential for further divergence.
Despite the “hawkish cut,” the market interpreted it cautiously, especially with falling UK economic momentum and weak retail data.
💴 Bank of Japan:
BoJ is slowly tightening policy — signaling an eventual exit from ultra-loose conditions.
Real interest rates remain negative, but the direction is now incrementally hawkish, strengthening the JPY across the board.
💡 Market Sentiment:
VIX at 20.42 = Risk-Off Environment → capital flows into safe-haven JPY, out of GBP.
With Nasdaq bullish, but volatility ticking up, JPY benefits from its safe-haven role.
📊 CFTC Positioning:
GBP: Longs decreasing, shorts rising, NNCs decreasing → Bearish bias
JPY: Longs flat, but massive drop in NNCs → institutional positioning is turning defensive
🧾 Economic Weakness:
UK Services PMI showing signs of stagnation
CPI and Retail Sales remain weak, suggesting limited scope for further GBP upside
Japan's latest Household Spending and Economy Watchers Survey show stabilizing conditions, supporting yen strength
📌 Final Take:
Fundamentals support the breakdown as monetary divergence and global sentiment drive capital into the JPY. Watch for confirmation via H4 close below 195.30 before entering the trade.
🧭 Trade idea aligns with macro, technicals, seasonality, and institutional flows.

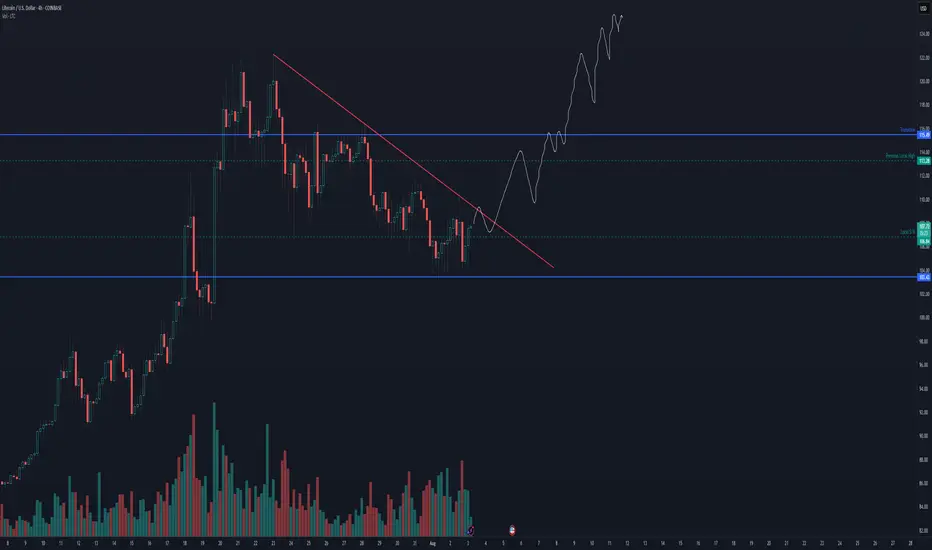
Litecoin is about to begin a leg upLitecoin is about to begin its first expansion. Alt season seems to be well underway and mid caps like LTC are next on the docket for money flow.
BTC NEW LOOKBtcusd sell from 115,000
Target1 114,000
Target2 112,000
Target3 110,000
Stope Lose 116,500
TRADE AT YOUR OWN RISK

HYPE LongFollowing a significant decline, the asset will take support and bounce back from this point.
Disclaimer: This is not financial advice.
This algorithm provides highly precise buy and sell signals with alerts:

Asian Paints Forming a W pattern looks bullish above 2613Asian Paints is showing a bullish reversal setup with a clear W pattern (Double Bottom) forming on the daily chart. The stock has tested the ₹2500 support zone twice and bounced, indicating strong buying interest. It is now approaching the neckline at ₹2600, a critical breakout level.
A sustained move above ₹2613, especially with good volume, could confirm the breakout and push prices toward the ₹2675–₹2700 zone, with a possible extension toward ₹2735. This setup provides a favorable risk-reward opportunity.
Trading Plan:
• Entry: Above ₹2613 on confirmation
• Stop Loss: ₹2580 (conservative) or ₹2560 (aggressive)
• Target: ₹2675–₹2700 (initial), ₹2735+ (extension)
Why it matters:
• Strong base at ₹2550 zone
• W pattern signaling reversal
• Breakout potential on good volume
This is a price-action-based setup, supported by pattern structure. Keep an eye on volume and market sentiment for confirmation and Ofcourse Nifty 50 needs to be bullish
Let me know your thoughts in comments
🔔 This is not financial advice. Please do your own analysis before taking any trade.

XAUUSD Daily Outlook – August 4, 2025We’re not in breakout. We’re deep in premium — and supply is stacked.
—
Gold is now trading at 3362, sitting right inside the first valid daily supply zone — the same block between 3355 and 3375 that caused the last rejection. The bullish rally from 3272 was clean: liquidity sweep, CHoCH, imbalance filled, HL confirmed. Bulls did their job. Now they’re walking straight into pressure.
Above this zone, things don’t get easier — they get trickier.
Just a bit higher, we have an internal supply trap between 3398 and 3412. It’s a reaction zone built from imbalance and inducement — not strong enough to hold a reversal on its own, but perfect to fake out breakout buyers. If price pushes through 3375 and enters this pocket, snipers should be watching carefully for early signs of weakness.
And finally, at the top of the current structure sits the HTF supply trap at 3430–3439 — the last weekly wick, the macro reversal zone. That level is sacred. If price makes it there, either we’ll see full-blown expansion… or a violent reversal born from overconfidence.
So what do we do now?
We wait.
If price starts to reject from this 3355–3375 supply with bearish intent, we target the flip reentry zone at 3318–3328 — the previous CHoCH break and dynamic EMA cluster. That’s your first intraday long trigger if bulls want to come back strong.
If that breaks, next is the demand base at 3287–3267, the origin of this entire bullish move. Below that? Imbalance support near 3225 — the final line before structure shifts.
—
🟥 Valid Supply Zone → 3355–3375
🟥 Internal Supply Trap → 3398–3412
🟥 HTF Supply Trap → 3430–3439
🟫 Flip Reentry Zone → 3318–3328
🟦 Demand Base → 3287–3267
🟦 Imbalance Support → 3225–3205
—
This isn’t a breakout. It’s a build-up inside premium.
The smartest move today might be no move — until structure speaks.
—
Are you watching for the rejection? Or the breakout trap?
Let us know your bias below 👇🏼
Tap that ❤️ if this gave clarity, and follow GoldFxMinds to stay ahead of every key level — no noise, just structure.
—
With sniper calm and strategic clarity,
GoldFxMinds 💙
Disclosure: Analysis based on Trade Nation TradingView chart feed.
