London Gold Early Trading StrategyGold prices saw a slight rise early in the session before retreating due to a brief easing of safe-haven demand. Gold prices have resumed a broad range-bound pattern, with recent price action showing both up and down swings but lacking strong follow-through support. For now, it's best to avoid chasing the rally. As gold prices retreat to support, we recommend initiating a new position. The current price is 3,374 – enter now!
On the hourly chart, gold prices remain in a broad consolidation range. Key support at 3,365 (the previous low) remains holding, and the short-term trend remains tilted to the upside. After a sharp drop to 3,367 this morning, the rebound was strong, confirming solid support near 3,365. Therefore, we continue to buy on dips.
Markets move fast—keep an eye on resistance at 3,410. The big question is whether this consolidation is forming a top or just building momentum for another push higher. If gold keeps failing at 3,410, bears might finally step in. Either way, patience is key—don’t rush into trades just because it’s moving up or down.
Community ideas

XAU/USD – Bearish Momentum Building: Circle 2 Top In?OANDA:XAUUSD
We have now completed a 1-2-3-4-5 move to the downside (in white), followed by a counter-correction in the form of an A-B-C.
This may have already completed our yellow (Circle) Wave 2 🟡 — though it’s not confirmed just yet.
We still have two potential resistance levels at 3400 and 3418 that could serve as final topping points for Circle 2.
Today, we can also observe a break of structure with the white trendline being broken, adding further confirmation to the bearish outlook 🔻.
I am now tracking my 1-2-3-4-5 structure in yellow, which should unfold into Circle Wave 3 🟡.
Bias remains bearish, and I expect this move to develop in line with the yellow projection already shown on my chart.
If price breaks decisively above our Fibonacci resistance, the alternative scenario would be an ABCDE triangle formation that has potentially been forming over the past months — in that case, I’ll post a dedicated update 📌.
For now, I’m actively looking for sell setups and have already entered short positions ✅.

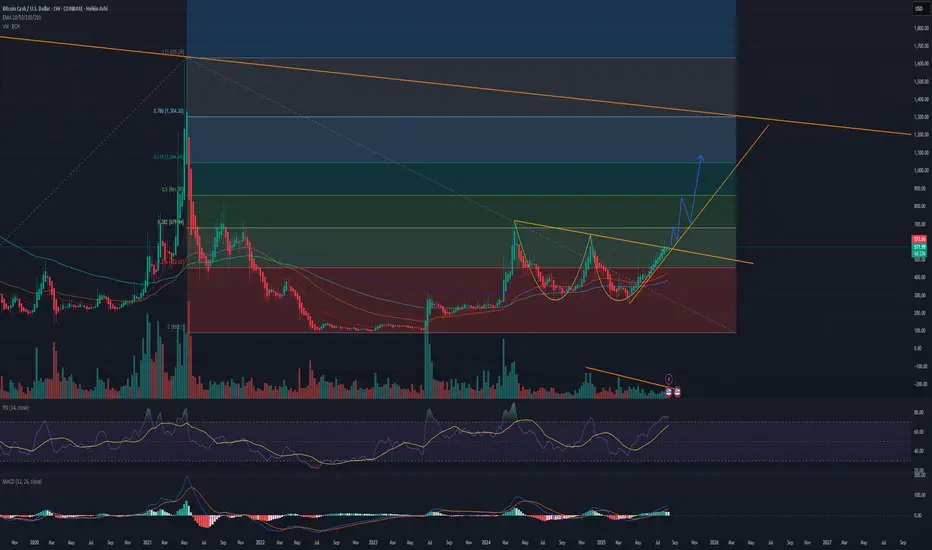
Bitcoin Cash Makes Bullish "W" PatternThere is a clear W formation on the chart with a double-bottom which is very bullish.
It's easy to predict a coming bull run in phase 3 of the Bitcoin bull cycle, but the main goal of this post is to identify the potential price targets to secure profits at.
I'll be using the fib levels selling:
-30% at $670
-30% at $845
-30% at $1020
-Final 10% at $1300
Look for a break of trend in the Volume for confirmation if you want to wait and be safe.
Happy trading!
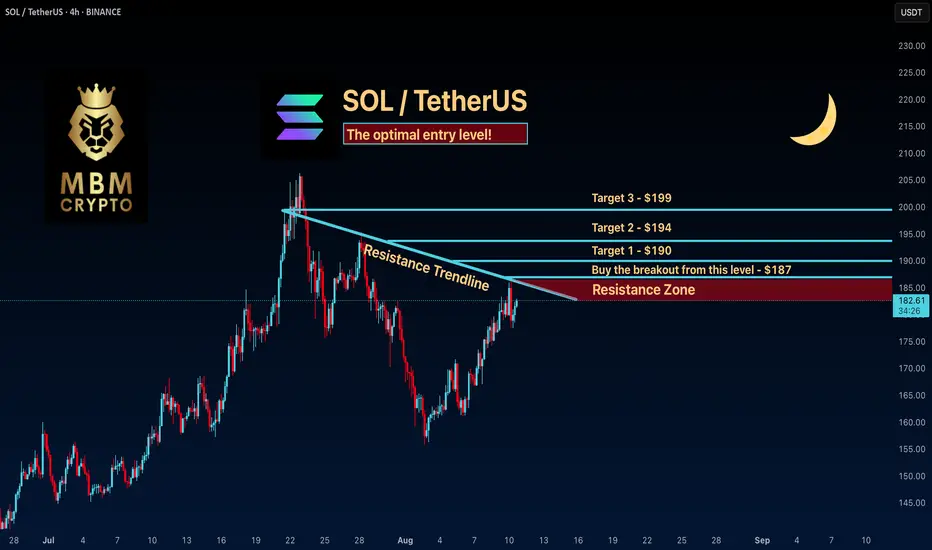
SOL: The optimal entry level!Trading Setup
If you’re considering trading SOL, here’s a quick setup that may help you.
The idea is: Buy when the price breaks above $187 and take profits at the levels shown in the chart.
Targets:
1. $190
2. $194
3. $199
-------------------------------------------
About our trades:
Our success rate is notably high, with 10 out of 11 posted trade setups achieving at least their first target upon a breakout price breach (The most on TW!). Our TradingView page serves as a testament to this claim, and we invite you to verify it!
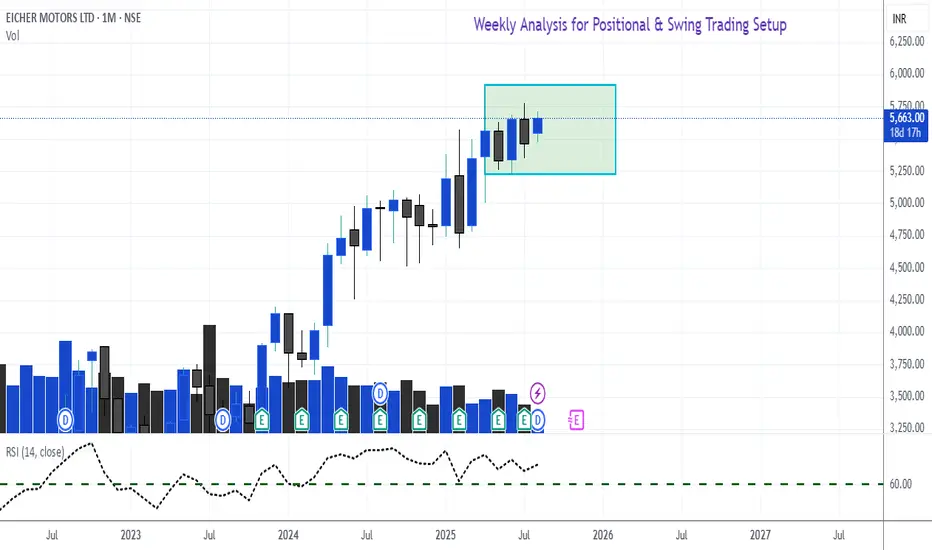
Weekly & Monthly Analysis - Swing & Positional Trade SetupsAs per our setup shared, I am hereby forwarding you all the scripts which fits to our criteria.
Those who are new please check previous post for better understanding.
These setups are for Swing Trading, Positional Trading and Stock Options buying.
Stocks which came out from Analysis are -
Eicher Motors - Monthly range - RSI above 60 - wait to break that range for new entry
Heromoto - Monthly RSI at 58. About to cross 60. buying above high 4712.
TVS Motor - Monthly RSI at 63 - Buying range above 3031.
Lupin -Monthly RSI at 57 - Buying above 2163 high
Dixon - Monthly RSI at 63 - Buying above 17150 in stock options
Titan - Monthly RSI at 54 - Buying above range 3853
Ultracemc - Monthly RSI at 63 - Buying above 12728 in stock options
Polycab - Monthly RSI at 60- Buying in Stock options above 7623
Cummins - Monthly RSI at 67 - Wait for a pull back in the next coming month as it is near ATH.
Kindly analyse all these scripts given above. Take your wise decisions. All the best.
Faraaz T
Sr. Research Analyst - Equity & Derivatives
Stockholm Securities UK
B3/USDT +100%accumulation is underway as big whales position themselves ahead of a potential major move. Price action is showing early reversal signs, with volume steadily picking up to confirm growing interest. Current structure supports a bullish breakout scenario, with upside potential targeting +100% from the current market price as momentum accelerates.

Bearish Flag in PayPal?PayPal has limped as the broader market flirts with new highs, and some traders may see downside risk.
The first pattern on today’s chart is the drop on July 29 after the company reported quarterly results. While some of the numbers beat, investors focused on lower profitability. Are fundamentals deteriorating?
Second, prices continued lower the next three sessions. They inched slightly higher before stalling again, creating a potential bearish flag.
The drop occurred at the 8-day exponential moving average (EMA), which is also below the 21-day EMA. MACD is falling as well. Those patterns may be consistent with a short-term downtrend.
Finally, the 50-day simple moving average (SMA) had a “death cross” below the 200-day SMA in April and has stayed there since. That may suggest a longer-term downtrend has begun.
TradeStation has, for decades, advanced the trading industry, providing access to stocks, options and futures. If you're born to trade, we could be for you. See our Overview for more.
Past performance, whether actual or indicated by historical tests of strategies, is no guarantee of future performance or success. There is a possibility that you may sustain a loss equal to or greater than your entire investment regardless of which asset class you trade (equities, options or futures); therefore, you should not invest or risk money that you cannot afford to lose. Online trading is not suitable for all investors. View the document titled Characteristics and Risks of Standardized Options at www.TradeStation.com . Before trading any asset class, customers must read the relevant risk disclosure statements on www.TradeStation.com . System access and trade placement and execution may be delayed or fail due to market volatility and volume, quote delays, system and software errors, Internet traffic, outages and other factors.
Securities and futures trading is offered to self-directed customers by TradeStation Securities, Inc., a broker-dealer registered with the Securities and Exchange Commission and a futures commission merchant licensed with the Commodity Futures Trading Commission). TradeStation Securities is a member of the Financial Industry Regulatory Authority, the National Futures Association, and a number of exchanges.
TradeStation Securities, Inc. and TradeStation Technologies, Inc. are each wholly owned subsidiaries of TradeStation Group, Inc., both operating, and providing products and services, under the TradeStation brand and trademark. When applying for, or purchasing, accounts, subscriptions, products and services, it is important that you know which company you will be dealing with. Visit www.TradeStation.com for further important information explaining what this means.

EUR/USD Analysis:The price is moving sideways between the $1.162 support area and the $1.168 resistance area.
A break and close above $1.168 could push the price toward testing $1.177.
A break below the $1.161 support and close under it may lead to a retest of $1.157, followed by $1.153, which is a potential reversal zone.
⚠️ Disclaimer:
This analysis is not financial advice. It is recommended to monitor the markets and carefully analyze the data before making any investment decisions.

DeGRAM | EURJPY exited from the channel📊 Technical Analysis
● EURJPY broke above the descending channel’s resistance line near 171.38, holding within an ascending wedge that favors bullish continuation.
● A sustained move above 172.17 opens the way toward 173.06, with intraday pullbacks likely retesting the breakout area for support.
💡 Fundamental Analysis
● The euro gained as ECB officials signaled no immediate rate cuts, while the yen remains pressured by Bank of Japan’s commitment to ultra-loose policy despite rising inflation expectations.
✨ Summary
Buy above 171.38; target 173.06. Setup remains valid while price stays above 171.00.
-------------------
Share your opinion in the comments, and support the idea with a like. Thanks for your support!

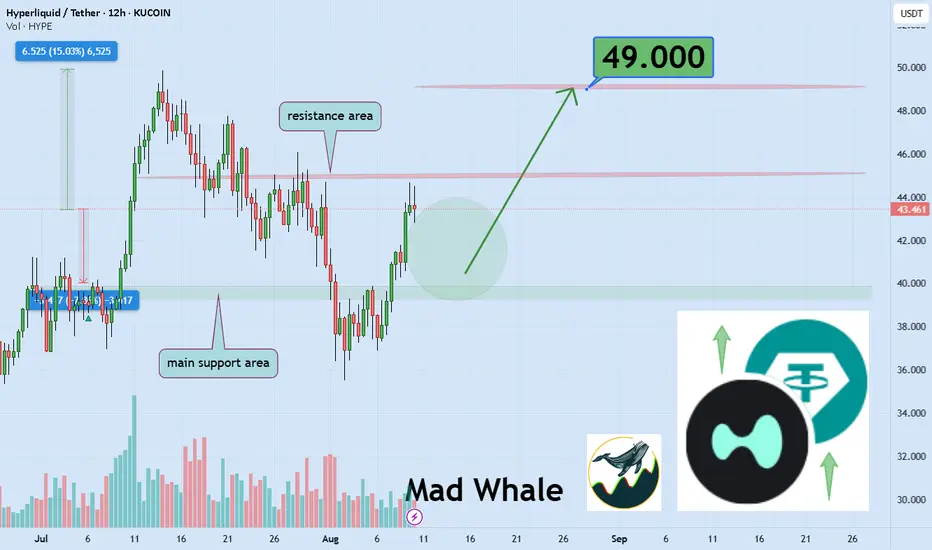
HyperLiquid Poised for 15% Gain, Targeting $49 Resistance LevelHello✌️
Let’s analyze HyperLiquid’s price action both technically and fundamentally 📈.
🔍Fundamental analysis:
More developer tools on HyperEVM could boost HYPE’s usefulness. It already handles 60% of DEX perpetual volume (Defiant), and stronger connections might keep supporting its recent 73% price rise.📈
📊Technical analysis:
KUCOIN:HYPEUSDT is showing strong volume and trading near a solid daily support. Expecting a 15% upside with a target around $49 🚀📈
✨We put love into every post!
Your support inspires us 💛 Drop a comment we’d love to hear from you! Thanks, Mad Whale
Gold Technical & Fundamental Update | August 11–15, 2025XAUUSD closed last week near $3,400 after breaking above the resistance of the descending channel. Price action has been choppy, hinting at cautious buying ahead of major U.S. events this week, CPI, PPI, Retail Sales, and Fed commentary.
Key levels:
✅$3,380: Above = bullish bias continues; Below = look for selling setups
✅Support: Former channel resistance now acting as a retest zone
✅Trend guide: Ascending trendlines from the early August recovery
Watch how gold reacts to $3,380 early in the week. This will set the tone for either continuation toward recent highs or a deeper pullback.
#gold #xauusd #forex #technicalanalysis #marketupdate #tradingvie
I’ll update my thoughts in the comments as price action unfolds.
Disclaimer:
Based on experience and what I see on the charts, this is my take. It’s not financial advice—always do your research and consult a licensed advisor before trading.

ETHUSDT analysis - 1H FVG and OB SetupsETH has recently rejected from the 4,370 area, showing signs of short-term exhaustion.
On the 1H chart, a clear FVG is located around 4,100, which could act as a liquidity target if selling pressure continues.
Below that, we have a strong Bullish OB around 3,900, aligning with previous demand and potential reversal interest.
If price retraces into the FVG zone (4,100) and shows bullish reaction in lower timeframes, short-term buys could be considered targeting 4,300 – 4,370.
A deeper move into the OB at 3,900 would be a high-probability long setup for swing traders, with upside potential toward 4,500.
For now, structure remains bullish on higher timeframes, but short-term correction is possible before continuation.
📊 ProfitaminFX | Gold, BTC & EUR/USD & Crypto
📚 Daily setups & educational trades

SMART MONEY CONCEPT (SMC)📉 Bearish Analysis XAU/USD (15M)
In this analysis, we apply Smart Money Concepts to identify a potential bearish continuation.
1️⃣ Market Context
• Price began with a bullish phase that ended in the resistance zone, leaving clear ChoCh and BOS structures.
• A fake out broke the trendline, signaling manipulation before a directional shift.
2️⃣ Consolidation Phase
• The market entered a 15M consolidation, creating liquidity traps on both sides.
• A rejection formed at the top, confirming the intention to keep price within the range.
3️⃣ Break and Manipulation
• The support break combined with a fake out suggests buyers were trapped before the real drop.
• Price is now pulling back into the rejection zone, where we look for the optimal short entry.
4️⃣ Bearish Projection
• From the rejection zone, we expect price to resume its bearish momentum toward the distribution zone, aligned with the current market structure.
🎯 Trade Plan:
• Entry: At the rejection zone after the pullback.
• Stop Loss: Above the last relevant high.
• Take Profit: Extended to the marked distribution zone.

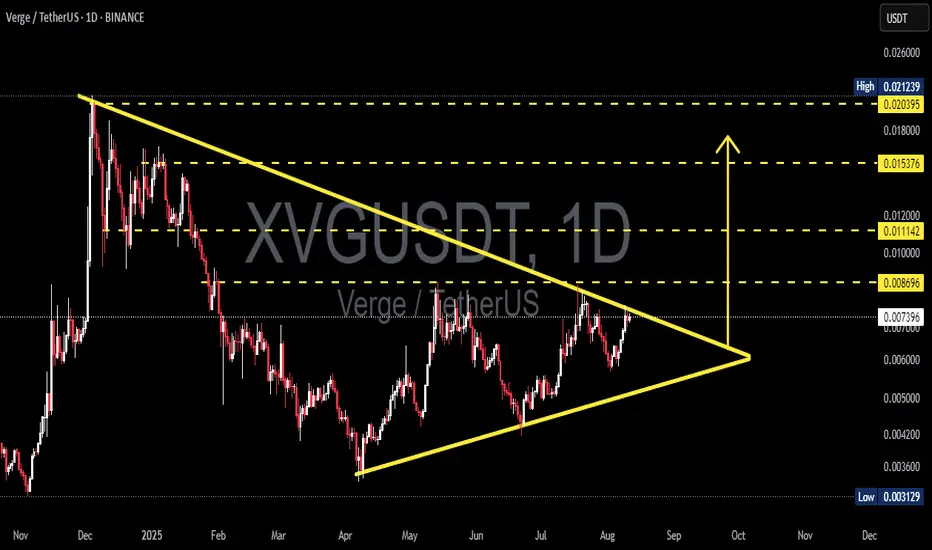
XVG/USDT — Symmetrical Triangle at Apex: Breakout?Pattern & Overview
The XVG/USDT daily chart is forming a symmetrical triangle — descending resistance from the Dec 2024 high and ascending support from the April 2025 low. Price is now around 0.00743 USDT, nearing the apex, indicating reduced volatility and an increased chance of a sharp breakout soon.
Pattern characteristics:
Higher lows (rising support line) suggest accumulation.
Lower highs (descending resistance) indicate continued supply overhead.
Volume usually contracts within the pattern; a valid breakout is often confirmed by a volume spike.
---
Key Levels (marked on chart)
Resistances / potential upside targets: 0.008696 (immediate), 0.011142, 0.015376, 0.020395, up to ~0.02124 (high).
Critical supports / breakdown levels: ascending trendline (~0.005–0.0055 zone) and historical low at 0.00313.
---
Bullish Scenario (confirmation & targets)
Confirmation: daily close above the descending resistance + increased buy volume. Ideally, wait for a daily close above 0.0080–0.0087 (breakout zone) before adding positions.
Measured targets (from current ~0.007428):
Target 1: 0.008696 → +≈17.1%
Target 2: 0.011142 → +≈50.0%
Target 3: 0.015376 → +≈107.0%
Example trade plan:
Conservative entry: after daily close > 0.0087.
Conservative stop: below breakout retest / under 0.0066 → stop ≈ -11.15%; R:R to Target 1 ≈ 1.5:1, to Target 2 ≈ 4.5:1.
Aggressive entry: buy now (~0.00743), stop below ascending trendline (~0.0055) → stop ≈ -25.96%; R:R to Target 1 ≈ 0.66:1 (higher risk).
---
Bearish Scenario (confirmation & targets)
Confirmation: daily close below the ascending trendline (~0.005–0.0055 zone) with increased sell volume. If confirmed, price could drop toward:
First support: 0.0050 → ≈-32.7% from current price.
Strong support: 0.0042 → ≈-43.5%.
Worst-case retest of historical low: 0.00313 → ≈-57.9%.
Short/Cut-loss strategy: wait for a confirmed close below support, then enter on a pullback/retest with stop above the retest level.
---
Risk Management
Symmetrical triangles can have false breakouts — always wait for confirmation (daily close + volume).
Limit risk per trade (e.g., 1–2% of capital). Adjust position size based on stop distance.
Take profits in stages: e.g., 30–50% at first resistance, another 30% at second resistance, trail the rest.
Keep an eye on news, listings, or on-chain events — crypto reacts strongly to short-term fundamentals.
> XVG is forming a contracting symmetrical triangle on the daily chart. Higher lows vs. lower highs — price is approaching the apex.
Bullish: daily close above 0.0080–0.0087 with volume → targets 0.0087 / 0.0111 / 0.0154 (+17% / +50% / +107% approx).
Bearish: daily close below rising support (~0.005–0.0055) → possible drop to 0.005 / 0.0042 / 0.00313 (-26% to -58% approx).
Wait for confirmation, manage your risk, and scale out profits. 📉📈
#XVG #Verge #XVGUSDT #Crypto #TechnicalAnalysis #Triangle #Breakout #Altcoins #RiskManagement
LTCUSDTI think the BINANCE:LTCUSDT price 📈 may pull back to $110.60 before pumping to higher levels 🚀.
Watch for reactions at $116.50 and $128.20 🔍 — key decision zones.
Supports: $116.50 – $110.60 – $104.60 🛡️
Resistance: $128.20 – $140 🏔️
Manage your risk ⚠️.

SHIB: Watch this level!Trading Setup
If you’re considering trading SHIB, here’s a quick setup that may help you.
The idea is: Buy when the price breaks above $0.0000142 and take profits at the levels shown in the chart.
Targets:
1. $0.0000153
2. $0.0000183
3. $0.000021
4. $0.0000235
-------------------------------------------
About our trades:
Our success rate is notably high, with 10 out of 11 posted trade setups achieving at least their first target upon a breakout price breach (The most on TW!). Our TradingView page serves as a testament to this claim, and we invite you to verify it!

Monday BluesIf you followed my trade idea on this stock, you would know I was short prior to earnings. The stock tanked 28% today, down almost 50% from recent highs. My short trade is now closed, we are being held up by the POC and golden ratio support zone.
I like the company as a long term hold, it might not grow at 30% going forward, and the market is readjusting to this. I think presents a good DCA opportunity for those who want exposure to a high growth software company, specialising in cloud based operating systems.
DCA slowly, don't be too cute trying to catch the bottom. If their growth falls below the mid 20% region next earnings, it'll be below $100 before you know it. But i'm confident in the growth prospects here, this could be a long term winner.
Not financial advice, do what's best for you

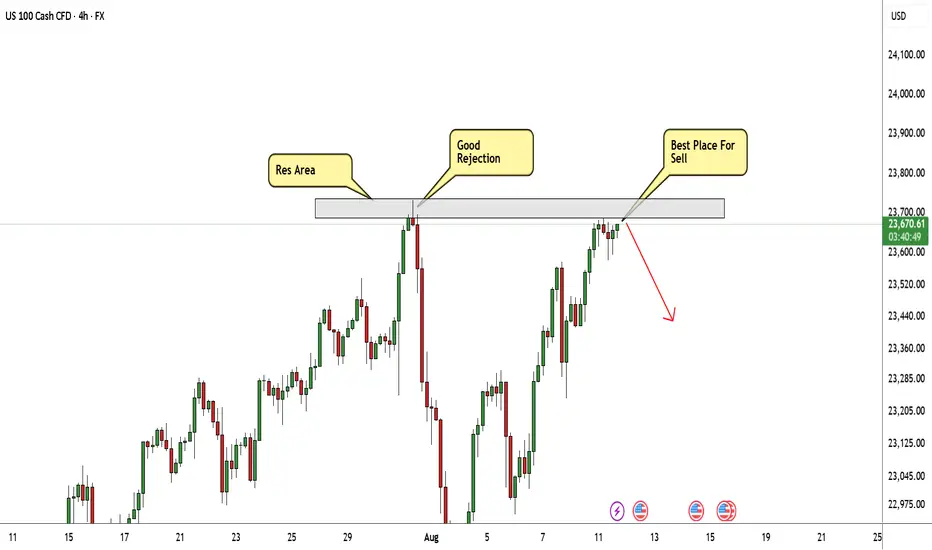
NASDAQ At Good Res , Is It A Chance To Sell To Get 200 Pips ?Here is my 4H Nasdaq Chart and my opinion is the price at very interesting selling area for me , and we have a very clear bearish price action and this Res Area forced the prices to go down Very hard and i think this Second Touch will be the best one , so i`m waiting selling this pair now and targeting from 100 to 200 pips . the only reason to cancel this idea if we have a clear daily closure above my res area .
Entry Reasons :
1- Clear Res Area .
2- Second Touch For The Res .
3- Bearish Price Action .
Huang cannot break through 3400, and the bearish trend begins
💡Message Strategy
The gold market has been volatile recently, with price fluctuations weighing on the nerves of global investors. Gold prices saw a significant decline on Monday (August 11th), with market attention focused on the US-Russia talks regarding the Ukraine conflict and the upcoming release of US Consumer Price Index (CPI) data.
These two major events not only have implications for the direction of geopolitical developments but may also provide important clues to the Federal Reserve's interest rate policy, thereby influencing the future trend of gold prices.
📊Technical aspects
Gold bulls rebounded under pressure, retreating to the 3400 level before ultimately breaking down. Gold bulls have lost their initiative, the rebound is weak, and the price continues to fall, breaking new lows. Gold has now reached scenario 2, which we discussed yesterday, at 3350, and is poised for further declines.
Gold's 1-hour high trading volume zone finally broke below, breaking the oscillation pattern. This means the high-level box has formed a short-term top structure, and the resistance at the high level has become very heavy.
At this point, it's no longer advisable to blindly chase gold prices; a bearish outlook on a pullback is the prevailing trend.
💰Strategy Package
Short Position:3360-3365,SL:3380,Target: 3330

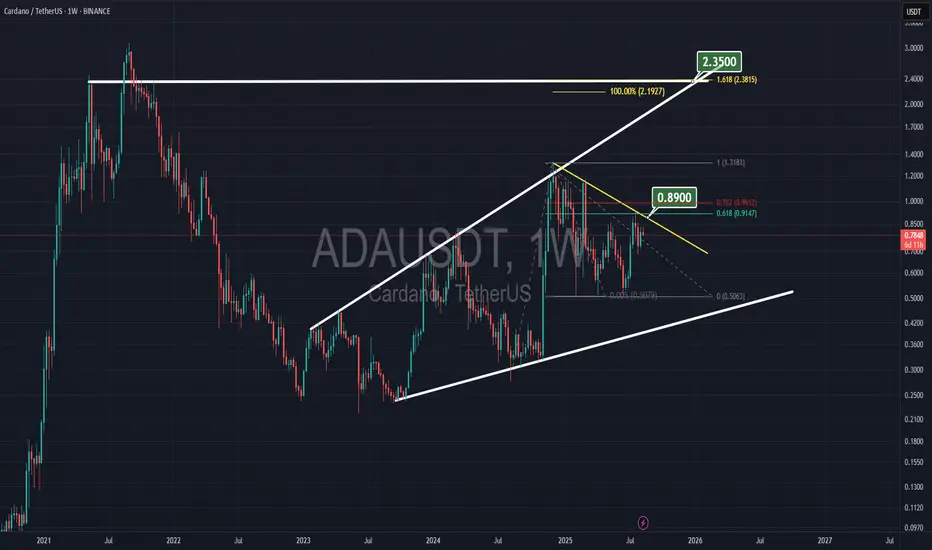
ADA to $2.40Cardano is within a broadening wedge, with a top of $2.35 in October 2025. The 100% Fibonacci level is at $2.20, and the all-time high is around $2.40, creating multiple resistances between $2.20 and $2.40.
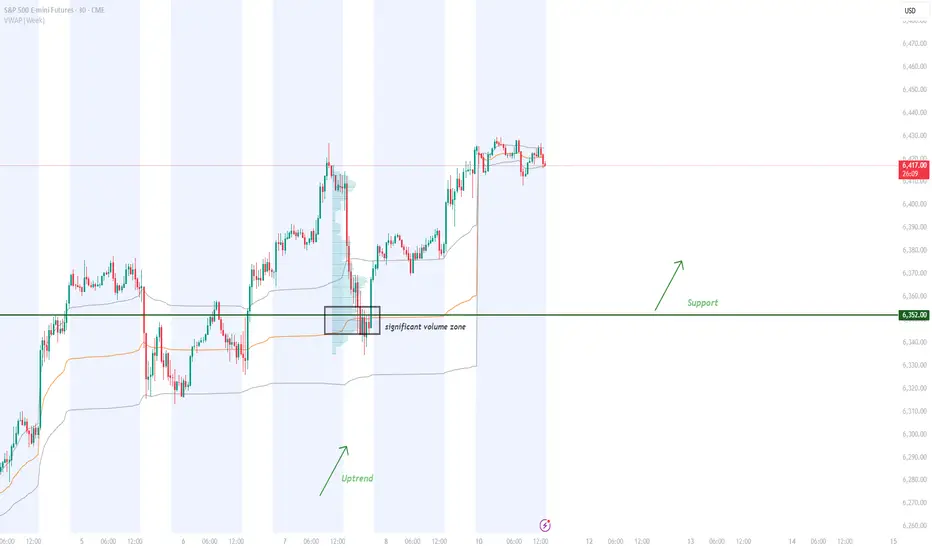
ES Rejection Setup: Volume Profile & Fair Value Gap StrategyOn ES, it’s nice to see a strong buying reaction at the price level of 6352.00.
There’s a significant volume cluster in this area, showing strong buyer accumulation. I believe buyers who entered here will defend their long positions. If the price returns to this level, strong buyers will likely push the market up again.
[SeoVereign] ETHEREUM Outlook – August 12, 2025I will present a short position perspective on Ethereum for August 12.
This idea is based on the premise that the direction is downward, derived from a strict counting of Bitcoin, and the specific entry point was set based on the Shark pattern.
Accordingly, the average take-profit target was set at around 4,126 USDT.
I plan to continue updating this idea as the movement unfolds.
Thank you.

$BB/USDT Breakout Could Fuel a 281% Rally.$BB/USDT has broken its long downtrend and is holding above the breakout.
If momentum continues, the price could target $0.48004, about 281% higher from here.
DYOR, NFA
