S&P 500 (CASH500) - Double Top H1Risk/reward = 2.7
Entry price = 6388.4
Stop loss price = 6399.7
Take profit level 1 (50%) = 6360.4
Take profit level 2 (50%) = 6352
Also, waiting on confirmation on some variables
Community ideas

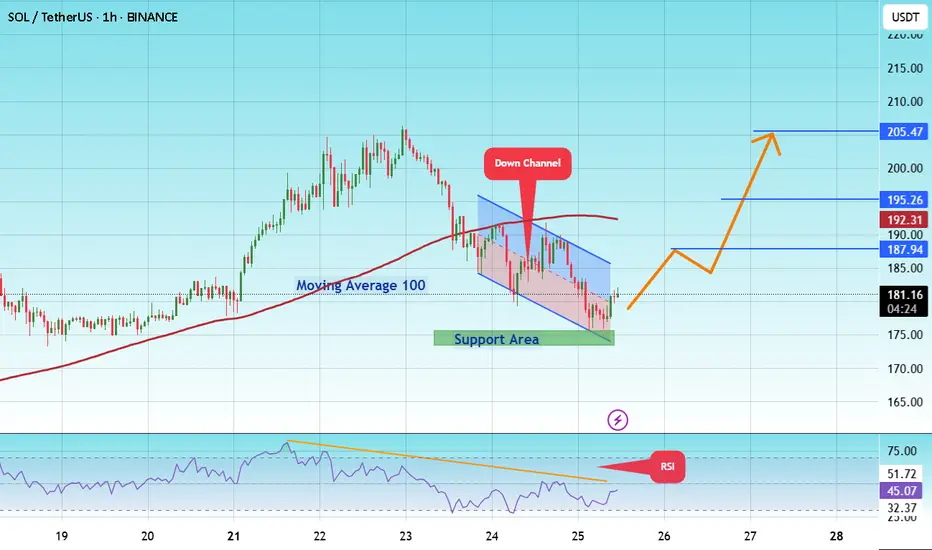
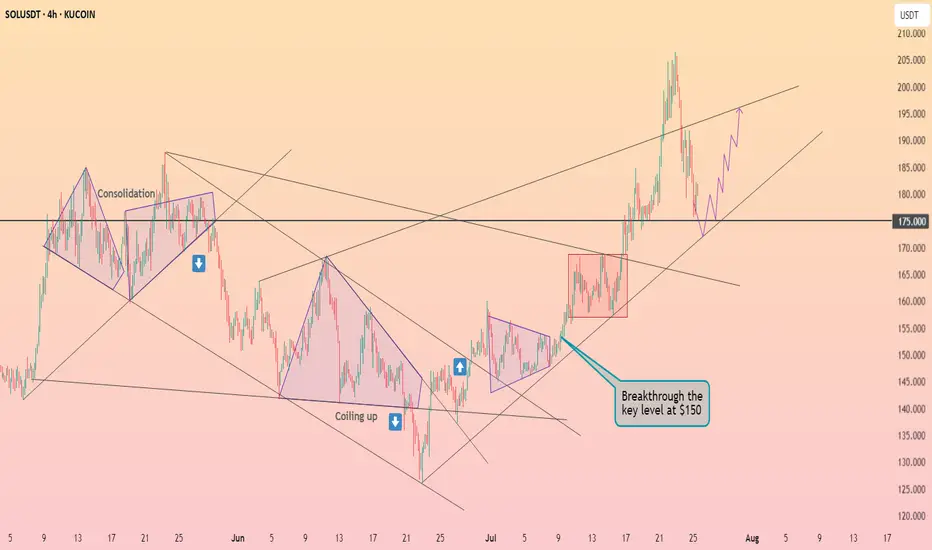
#SOL/USDT coin market structure analysis#SOL
The price is moving within a descending channel on the 1-hour frame and is expected to break and continue upward.
We have a trend to stabilize above the 100 moving average again.
We have a downtrend on the RSI indicator that supports the upward move with a breakout.
We have a support area at the lower boundary of the channel at 175, acting as strong support from which the price can rebound.
We have a major support area in green that pushed the price upward at 174.
Entry price: 181.
First target: 187.
Second target: 195.
Third target: 205.
To manage risk, don't forget stop loss and capital management.
When you reach the first target, save some profits and then change the stop order to an entry order.
For inquiries, please comment.
Thank you.
REI/USDT-God Candle REI has consistently defended the $0.015 zone for the past 40 days, signaling early signs of a potential reversal point in alignment with the broader market cycle. This base-building behavior suggests strong underlying demand, making it a high-potential setup. A breakout with a "god candle" could be the first major sign of trend reversal. The green box marks a prime entry zone, offering an excellent risk-reward opportunity for early positioning ahead of the next bullish leg.

Altseason 2025 – EthseasonWe’ve officially entered #ETH season. Some liquidity is flowing into alts, but CRYPTOCAP:ETH has now taken the lead from CRYPTOCAP:BTC as the big dog.
Old retail is here and slowly buying this dip... but the new retail is nowhere to be seen, yet! Still positioning for that full-blown altseason:
🥑 POLONIEX:GUACUSDT 🧱 MEXC:YBRUSDT ⛏️ MEXC:KLSUSDT
🌐 HTX:SYNTUSDT 🧪 MEXC:DEAIUSDT ✳️ MEXC:SAIUSDT
🔗 POLONIEX:LLUSDT 🎮 KUCOIN:MYRIAUSDT 🤖 COINEX:ENQAIUSDT
#crypto #altseason2025 #altseason #ethseason

AUD/USD Sell SetupOANDA:AUDUSD
Timeframe: m30
Entry: 0.66151
SL: 0.66266
TP1: 0.66033
TP2: 0.65914
TP4: 0.65681
📊 Setup Rationale
🔺 Channel Top Rejection (8H Overlay) Price has touched the upper boundary of a descending channel visible on the 8-hour chart. This zone has historically acted as a strong resistance, increasing the probability of a reversal.
🧱 Local Structure (30min) Entry aligns with a minor double top (in lower TFs) and bearish momentum. The tight SL allows for a high R:R profile.
🔄 Momentum Shift Watch for bearish engulfing or rejection wick on lower timeframes to confirm entry.
#MJTrading #Forex #AUDUSD #Sell
Psychology always matters:

RIVN Approaching Trend ShiftRIVN has NEVER held above the high time frame cloud....until now. Probably at least a 3-6 month idea, gotta give this time to play out after being down only since IPO. Green diag is current SL.

JOHNSON & JOHNSON Sell opportunity on a Double Resistance.It's been 9 months (October 11 2024, see chart below) since our last Johnson & Johnson (JNJ) analysis, where we gave a very timely sell signal that surgically hit our $141.00 Target:
The Channel Down has since broke to the upside and a new Higher Lows structure has emerged but with a clear Resistance Zone for the time being. At the same time, the price is also just below the Higher Highs trend-line that started on the September 04 2024 High.
With the 1D RSI overbought (same as on February 25 2025), we don't give the upside much room to go, so we turn bearish here, targeting the 0.382 Fibonacci extension and Higher Lows trend-line at $160.00.
-------------------------------------------------------------------------------
** Please LIKE 👍, FOLLOW ✅, SHARE 🙌 and COMMENT ✍ if you enjoy this idea! Also share your ideas and charts in the comments section below! This is best way to keep it relevant, support us, keep the content here free and allow the idea to reach as many people as possible. **
-------------------------------------------------------------------------------
💸💸💸💸💸💸
👇 👇 👇 👇 👇 👇

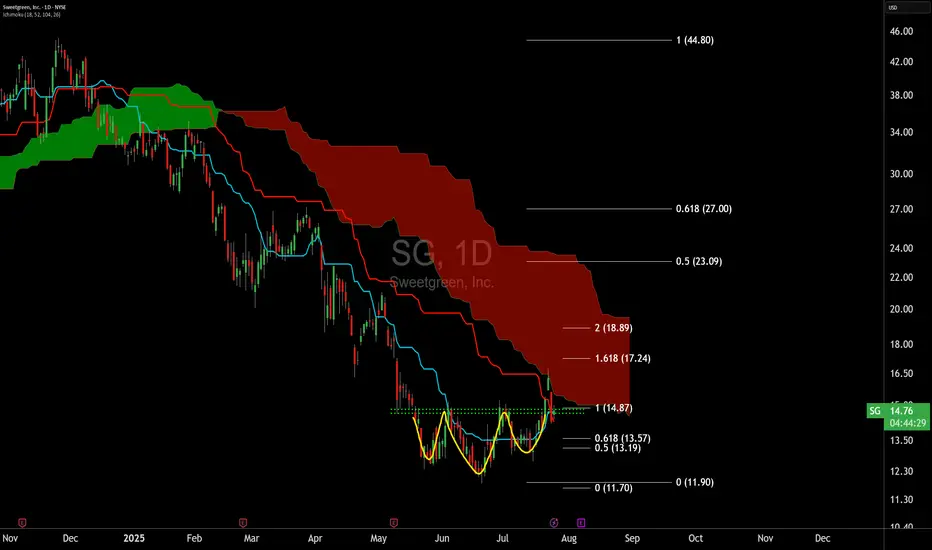
SG Approaching a Potential Trend ShiftPotential trend flip on the SweetGreen Chart for the first time since December 2024. I use a default doubled cloud on the daily timeframe 18/52/104/26. I find this to be superior to the default cloud on both backtesting and forward testing over the past decade on any chart.
Ideal bullish entry conditions occur on the cloud system when all four conditions are met:
Price above cloud
Bullish cloud
Bullish tenkan and kijun cross (TK)
Lagging span above price and above cloud (LS)
The doubled cloud settings are meant to decrease noise and increase signal, because of this I ignore the lagging span entirely and have never used the lagging span for entry criteria. We are approaching sufficient EARLY entry conditions was price enters the daily cloud.
Additionally, SG has one of the cleanest active inverted head and shoulders patterns in the market at the moment.
The target zone is merely based on the 50% retracement of high to low of the multi-month down trend, see: Dow Theory. Additional upside can be seen if the trend remains intact. Trailing stop losses via Williams Fractals and keeping an eye out for bearish divergences are both key to position management for this strategy.
Stop loss considerations for this idea is a combination of price below cloud and new lower lows., in this case below 13. Be mindful of a poor earnings result on Aug 7th could easily trip this SL level.
Google Buyers Entered Seller Territory.Hello, I am the Cafe Trader.
To finish off our series of the MAG 7 we have GOOGL up next.
If you have been keeping up, I will offer insight into Long term and short term interest. Google has taken out a key sellers on July 21st, and also closed inside the supply zone. This is very bullish, bulls have not got much pushback from the bears, suggesting this could test the highs again, and prime itself for a breakout.
Long term price guide helps you align a buy area with your conviction. I will update the price as of friday's close (today)
Long Term
Aggressive: $179 - If we close today above the bottom of supply line, then I would suggest this aggressive price adjust to 187.50
Fair Sentiment $166 - 173 - Between the big buyers and the strong demand. Also having the trend to support adds a 3rd strength.
Extreme Deal $140-148 - If you can catch a deal here, best to snatch it up. Alot of Big money wil be doing the same.
Short Term
weakness in the supply area is suggesting a run to the top. Trying ot get in here can be tricky. Since today is friday, the close is extremely important to see how our next week will be framed. So here I have 2 Bullish scenarios to help you find opportunity for GOOGL.
Green Scenario
Yes its possible it will run strait up into the top of supply, as a trader, you don't want to be that buyer just yet. I wouldn't personally feel great about trading the green line scenario without seeing a real buyer step into the market. So if we can Find a real buyer, we will play off of them and rirde to the top.
No entry or price targets on this one yet.
Red Scenario
This scenario has a real buyer, and personally I think is a safer trade to take (as of right now). With this squeeze that's happening, there is a good chance at some point there will be buyers getting exhausted and shorts getting a grip on this. This is why I would not buy "top of demand" but would look to get close as I could to the strong demand. and then a ride back to the "Top of Supply"
Entry: 175
Stop: 170
Partial Profit: (when the sellers step in, thats our first TP)
Target: 206
That's a wrap on our MAG 7 series, Happy Trading and we will see you next time.
Next week we are going to chart out Crypto, if you have any specific suggestions you want to see me chart, comment below.
@thecafetrader

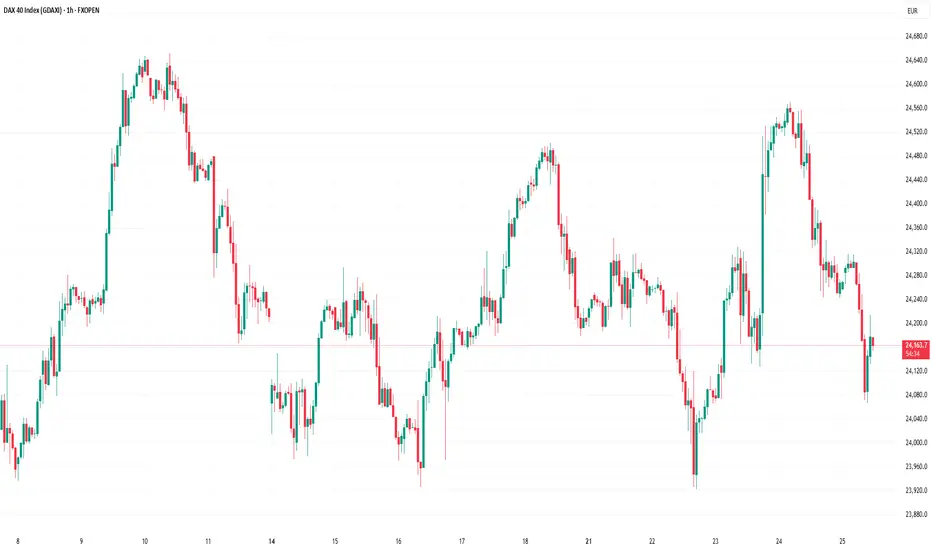
The DAX Index Is Losing Its Bullish MomentumThe DAX Index Is Losing Its Bullish Momentum
At the end of May, we noted that the German stock index DAX 40 was exhibiting significantly stronger performance compared to other global equity indices. However, we also highlighted the 24,100 level as a strong resistance zone.
Two months have passed, and the chart now suggests that bearish signals are intensifying.
From a technical analysis perspective, the DAX 40 formed an ascending channel in July (outlined in blue). However, each time the bulls attempted to push the price above the 24,460 level (which corresponds to the May high), they encountered resistance.
It is worth noting the nature of the bearish reversals (indicated by arrows) – the price declined sharply, often without intermediate recoveries, signalling strong selling pressure. It is likely that major market participants used the proximity to the all-time high to reduce their long positions.
From a fundamental standpoint, several factors are weighing on the DAX 40:
→ Ongoing uncertainty surrounding the US–EU trade agreement, which has yet to be finalised (with the deadline approaching next week);
→ Corporate news, including disappointing earnings reports from Puma, Volkswagen, and several other German companies.
Given the above, it is reasonable to assume that bearish activity could result in an attempt to break below the lower boundary of the ascending blue channel.
This article represents the opinion of the Companies operating under the FXOpen brand only. It is not to be construed as an offer, solicitation, or recommendation with respect to products and services provided by the Companies operating under the FXOpen brand, nor is it to be considered financial advice.
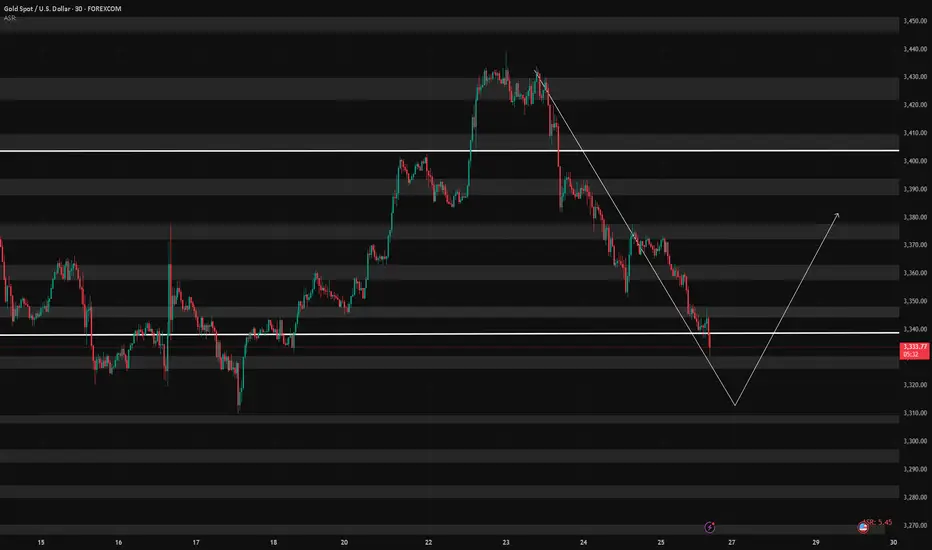
7/25: Key Levels to Watch Closely for Next Week's TradingGood evening, everyone!
Due to health reasons, I had to take a short break from updates — thank you all for your understanding and support.
This week, gold rallied to the 3440 level, forming a double-top pattern, and has since entered a phase of consolidation with a downward bias, currently retracing back to the key 3337-332 support area.
While a short-term rebound is possible from the 30-minute chart perspective, the weekly structure is not favorable to the bulls. On the daily chart, price has once again reached the MA60 support, and is currently forming three consecutive bearish candles, which suggests that bearish momentum may continue.
Unless there is significant bullish news next week, the market may remain under pressure. Key levels to monitor:
Upside resistance zones: 3343, 3352, 3358, 3366, 3372, 3378, and 3386–3392
Downside support zones: 3337, 3332, 3323, 3312
If the weekly chart breaks down, watch for: 3300 psychological level and 3260 (weekly MA20)
Additionally, during this week's decline, a price gap has been left between 3395–3398. If the market starts to rebound on the 2-hour chart, there is a chance this gap will be filled. However, this area also serves as strong resistance, and any approach toward it could result in heavy selling pressure. Caution is advised in the event of a sharp rally.
I'm still recovering and unable to monitor the markets for extended periods. Once my health improves, I’ll resume regular updates. In the meantime, feel free to leave any questions, and I’ll do my best to respond. Thanks again for your continued support, and I wish everyone success and strong profits in the market!
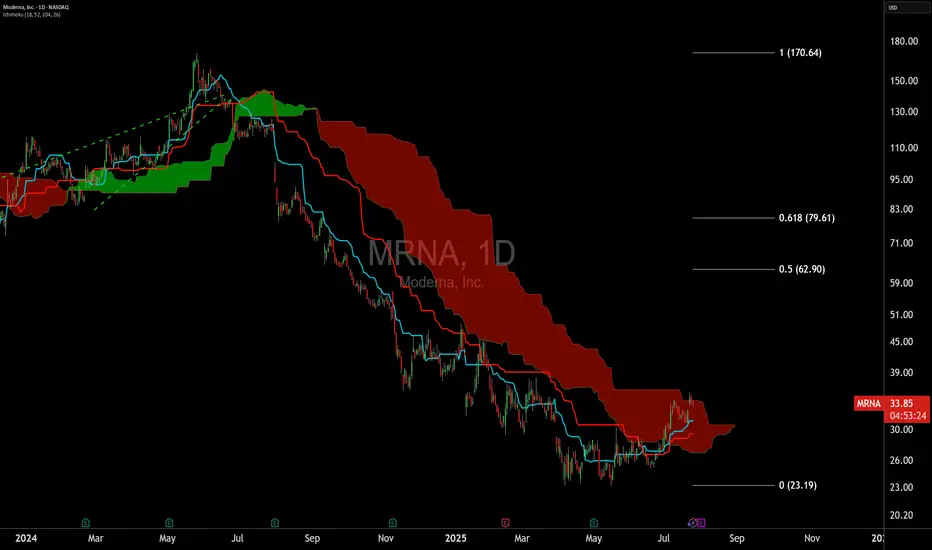
MRNA Approaching Trend Shift After Multi-Month DeclinePotential trend flip on the Moderna Chart for the first time since May 2024. I use a default doubled cloud on the daily timeframe 18/52/104/26. I find this to be superior to the default cloud on both backtesting and forward testing over the past decade on any chart.
Ideal bullish entry conditions occur on the cloud system when all four conditions are met:
Price above cloud
Bullish cloud
Bullish tenkan and kijun cross (TK)
Lagging span above price and above cloud (LS)
The doubled cloud settings are meant to decrease noise and increase signal, because of this I ignore the lagging span entirely and have never used the lagging span for entry criteria. We are approaching sufficient entry conditions with a bullish kumo breakout (price above cloud) and kumo twist (bullish cloud).
The target zone is merely based on the 50% retracement of high to low of the multi-month down trend, see: Dow Theory. Additional upside can be seen if the trend remains intact. Trailing stop losses via Williams Fractals and keeping an eye out for bearish divergences are both key to position management for this strategy.
Stop loss considerations for this idea is a combination of price below cloud and new lower lows. There is not a strongly defined level here at the moment but 31, 27 and 25 would all be considerations for reduction or closing of the position.
Interesting that this TA setup occurs in the setting of heavy anti-vaccine rhetoric from the current administration as well as severe weakness in the healthcare sector generally.
link buy midterm"🌟 Welcome to Golden Candle! 🌟
We're a team of 📈 passionate traders 📉 who love sharing our 🔍 technical analysis insights 🔎 with the TradingView community. 🌎
Our goal is to provide 💡 valuable perspectives 💡 on market trends and patterns, but 🚫 please note that our analyses are not intended as buy or sell recommendations. 🚫
Instead, they reflect our own 💭 personal attitudes and thoughts. 💭
Follow along and 📚 learn 📚 from our analyses! 📊💡"


Is this a perfect retest?If this is a perfect retest... expect to see 0,0004$ in a few months. My guess is that we are watching history now and Pepe will make severals new ATH soon.
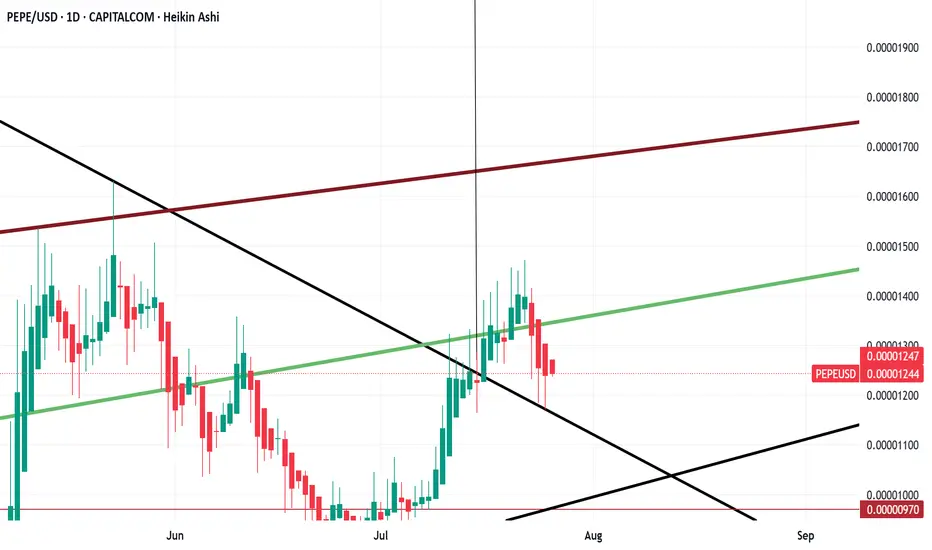
PEPE last season alive?🔥 The alt season is beginning on the market. Many alts are yielding tens and even hundreds of percent per day. But there are also those among them from whom we clearly expected more.
And I'm talking about old memes like Doge, PEPE, SHIB, and others.
Over the past month, PEPE has grown by only 60%. Is everything really that bad? Let me explain:
1️⃣ The latest growth impulse formed a divergence with the price in terms of volume. Throughout the growth over the last 4 months, purchase volumes continued to decline. This signals a waning interest in PEPE as the price rises.
2️⃣ Money Flow also shows a near-total lack of new liquidity. Fresh money is not flowing into the asset, and even now, in such an euphoric phase, PEPE's liquidity indicator is in the neutral zone.
3️⃣ PEPE has formed a local lower high and has already deviated from resistance at $0.00001439. It has already corrected by 6% today. This shows that there is currently no liquidity in the asset to drive the price higher.
4️⃣ GAP was formed at the levels of $0.00001241 - $0.00001027. And as we know, 99% of GAPs close sooner or later.
Nevertheless, we see high levels of interest at lower prices. When the fifth 0 appears. However, these zones can also change quickly in the event of a major correction of the entire market, and no other correction will bring the asset to such prices in the short term.
📌 Conclusion:
Right now, old memes really do look sad. Thousands of new memes are created every day that can give big returns, and people are asking themselves, “If I buy a meme with no value, why should I buy an old one?”
🔔 So, at current prices, PEPE is clearly of no interest to anyone. But, as is usually the case, once such coins fall below a certain price, whales will take positions and start pushing them up. Everyone will suddenly notice how undervalued this wonderful coin was.
So, for those who want to buy, I advise you to relax, you are not missing out on anything. And there will definitely be better prices for buying.
And stay in tune by subscribing, for more insightful ideas!

GOLD - SHORT TO $2,880 (UPDATE)Gold sellers have now pushed down to where price opened on Monday, turning the weekly candle bearish. A huge move down, compared to where price was at on Tuesday high!
R.I.P to those who bought the top. But this is what happens when you trade without a strategy or guidance⚰️

USD/JPY Robbery Route | Enter at Dip, Exit Before Police💥USD/JPY Forex Money Heist Plan 🎯 — Ninja Robbery at 146.000💥
🌟 Hi! Hola! Ola! Bonjour! Hallo! Marhaba! 🌟
Dear Market Bandits, Money Makers & Risky Robbers 🤑💰💸✈️
Welcome to another Thief Trader-style operation. We've cracked open the USD/JPY vault (aka "The Gopher" 💹), and here's the blueprint to pull off this forex heist like true professionals. 💼🎭💵
🚨 Strategy Overview
This isn't just a trade – it’s a well-researched, precision-timed robbery mission based on technicals, macro analysis, sentiment, and the bigger global picture.
Expect action near critical zones – especially the moving average barricade, where police (aka risk) is waiting. Stay sharp.
🔓 Entry Point – Unlock the Vault
📈 Watch for bullish pullbacks near 146.000.
Whether it's a dip, zone test, or wick bounce — you’re looking to layer buy limit orders like a seasoned thief using DCA tactics.
Enter on swings or any bullish confirmation.
Heist Window is Open.
🛑 Stop Loss – Escape Route
📍 SL near 143.000 (1D swing low) — adjust based on your capital and position size.
💡 Don’t go blind — SL is your backup plan, not an optional accessory.
Custom-fit it based on how many entries you’re stacking.
🎯 Target – Vault Exit Point
🏁 151.000 or exit before resistance heat catches on.
No greedy thieves here — precision exit is key.
Lock profits, vanish in style. 🕶️💼💸
🧲 Scalpers Take Note
Only long side raids are valid. Scalping against the trend? That's walking into a trap.
Use trailing SLs and protect your loot.
Small bag or big vault — play your game smart. 🎯💰
📢 Fundamental Boosters
USD/JPY’s bullish run isn’t random — it’s backed by:
📊 Macro shifts,
📈 COT reports,
🧠 Sentiment drivers,
📉 Intermarket trends,
And a whole mix of thief-level intel 🔍
🧭 Dive deeper before acting. The map’s been provided. 🔗🌍
🗞 News Traps Ahead – Move Cautiously
🚫 Avoid new trades during major releases
🔁 Use trailing SLs on open positions
💡 Position management is a thief’s best defense. Risk management keeps you in the game. 🎯🧠
🔥💖 Support the Heist Crew
Smash that ❤️🔥 Boost Button to keep our robbery engine running.
Each boost = strength for our crew.
💬 Share the love, spread the intel, and trade like a rogue with brains. 🤝💵
👀 Stay tuned for more high-profile FX heists from Thief Trader.
Until next time — loot wisely, vanish clean. 🐱👤💨

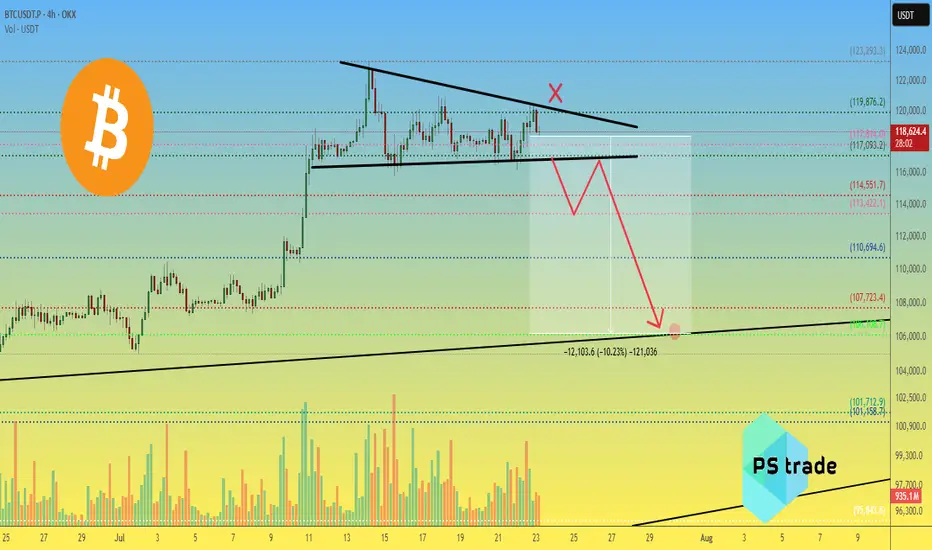
BTCusdt — Descending Triangle. Preparing for a BTC Breakdown?OKX:BTCUSDT chart (4H) shows a well-defined descending triangle.
Price is being compressed under a descending trendline, and volume is steadily declining — a typical signal of an upcoming strong move.
📉 Downside target: $106,100 – $101,700
🔺 Invalidation: breakout above $119,876
📊 Key levels:
Resistance: $117000 / $113,500
Support: $110,694 / $107,723 / $106,108 / $101,712
⚠️ Pay attention — breakout is likely soon.
_____________________
Did you like our analysis? Leave a comment, like, and follow to get more
Solana is bouncing back from $175 ┆ HolderStatOKX:SOLUSDT is testing the $180 barrier. Breakout could extend gains to $186. If rejected, $172–$173 may act as reentry zone. Market structure favors continuation.
Inverse head & shoulderPossibility by today or early hours GMT, this inverse head & shoulder can play play out, hitting the $4k mark.
Also a possibility is a correction after hitting potentially what is ATH, at which point a correction will come before ETH moves above the ATH towards the end of year bull run, 25/26.

GBPUSD LONGTERM BUYWe have H4 BUY range
Followed by SELL range (retracement)
SELL range turn to BUY range.
I expect to buy around 1.3410 (After confirmation = PRICE REJECTION)
TP: 1.3787 (Between there I will have small BUY AND CLOSE trade)
