CELH Eyes Upside Momentum as Consolidation TightensCelsius Holdings, Inc. ( NASDAQ:CELH ) has shown a notable recovery from its early 2025 lows, steadily climbing and recently consolidating around the $46 level. The stock is currently trading above both the short-term (red) and mid-term (blue) moving averages, which are sloping upward—indicating bullish momentum.
The recent price action reveals a tight consolidation just below the previous local highs around $47–$48. If CELH can decisively break above this resistance zone with increased volume, it may trigger a short-term breakout and open room toward the $52–$55 range, even $60.
Conversely, if the stock fails to break above resistance and falls below the $43–$44 support area (near the moving averages), it could trigger a short pullback toward the $40 level.
Key Levels to Watch:
Resistance: $47.50–$48.00
Support: $43.00–$44.00
Breakout Target: $52.00–$55.00 / extended $60
Momentum remains positive, but confirmation through volume and follow-through price action is essential for any breakout to sustain.
Community ideas

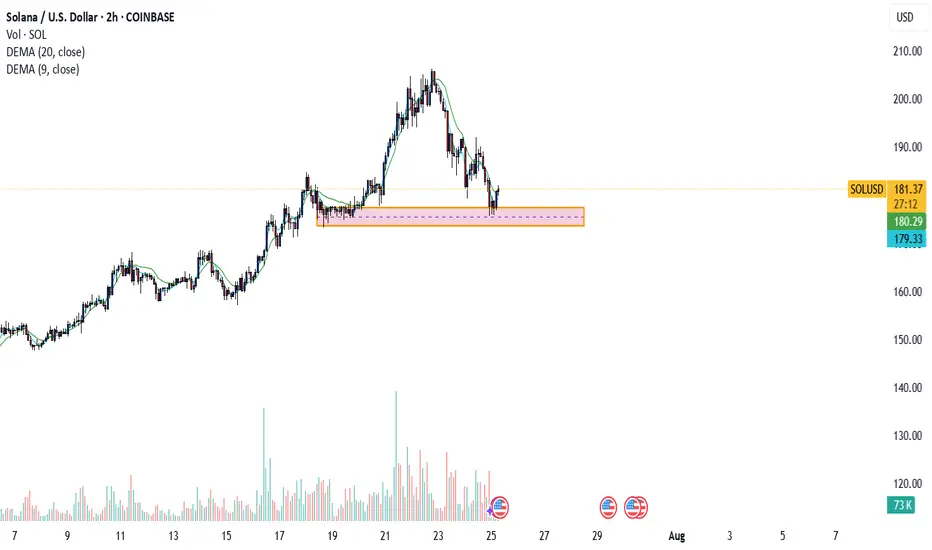
SOL TO THE MOONthe solana has urged a retracement , going back to its key zone, the next bullrun will explode the price of solana, make sure you have enough sol in your wallet
XAUUSD Our old trade is holding in profits from top. but this one is reetry and played well but news can change thing dramatically
Manage risk at first
Sell short plan 15 minutes time frame

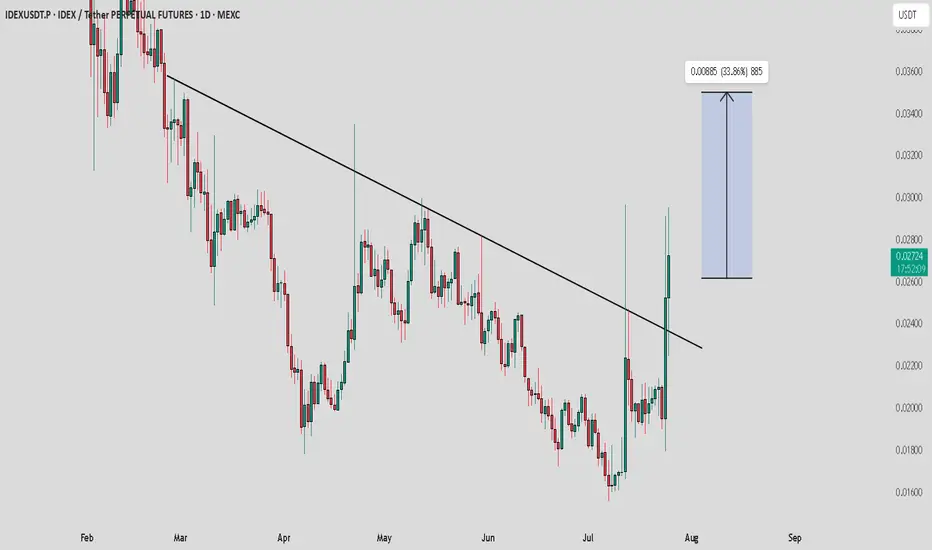
IDEX / USDT : looking bullish in choppy market situationThe overall market is not looking very strong right now, but IDEX is showing bullish potential. It's moving with strong volume and confirming its breakout with consistent bullish moves.
Key Points:
IDEX seems to be breaking out with solid momentum.
Watch for confirmation of continued bullish movement to ensure it’s not a fakeout.
Note:
Manage your risk carefully. Only invest money you can afford to lose. Always Do Your Own Research (DYOR) before making any decisions. Stay cautious and ensure you're prepared for any market fluctuations.

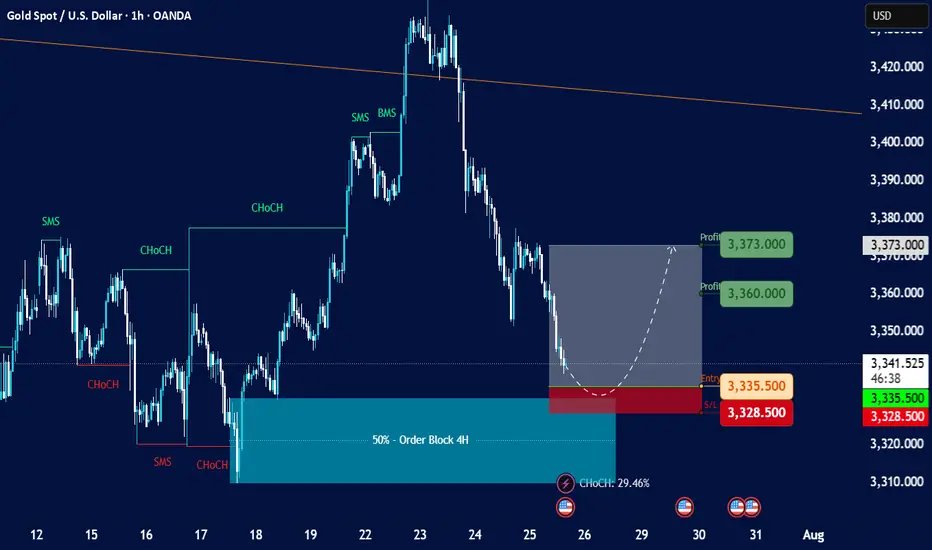
Gold Spot / U.S. Dollar (XAU/USD) with a 1-hour timeframeOverall Trend and Market Structure:
The chart displays a mix of bullish and bearish movements, but recent price action (from around July 23rd onwards) shows a significant downturn after a peak.
There are "SMS" (Structural Market Shift) and "ChoCH" (Change of Character) labels, indicating shifts in market structure. Initially, there were bullish shifts, but the recent price action suggests a potential bearish shift or at least a significant retracement.
A large "50% - Order Block 4H" is highlighted in blue, which acted as support and led to a strong upward move previously.
Current Price Action and Setup:
The current price is around 3,340.670.
There's a proposed short-term trading setup, indicated by:
Entry: 3,335.500 (red dashed line)
Stop Loss (SL): 3,328.500 (red shaded area)
Profit Targets (TP):
3,360.000 (green shaded area, "Profit 3,360.000")
3,373.000 (green shaded area, "Profit 3,373.000")
The setup is highlighted with a gray shaded area, indicating the potential path of price for this trade. It appears to be a long (buy) setup, anticipating a bounce from the current levels.
The "CHOCM: 29.46%" at the bottom suggests some kind of indicator or calculation related to market character.
Key Observations and Considerations:
Previous Bullish Momentum: The price rallied strongly after touching the "50% - Order Block 4H" around July 17-18, reaching a high near 3,430.
Recent Bearish Retracement: Since July 23rd, the price has pulled back significantly from its peak, almost revisiting the higher levels of the previous order block.
Potential Support: The proposed entry point for the long trade (3,335.500) is within a zone that previously acted as support or a level from which price bounced. It's also near the top of the "50% - Order Block 4H" area, suggesting this could be a retest or a bounce from a key support zone.
Risk-Reward: The setup shows a relatively tight stop loss compared to the potential profit targets, which is generally favorable for risk management.

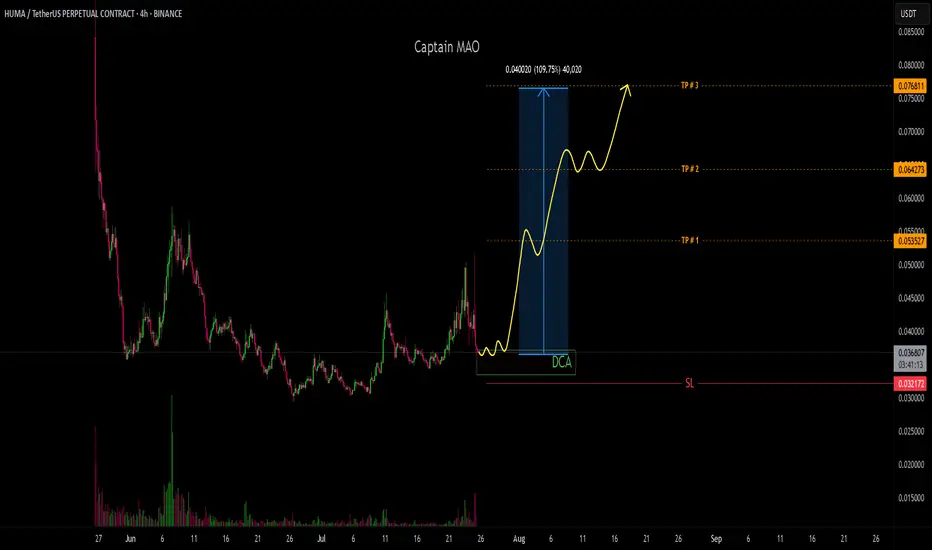
HUMA/USDT +100%The $0.03 zone has acted as a key reversal point for HUMA/USDT, marking the bottom of a significant trend shift. Since then, the price has been printing higher highs (HH) and higher lows (HL) a clear indication of a strong bullish structure in development.
After reaching a local top at $0.05 price is now undergoing a healthy correction, offering a potential buy opportunity within the green box zone. This pullback could act as a springboard for the next impulsive leg toward the $0.07–$0.077 target zone.
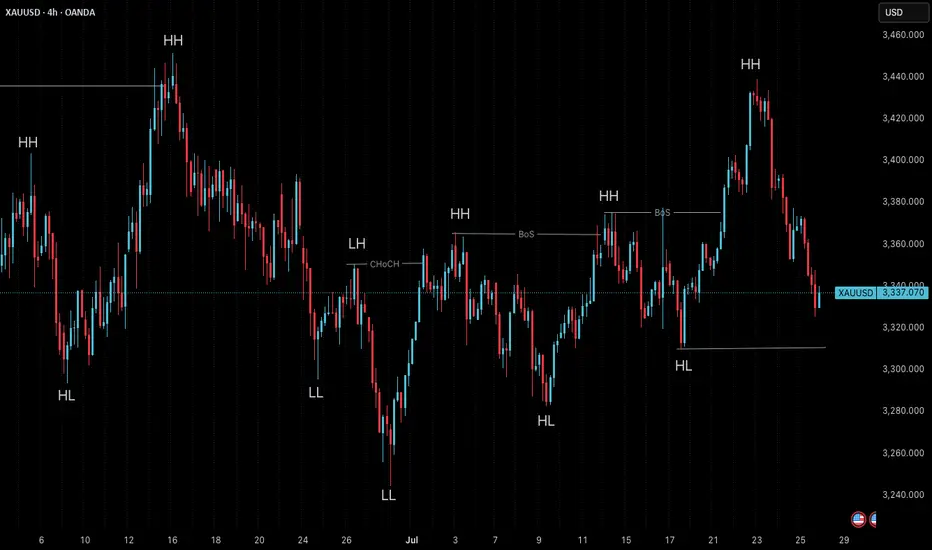
Market Structure is Not Strategy — It’s Your Starting Point“The chart doesn’t hide anything. But your mind does.”
Before any indicator, setup, or signal… comes structure.
🔍 What is Market Structure?
At its core, market structure is the sequence of higher highs (HH) and higher lows (HL) in an uptrend, or lower lows (LL) and lower highs (LH) in a downtrend.
It is the skeleton of price .
Everything else — entries, zones, signals — is just clothing.
If you can’t see the skeleton, you’re reacting to noise.
🎯 Why It Matters:
It’s not a signal. It’s context .
It tells you whether you’re trading with the market or against it .
It defines where your patience begins — not where your entry is.
Market structure helps you let go of the urge to chase. It brings order to the chaos.
🧩 Key Components to Track:
Break of Structure (BoS): Confirms trend continuation
Change of Character (ChoCH): Signals a potential reversal
Swing Points: Define the intent behind price moves
Liquidity Sweeps: Often mask real structure beneath short-term traps
🛑 Common Mistake:
Most traders jump straight to the setup without asking the most important question:
“Where am I in the structure?”
They try to buy a pullback — in a downtrend.
They try to fade a move — right before continuation.
They chase candles — instead of waiting for alignment.
That’s not strategy. That’s stress.
🛠 Tip to Practice:
Use this simple framework to build clarity:
Start from the H4 chart — this gives you the broader directional bias
Drop to M15 — here’s where structure begins to form tradeable setups
Finally zoom into M1 — this is where confirmation happens before entry
Ask yourself:
Where did the last BoS or ChoCH happen on each timeframe?
Is M15 aligning with H4 intent — or contradicting it?
Did you enter after M1 confirmation , or based on impulse?
You don’t need to predict price. You need to align with it.
🪞 Final Thought:
Structure isn’t strategy.
It’s the mirror that shows what’s real before your bias speaks.
When you master structure, you stop forcing trades — and start flowing with them.
💬 Want more like this?
If this post resonated with you — drop a comment below.
Let me know what you'd like to dive deeper into — price action, gold setups, market structure, or the psychology behind your trades.
I’ll build future tutorials based on what matters to you.
📘 Shared by @ChartIsMirror
SellRejection Level
Daily Volume
Market Structure Shift
London US Session
Trend Line Break
Untapped Order Point
From Hype to Hesitation: What’s Next for Pump Fun ($PUMP)?Today, I want to break down the recent developments and fundamentals of Pump fun ( BYBIT:PUMPUSDT ) and its token PUMP — a project that initially launched with strong hype but is now facing serious investor concerns .
What is Pump fun?
Pump fun is a memecoin launchpad that allows users to launch and trade memecoins in a gamified, simplified environment. The idea was to create a frictionless way for anyone to generate and speculate on meme tokens, leveraging viral growth and community culture.
Its native token, PUMP , was introduced via an ICO priced at $0.004, with 12.5% of the total 1 trillion supply offered during the sale.
Latest Updates – Past 24 Hours Recap
PUMP Crashes Over 50% After ICO :
The token initially spiked to $0.0068 on launch day (July 16) , but has now dropped over 50%.
This is roughly 14% below its ICO price , creating concerns for short-term investors.
Founder Confirms No Airdrop Anytime Soon:
In a livestream with ThreadGuy , project founder Alon Cohen confirmed:
“ The airdrop is not going to be taking place in the immediate future. ”
While the team still plans to deliver an airdrop, Alon emphasized it must be well-executed and meaningful, not rushed for hype.
The current focus is on long-term growth and ecosystem sustainability, not short-term incentives.
Mixed Investor Sentiment:
High-profile trader Machi Big Brother ( Jeffrey Huang ) reportedly increased his long position in PUMP — even though he’s down over $5.8M on his position.
Meanwhile, two wallets linked to private sale investors dumped over 1.2B PUMP at $0.003 , taking a combined loss of $1.19M.
Declining Volume and Market Cap:
Trading volume has dropped significantly.
PUMP has lost over 40% of its value in the past 7 days.
Short-term holders appear uncertain, while the project team asks for patience and long-term vision.
Fundamental Outlook:
Pump fun’s future now heavily depends on:
The real utility of the platform as a meme coin incubator.
The team’s ability to regain trust after delaying the airdrop.
Whether new features or hype can revive volume and user engagement.
-------------------------------
Now, let's examine the PUMP token from a technical analysis perspective
From the outset, I must say that due to the small number of candlesticks that create the PUMP token, technical analysis may be a bit difficult , but we will use technical analysis tools to analyze this token.
The PUMP token seems to be moving in a descending channel since the beginning of its correction (over -50%) until now, we need a second price bottom to confirm the descending channel.
I expect the PUMP token to rise from the Potential Reversal Zone(PRZ) and near the Support lines to $0.0029(+15%) . PUMP Token increase can also be from the bottom of the ascending channel .
Second target: the upper line of the ascending channel.
Cumulative Long Liquidation Leverage: $0.002810-$0.002530
Cumulative Short Liquidation Leverage: $0.003498-$0.00327
Note: Stop Loss(SL): $0.002391
Please respect each other's ideas and express them politely if you agree or disagree.
Pump fun Analyze (PUMPUSDT), 1-hour time frame.
Be sure to follow the updated ideas.
Do not forget to put a Stop loss for your positions (For every position you want to open).
Please follow your strategy and updates; this is just my Idea, and I will gladly see your ideas in this post.
Please do not forget the ✅' like '✅ button 🙏😊 & Share it with your friends; thanks, and Trade safe.

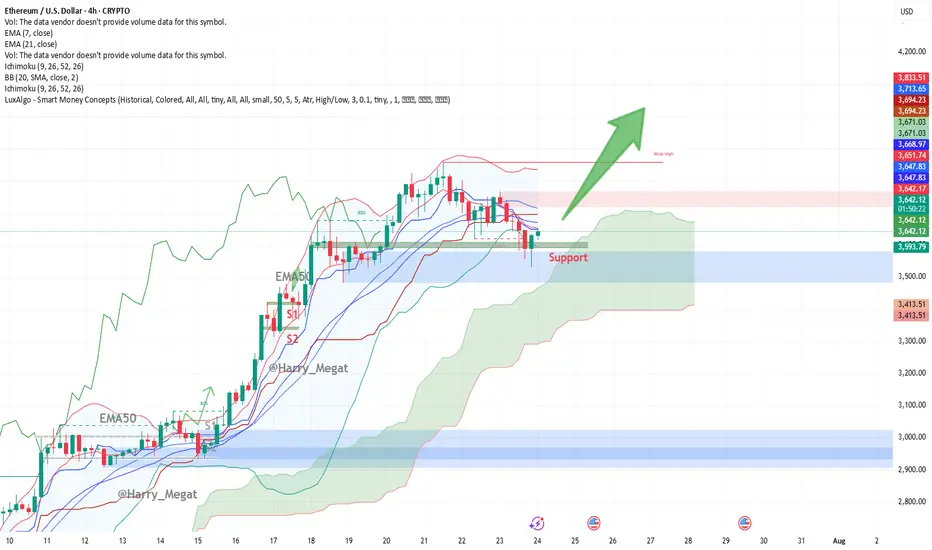
Ethereum (ETH/USD) 4-hour chart Technical AnalysisThis Ethereum (ETH/USD) 4-hour chart presents a **bullish setup**. Let’s break it down:
**Chart Overview:**
* **Price at the time of chart:** \~\$3,650
* **Support Zone:** \~\$3,615–3,630 (highlighted in green box)
* **Indicators:**
* **EMA 7 (Red):** \~\$3,653.87
* **EMA 21 (Blue):** \~\$3,669.75
* **Bullish Signal:** Large upward green arrow suggests expectation of a breakout rally from current support.
**Technical Analysis:**
**1. Bullish Bounce at Support**
* ETH tested the **horizontal support zone** multiple times, showing strong demand.
* The recent candle shows a **wick rejection** from the support zone — indicating buyer strength.
**2. Moving Averages**
* Price is trying to reclaim above the **EMA7**, with EMA21 nearby (\~\$3,670).
* A **bullish crossover** or strong candle close above both EMAs could confirm upside continuation.
**3. Structure**
* Previous resistance (\~\$3,615) has turned into **new support** — a classic bullish flip.
* The large green arrow projects a **potential breakout move**, targeting higher highs possibly above **\$3,750+**, then **\$3,900+**.
**Trade Setup Idea:**
| Type | Entry | Stop Loss | Take Profit 1 | Take Profit 2 |
| Long | \$3,655–3,660 | Below \$3,600 | \$3,750 | \$3,900+ |
**Watch Out For:**
* Rejection near EMA21 (\$3,670)
* False breakout if volume is weak
* Macro risk or sudden BTC movement dragging ETH
**Conclusion:**
The chart signals a **bullish bias** if ETH maintains above the support zone and reclaims both EMAs. A clean break above \~\$3,670–3,700 could spark further upside toward \$3,900+.
Buy z dips doctorTeladoc (TDOC) looks like a classic turnaround setup — high risk, but with meaningful upside if execution plays out. The stock is trading around $8 after a brutal drawdown, pricing in a lot of pessimism. But under new leadership, Teladoc is aggressively cutting costs, improving free cash flow, and refocusing on its Integrated Care segment while stabilizing the underperforming BetterHelp unit. Recent acquisitions (Catapult, UpLift) support this shift toward more integrated, network-based services.
Technically, the setup is compelling: Bollinger Bands are tightening and there’s a divergence forming — both early signals of a potential breakout or reversal. If the company can continue delivering on margin improvement and steadying revenue, the market may start to rerate the story. Execution is key, but at these levels, it could offer deep-value exposure to a recovering digital health player.

POUND DOLLAR LONG CONTINUATIONMarket Outlook: GBP/USD
25th July 2025.
The Pound-Dollar pair continues to maintain a bullish market structure, and our approach remains aligned with the prevailing trend. Recently, the price traded above a key 4-hour high, triggering a deeper pullback into discount pricing within the currently active H4 demand zone.
We are now observing price action closely, as this H4 demand level holds potential to serve as the launch point for the next bullish swing. As long as the structure remains intact, we remain buyers from this zone — anticipating a continuation of the upward momentum.

Eurousd techinical analysis.Eurousd techinical analysis next move posibale at h1 time frame not finchinal advice.

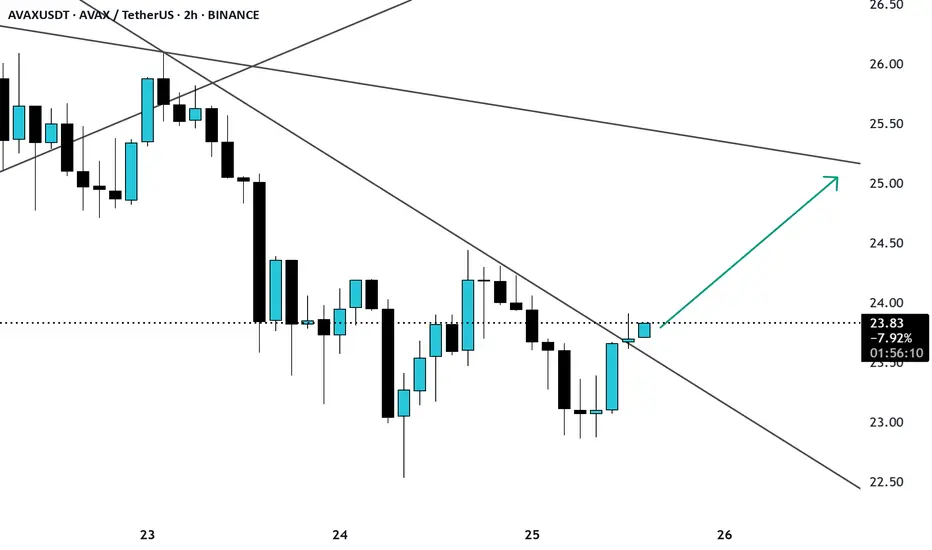
AVAX break of trendline resistance AVAX/USDT is showing a strong breakout attempt on the 2H timeframe, breaking above a descending trendline after multiple rejections from the $23.00 zone.
XRP 4H – Critical Retest Zone + Golden Pocket BelowXRP is sitting right on its prior breakout zone after a clean rally and trendline break. This zone is acting as critical support — the same area that triggered the last explosive move. Bulls want to see a bounce here with momentum building again (Stoch RSI is curling from oversold).
If this level fails, price could retrace deeper into the Fibonacci golden pocket (2.57–2.78), where stronger demand is likely waiting. That confluence of fib levels and past consolidation makes it a high-interest area for potential long setups.
For now, this is a pivotal moment. Either we bounce here — or things get a lot more interesting below.
#XRP #CryptoAnalysis #FibonacciRetracement #GoldenPocket #BreakoutRetest #Altcoins #TechnicalAnalysis #QuantTradingPro

Xvgusdt buy opportunity you don't want to miss!!!!Xvgusdt is currently trading within a potential ascending setup following a 5-leg drop, signaling a potential upward breakout.
We have identified a clear setup for potential accumulation and recommend establishing a stop loss level to manage risk in the event of a reversal.
Your engagement is valuable, so if you find this setup helpful, please consider liking the post and sharing your comments.
Thank you for your support.

#XRP Update #3 – July 18, 2025#XRP Update #3 – July 18, 2025
XRP has surged roughly 28% in its latest impulsive move. Naturally, we now expect a correction phase. Potential retracement levels are:
Level 1: $3.30
Level 2: $3.20
Level 3: $3.10
Pullbacks to any of these levels should not be alarming — they are typical and healthy corrections.
I plan to go Long if XRP bounces from the first correction zone. However, at the moment, I’m just observing, as the current signals are not strong enough to justify entry.
It’s also important to note that there are heavy whale sell orders between XRP’s current price and the $4.00 zone. Breaking through this resistance will likely require strong buy-side volume from large players. Caution is advised.

XAUUSD (1H Time frame) Read the captionXAU/USD Analysis (1H Timeframe )
This chart represents the XAU/USD (Gold vs US Dollar) price movement on a 1-hour timeframe, showcasing a well-defined ascending channel. The analysis highlights three critical zones:
1. Resistance Level (Upper Blue Zone):
This zone, located around the $3,440 - $3,450 range, marks the potential upper limit of the current bullish channel. A breakout above this level could indicate strong bullish momentum continuation.
2. Key Support Breakout Zone (Middle Purple Zone):
Around the $3,390 - $3,400 range, this area previously acted as resistance and now serves as a key support level. A price retest and bounce from this zone could confirm it as a new support base, potentially triggering a move toward the resistance zone again.
3. Support Level (Lower Purple Zone):
Found near the $3,320 level, this is the broader trendline and horizontal support zone that would be critical if the price breaks below the key support area. It acts as a major demand zone within the ascending channel.
Observations:
The price is currently in a strong uptrend within the rising channel.
A retest of the key support breakout zone is anticipated before potentially pushing higher toward resistance.
A breakdown below the key support could trigger a move toward the lower support level.
Technical Bias:
Bullish as long as the price remains above the key support level.
Bearish reversal may occur on a confirmed breakdown below the ascending channel and lower support zone.

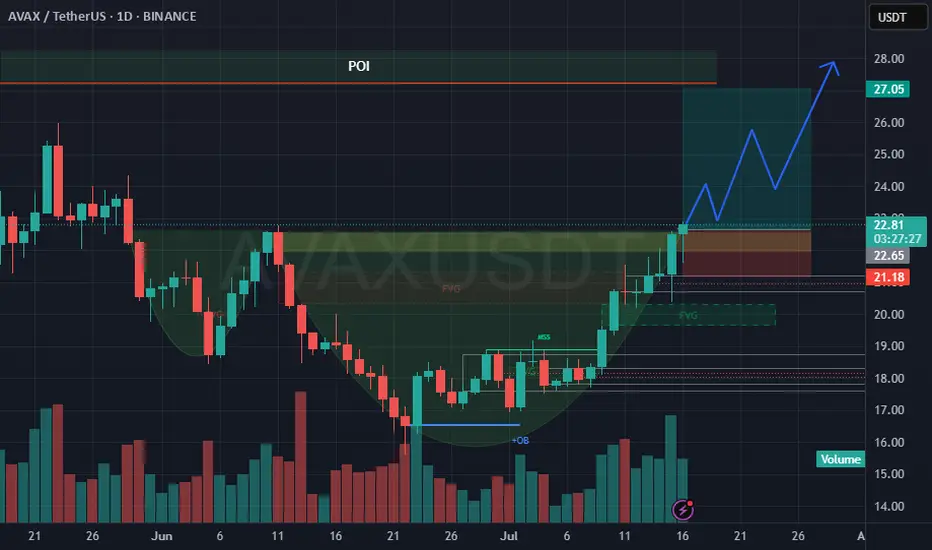
LONG ON $AVAXThe AVAX/USDT chart presents a bullish continuation setup supported by a completed cup formation, bullish market structure shift (MSS) and fair value gap (FVG) fills. With rising volume on the right side of the cup and a clean break above recent resistance, the market shows clear signs of institutional interest and buyer strength. The price is approaching a Point of Interest (POI) near $27, which is likely to serve as a target zone or temporary supply barrier.
A long trade setup is valid between $21.50 and $22.60 which aligns with the retest of the FVG zone, previous structure breakout and early handle development. Stop loss should be placed at $20.9, protecting the setup from invalidation while maintaining a strong risk-reward profile. Target levels include $24.50 (TP1) for an early exit, $26.80 (TP2) near the POI base and $27.05\$27.20 (TP3) at the top of the expected move. R:R range from 2:1 up to 5:1 depending on point of entry.
To execute, traders should watch for bullish confirmation on lower timeframes (1H–4H) within the entry zone, such as a bullish engulfing candle, BOS or a volume-backed rejection. A scaling entry strategy can improve average price and partial profit-taking at key levels ensures the position remains protected as the trade unfolds. Overall, the structure, volume, and Smart Money signals support a high-probability long from the $21.50\$22.60 range toward the $27 POI.
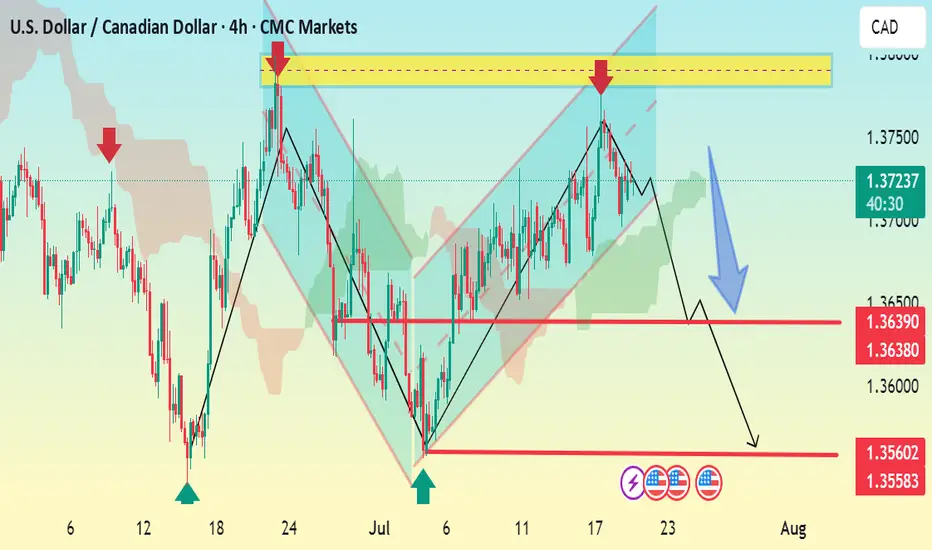
USDCAD 4H Bearish SetupThe USDCAD chart shows a clear bearish breakdown from the ascending channel. Price has broken below support near 1.3720, confirming a shift in structure.
Key Analysis:
Bearish Momentum: Break below the channel and current market structure signals downside pressure.
Immediate Resistance: 1.3725–1.3745 zone (yellow area) where price previously rejected.
Support Levels:
1.3639 / 1.3638: Short-term support — possible temporary bounce area.
1.3560: Main target — previous demand zone.
Trade Idea:
Sell below 1.3720
TP1: 1.3639
TP2: 1.3560
SL: Above 1.3750 (above resistance zone)
Summary:
Bias remains bearish as long as the price stays below 1.3725–1.3750 resistance zone. Confirmation of further downside expected on break below 1.3638.
Let me know if you want this as a signal format or turned into an image.
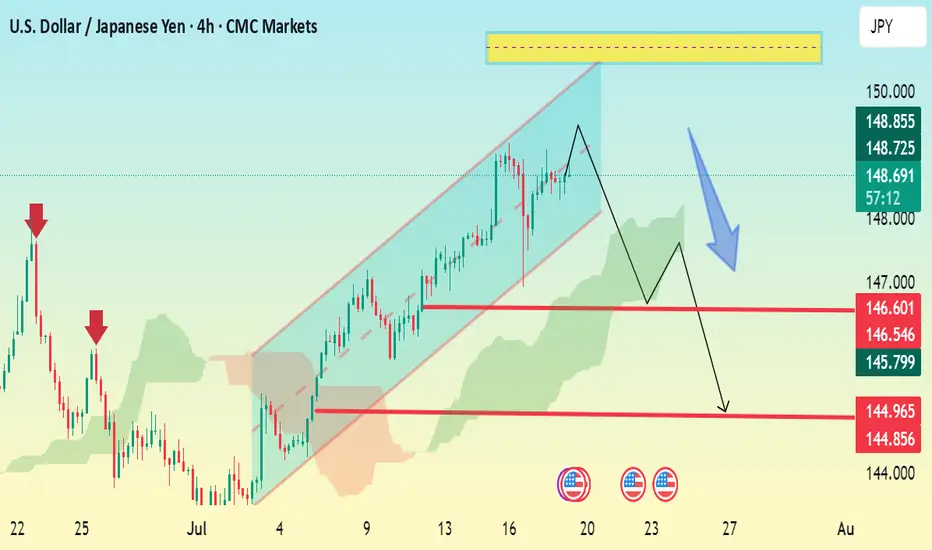
USD/JPY 4H Bearish Setup – Channel Breakdown ExpectedThe chart shows USD/JPY in a rising channel with a projected bearish reversal setup forming. Here’s a breakdown:
🔹 Current Price: 148.83
🔹 Pattern Observed:
The pair is trading inside a rising channel.
A potential double top or lower high formation near the top of the channel suggests weakening bullish momentum.
Price may break down through the channel support.
🔻 Bearish Scenario (as shown by the blue arrow):
1. Initial drop expected to the support zone around:
146.60 – 146.54
Minor consolidation possible at this level.
2. If broken, next target zone is:
144.96 – 144.85
🔑 Key Levels:
Resistance Zone: 149.80–150.00 (highlighted in yellow)
Support Levels:
First: 146.60
Second: 144.96
✅ Bearish Confirmation:
A 4H candle close below 146.60 would confirm the bearish move.
Watch Ichimoku cloud — if price breaks and closes below the cloud, it will strengthen the downtrend.