Ethereum Analysis + Market Overview 🚀 Ethereum Analysis + Market Overview 🚀
Before diving into Ethereum, let’s quickly review the overall market conditions 👇👇👇
(For a more detailed market analysis, you can check my previous post, I’ll link it below.)
---
🔹 Analysis style:
Reviewing previous highs/lows breakouts in the mid-term (MWC - 4H).
Entries based on momentum & volume.
---
♦️ USDT.D
Support: 4.22
Max expected correction: 4.51
If 4.51 breaks upward, this could push us toward short positions.
---
♦️ BTC.D
Yesterday’s levels & analysis still remain valid.
Remember, on HWC (1D), after the recent downtrend, there’s only been one bullish candle.
For altcoins to rally: BTC.D must drop below 61.6 → 60.83 → 60.42.
Otherwise, if BTC.D grows (bearish for alts), 62.17 is the key resistance to watch.
---
♦️ TOTAL (Crypto Market Cap)
Must break 3.91 to confirm a bullish trend.
Early signal: 3.85 (1H timeframe).
---
♦️ TOTAL2 (Altcoin Market Cap)
Early bullish signal: 1.48
Confirmation level: 1.55
---
♦️ ETH (Ethereum)
Ethereum has shown strong support around 3500, despite the 48-hour drop, which reflects solid buying activity.
Additionally, positive whale news is increasing.
Early & risky trigger: 3653 (1H) – already broken.
Next potential entries:
3750 (1H)
3833 (4H)
Preferred entry: 3750, as it allows a tighter & safer stop-loss.
Beware: Fake breakout probability around 3833 is high.
Stop-loss for all 3 levels: 3455.
---
🔸 Entry Strategy:
If volume & momentum increase → place a stop-buy order on the exchange.
If volume is weak → wait for confirmed breakout above 3750.
---
♦️ ETH.D
The chart is fully bullish.
If ETH hits 3750, an early long position could be taken.
---
💎 Follow me & hit 🚀 for more real-time updates and setups!
---
Community ideas

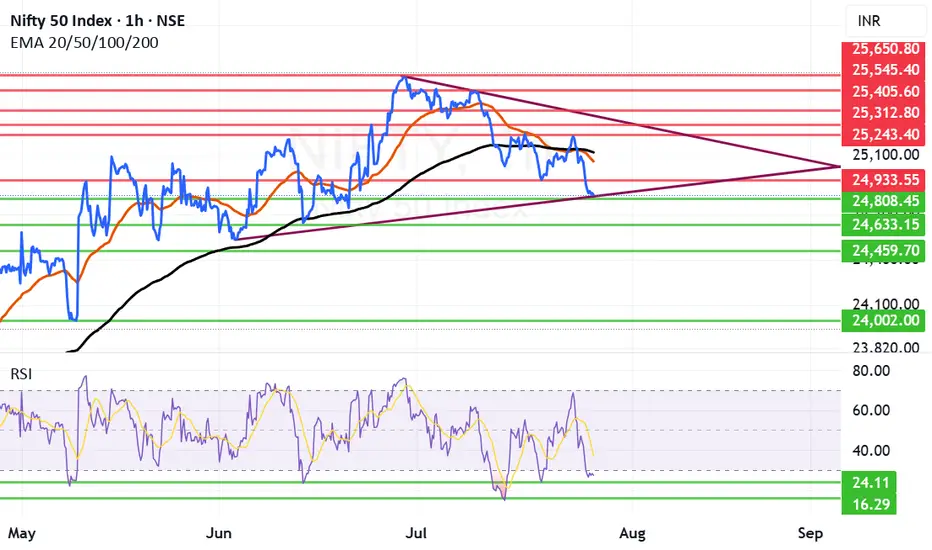
Nifty Next Week: Can Nifty make a comeback after drubbing?Nifty received proper drubbing after falling below critical supports of Mother and Father line. Trump's warning signals for IT companies and the continuing deadlock in Trade deal with US weighing on Indian markets. Additionally the earning season also giving many disappointing and few good result has broken the back of the Bull rally and now Nifty is reeling under 25K levels.
Only silver line in the cloud seems to be that RSI is below 30. Currently RSI is at 27.52. Usually RSI has found support near 24 if not 24 it might bounce back from 16. So hopefully we can see some short covering in the beginning or middle of next week. Also next week the decision for Tariffs should come. If the result will be in favour of India we might see a strong come back as lot of sectors / Large cap stocks currently are looking oversold.
The Supports for Nifty Remain at: 24808 (Strong support), 24633, 24459 Below 24459 the index will be in firm grip of Bears who might try to drag Nifty towards 24K levels or even below that in unlikely circumstances.
The Resistances for Nifty Remain at: 24933, 25058 (Mother Line Resistance of Daily Chart), 25119 (Father Line Resistance) and 25243. After we get a closing above 25243 the Bulls can gain some momentum.
Disclaimer: The above information is provided for educational purpose, analysis and paper trading only. Please don't treat this as a buy or sell recommendation for the stock or index. The Techno-Funda analysis is based on data that is more than 3 months old. Supports and Resistances are determined by historic past peaks and Valley in the chart. Many other indicators and patterns like EMA, RSI, MACD, Volumes, Fibonacci, parallel channel etc. use historic data which is 3 months or older cyclical points. There is no guarantee they will work in future as markets are highly volatile and swings in prices are also due to macro and micro factors based on actions taken by the company as well as region and global events. Equity investment is subject to risks. I or my clients or family members might have positions in the stocks that we mention in our educational posts. We will not be responsible for any Profit or loss that may occur due to any financial decision taken based on any data provided in this message. Do consult your investment advisor before taking any financial decisions. Stop losses should be an important part of any investment in equity.
GBPUSD BUY IDEAWe will be looking into taking the buys as per the chart. I hope this is an idea that resonates with you. Happy trading days
EUR/USD | Correction Near Key Demand – Watching for Rebound!By analyzing the EURUSD chart on the 4-hour timeframe, we can see that after the last analysis, the price started a correction and is currently trading around 1.17150. I expect that once it enters the 1.16780–1.17100 zone, we could see a rebound from this key demand area. If the price holds above this zone, the next bullish targets will be 1.17370 as the first target and 1.17730 as the second.
Please support me with your likes and comments to motivate me to share more analysis with you and share your opinion about the possible trend of this chart with me !
Best Regards , Arman Shaban

XAUUSD Our old trade is holding in profits from top. but this one is reetry and played well but news can change thing dramatically
Manage risk at first
Sell short plan 15 minutes time frame

XAUUSD CHART PATTERN 2\HTrade Setup (Buy Position):
Entry Point: 3330
Target 1: 3380
Target 2: 3420
Stop Loss: 3290
Strategy Insight
You’re targeting a +50 pip move to Target 1 and +90 pip move to Target 2.
Risk is -40 pips from the entry (3330 → 3290).
Risk-Reward Ratio:
To Target 1: 1.25 : 1
To Target 2: 2.25 : 1
This is a moderately aggressive setup with a good reward potential.
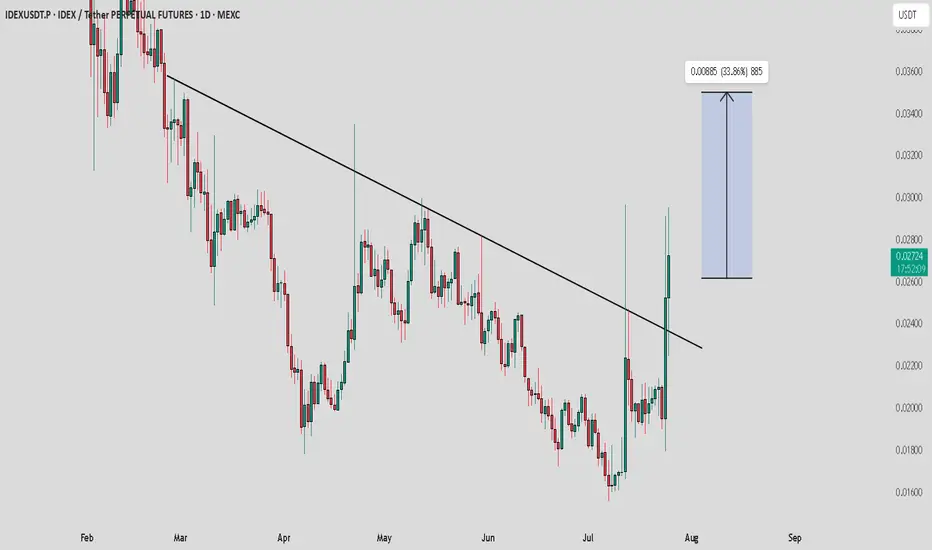
IDEX / USDT : looking bullish in choppy market situationThe overall market is not looking very strong right now, but IDEX is showing bullish potential. It's moving with strong volume and confirming its breakout with consistent bullish moves.
Key Points:
IDEX seems to be breaking out with solid momentum.
Watch for confirmation of continued bullish movement to ensure it’s not a fakeout.
Note:
Manage your risk carefully. Only invest money you can afford to lose. Always Do Your Own Research (DYOR) before making any decisions. Stay cautious and ensure you're prepared for any market fluctuations.
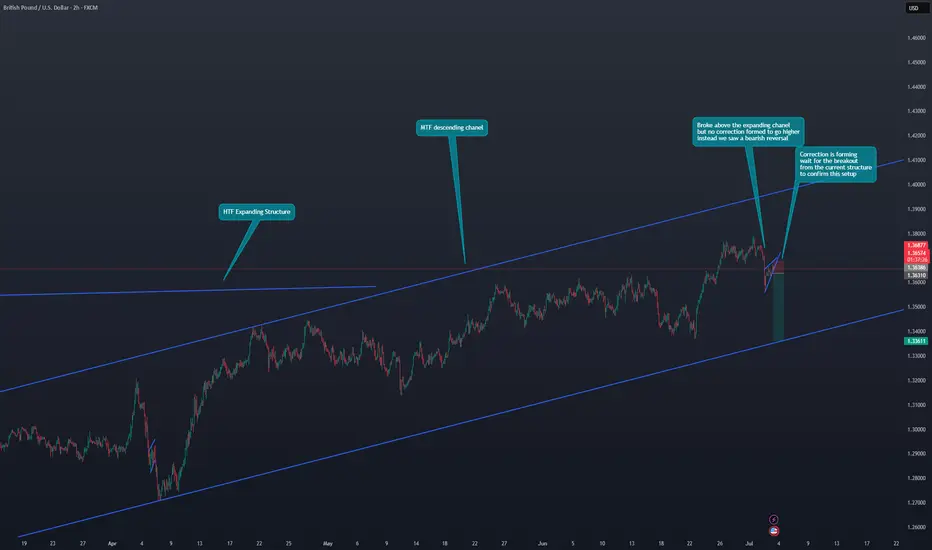
GBP/USD Sells incomingHi Traders!
1.HTF Expanding structure
2.MTF Asceding Chanel
3.False Breakout and LTF Reversal
4.LTF Continuation correction is forming
5.Wait for the breakout from the current structure to confirm this setup
Report - 25 jully, 2025U.S.–EU Tariff Negotiations Stabilizing Markets
Reports confirm the U.S. and EU are nearing a deal for 15% reciprocal tariffs—lower than the initially threatened 30% by President Trump. This easing of tensions led to moderate equity gains in both blocs, with the Stoxx 600 reaching a 6-week high before closing +0.2%. Pharmaceutical and auto stocks outperformed (Volkswagen +2.3%, Bayer +2.3%).
Forecast: If the 15% deal is finalized by the August 1 deadline, it would remove a key overhang on equities and boost cyclical sectors reliant on transatlantic trade. A failure, however, risks escalation, triggering retaliatory tariffs by the EU on $93bn of U.S. goods, dragging risk assets sharply lower.
DXY Outlook: Tariff de-escalation boosts safe-haven flows and investor optimism, supporting USD strength.
S&P 500: Short-term relief rally expected if the 15% tariff framework is signed. However, margin compression risks remain from lingering supply chain disruptions.
Tesla vs Trump: Policy Shock Rattles EV Sector
Elon Musk warned that Trump's anti-EV stance and trade war posture will sharply erode Tesla’s regulatory credit revenue and remove the $7,500 EV tax credit. Tesla's stock has cratered 37% since December, with a sharp 8% drop yesterday. Adjusted Q2 net income was down 22%, revenue -12%.
Risk Forecast: Loss of EV subsidies + political fallout between Musk and Trump could drag Tesla further and dampen broader EV sector growth.
XAUUSD: Rising political uncertainty and risks to the U.S. tech sector may drive safe-haven flows into gold.
Dow Jones: Tesla's underperformance and anti-EV policies could limit industrial sector gains.
ECB Holds Rates Amid Trade Risk Fog
The European Central Bank paused its easing cycle, holding the benchmark rate at 2%. Lagarde emphasized a "wait-and-watch" stance, signaling uncertainty due to unresolved trade talks and tariff volatility.
Market Implication: Eurozone government bond yields rose (10Y Bund at 2.70%), paring rate-cut bets. The euro softened to $1.1760.
EURUSD: Lack of further ECB accommodation and weaker consumer confidence amid trade frictions.
Fed Independence in Jeopardy? Market Confidence Wobbles
Pimco warned that White House pressure on Fed Chair Powell—including potential firing and scrutiny over $2.5bn HQ renovations—could destabilize markets. Trump continues pushing for aggressive 1% rates, diverging from current 4.25–4.5% levels.
Fiscal/Political Implication: Undermining Fed autonomy risks flight from U.S. bonds, undermining monetary policy credibility and capital inflows.
USDJPY: Yen may gain if markets lose faith in U.S. institutional integrity, despite rate differentials.
DXY: Temporary support from yields, but structural downside if Fed credibility erodes.
Deutsche Bank and BNP: Diverging Strengths in Volatile Landscape
Deutsche Bank posted its strongest Q2 in 18 years, driven by litigation charge reversals and stable investment banking performance. BNP Paribas also reported solid FICC trading (+27%), though equity trading lagged due to weak derivatives demand.
Equity Implication: Strong capital returns and stable European banking profitability support DAX resilience amid trade noise.
DAX: Boosted by banking and auto outperformance.
China–EU Trade Strains Escalate
Von der Leyen directly confronted Xi Jinping over trade imbalances and support for Russia. EU exports to China are down 6% YoY while Chinese imports to the EU are up 7%. Xi defended Beijing’s stance, warning against "decoupling" rhetoric.
Geostrategic Implication: EU may escalate anti-dumping and export control measures. Markets may see renewed volatility in European industrials and luxury sectors reliant on China.
XAUUSD: Rebalancing of power and heightened East–West tensions favor gold.
Oil Oversupply Warning from TotalEnergies
Total warned of an oil glut due to OPEC+ production increases and weakening global demand. Q2 profits fell 30% YoY. Brent now likely to stay within $60–70 range barring major geopolitical flare-ups.
Crude Oil: Short- to medium-term downside risk with soft demand and oversupply fears.
Energy Stocks: Dividend maintenance remains but debt levels and margin pressures may weigh.
AI Spending Surges – Alphabet and SK Hynix
Alphabet posted a 19% Q2 profit jump as AI integration boosts search volumes. Google’s cloud revenues rose 32%. Capex raised to $85bn. SK Hynix also posted record revenues from high-bandwidth memory chip sales, extending its lead over Samsung.
S&P 500: AI-driven earnings upside bolsters tech sector. Expect multiple expansion in mega-cap AI-exposed names.
XAUUSD : Robust AI investment supports risk appetite but inflationary fears could lift gold marginally.

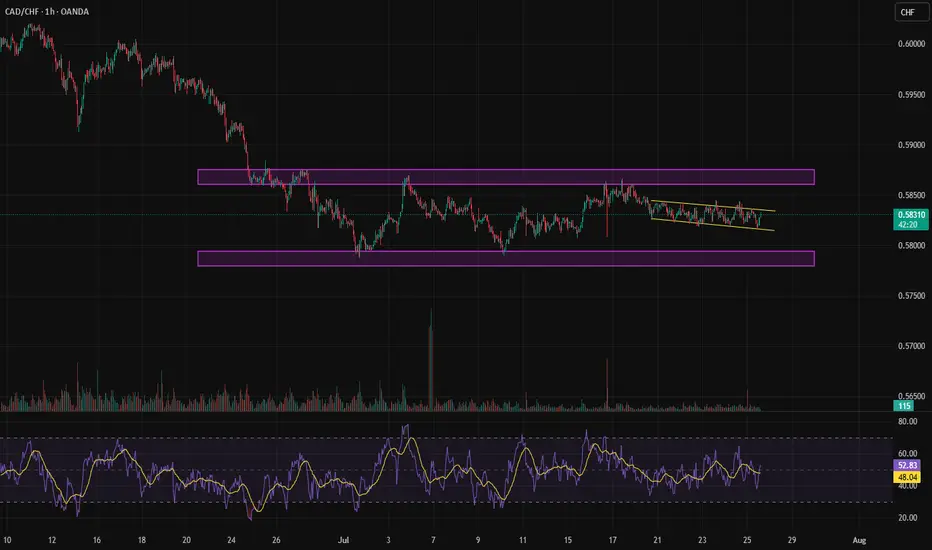
Close to breaking out of the range.After nearly 31 days, a consolidation has formed within the range, which could signal either a buy or sell opportunity.
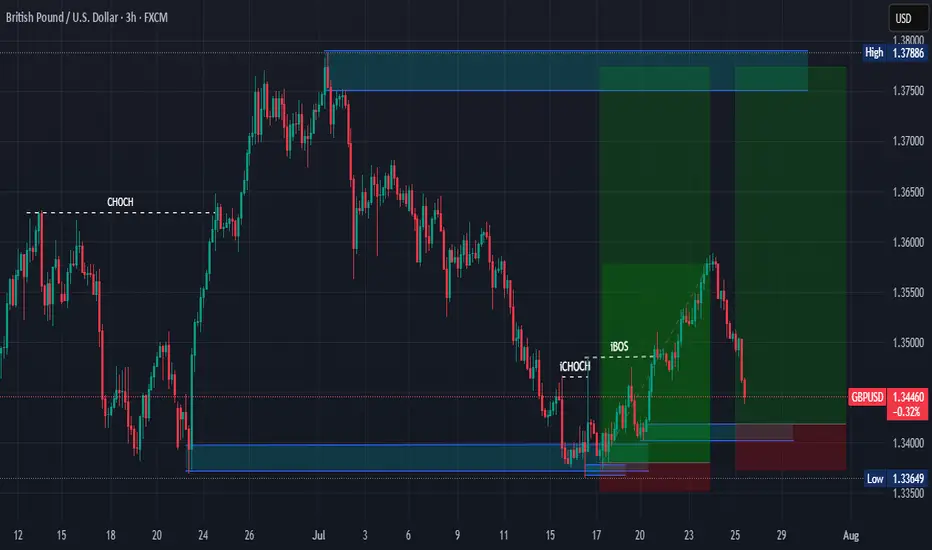
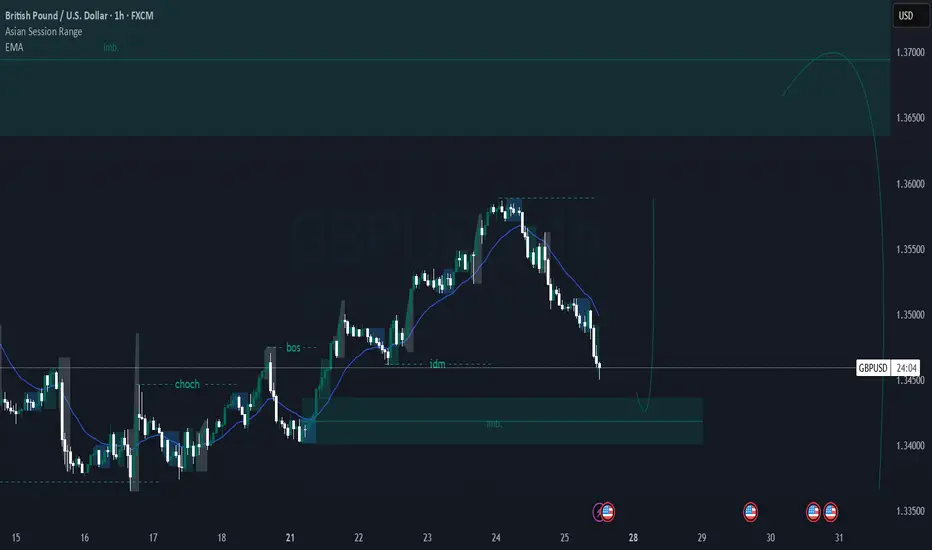
GBP/USD Technical Analysis Anticipating a bullish reversal Price made a CHoCH, followed by a Break of Structure (BOS), confirming a bullish shift.
Currently, price is retracing into a high-confluence zone:
Internal demand (order block)
Imbalance (IMB)
Near the EMA
Reaction expected around 1.34300–1.34600.
If this zone holds, we anticipate a bullish push toward 1.36000+ (better to make a confirmation entry)
Bearish retest or deviation for Bitcoin117000 is key. it’ll decide whether this is a bearish retest or just a deviation. i believe it’s a bearish retest and we’re setting up for 110-114 next.
last drop came when price kept failing to hold above EQ. now we’re below the EQ of the ath/previous ath range. if price can’t reclaim that either, a deeper drop is likely. a 12h close above EQ could open the path toward 120-121k, but that’s the less probable case in my view.
why? nasdaq and spx are in premium zones (fib extensions), and holidays are near for big players. as profit taking hits there, pressure will echo here. simple cause, predictable effect.

BITCOIN Is this just a giant Bull Flag?Bitcoin (BTCUSD) is basically on its first strong pull-back since the July 14 All Time High (ATH), as it is the 3rd straight red day going from roughly $120300 to below $115000 as of this moment.
Technically this Channel Down pull-back looks like a Bull Flag to the uptrend that started following the June 22 Low. The 1D RSI pattern is similar to the May 22 - 30 fractal, which was also a correction that started after a Channel Up and initially hit the 1D MA50 (blue trend-line), only to rebound a settle for a last dip lower closer to the 1D MA200 (orange trend-line).
If the 1D MA50 fails to contain the current correction, we may again be faced with a slightly more prolonged pull-back, which may be translated into an Accumulation Phase that could eventually lead to prices above $130000 by September.
Do you think that will be the case or we will see an instant rebound? Feel free to let us know in the comments section below!
-------------------------------------------------------------------------------
** Please LIKE 👍, FOLLOW ✅, SHARE 🙌 and COMMENT ✍ if you enjoy this idea! Also share your ideas and charts in the comments section below! This is best way to keep it relevant, support us, keep the content here free and allow the idea to reach as many people as possible. **
-------------------------------------------------------------------------------
💸💸💸💸💸💸
👇 👇 👇 👇 👇 👇


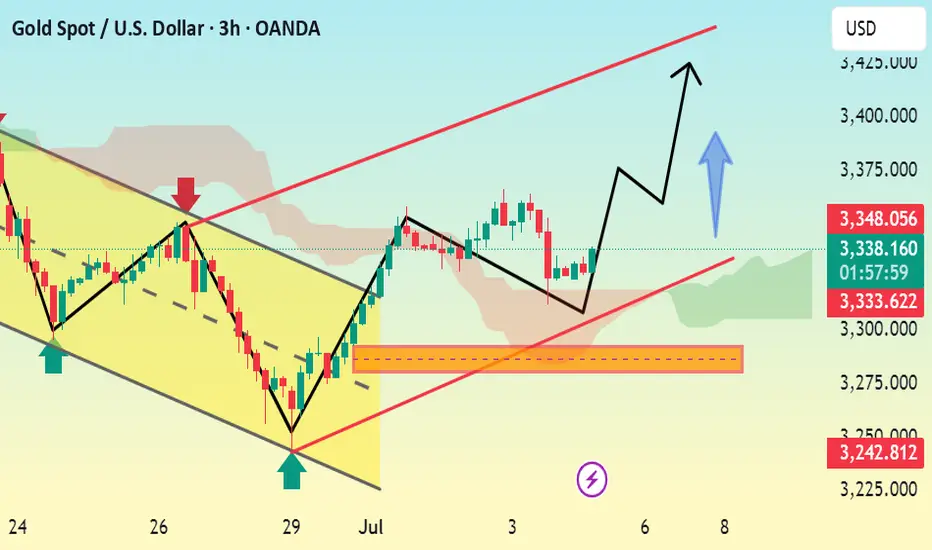
Gold’s Precision Drop: Wave 5 Ignites the Bullish Reversal
---
### 🚀 **Golden Opportunity Ahead: Wave 5 Bullish Breakout Incoming!**
After perfectly completing the **bearish Gartley pattern**, gold dropped precisely to the **target zone at 3,323**, just as predicted. This move confirmed the formation of **Wave 5**, signaling the end of the corrective phase.
Now, all signs point to a **strong bullish reversal**—and the next step is a powerful rally toward the predefined targets. This is a **prime buying opportunity** for traders looking to ride the wave!
### 🎯 **Buy Zone:**
- **Entry:** Around **3,323 USD**
### 📈 **Profit Targets:**
| Target | Fibonacci Level | Price (USD) |
|--------|------------------|-------------|
| TP1 | 1.0 | 13,447.875 |
| TP2 | 1.27 | 13,536.025 |
| TP3 | 1.618 | 13,649.640 |
The link of. The previous analysis is below in the comment
---

ETHW Looks Bullish (12H)Considering the CH and bullish CHs on the chart, as well as the recent reclaim of key levels, we can maintain a bullish outlook on this coin.
The targets have been marked on the chart.
If a pullback occurs to the green zone, it could present a buy/long opportunity.
A daily candle close below the invalidation level will invalidate this analysis.
For risk management, please don't forget stop loss and capital management
Comment if you have any questions
Thank You

Bitcoin (BTC): OrderBook is Hinting To $115K Bounce | Thoughts?Bitcoin has recently broken the $116K local neckline zone and reached the $115K area, which has been at our attention due to huge orders sitting there.
What we are thinking is that this zone will be a good bounce area, which should lower the price to $120K.
Either way, this zone is important, so keep an eye on it!
Swallow Academy

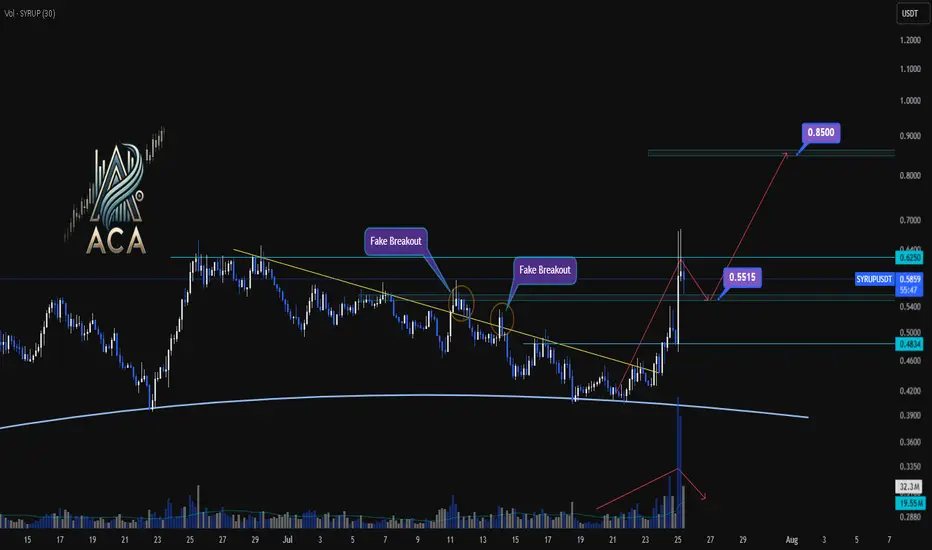
SYRUPUSDT 4H Chart Analysis | Trendline Breakout & Next MovesSYRUPUSDT 4H Chart Analysis | Trendline Breakout & Next Moves
🔍 Let’s break down the latest action on the SYRUP/USDT 4H chart and pinpoint what comes next as trend and momentum cues line up for traders.
⏳ 4-Hour Overview
- The recent breakout above the key trendline was backed by a surge in volume, providing clear momentum confirmation and pushing price toward resistance.
- Price has already reached 1.5R of the initial breakout target, a strong sign the trend is in motion.
- Upon touching the $0.6250 resistance, momentum cooled, with volatility decreasing — a classic consolidation phase after a high-energy move.
🔻 Correction & Structure
- With volume subsiding and momentum slowing post-$0.6250, we’re now expecting a corrective move down toward $0.5515.
- This retracement zone will be critical to watch for higher low formation – a bullish structural signal if supported by volume confirmation.
🔺 Long Setup:
- Should SYRUP reclaim and break above $0.6250 after setting a higher low at $0.5515, and with renewed volume, we could see another strong leg higher.
- The next major resistance sits around $0.85 — this aligns as a logical upside target based on the range extension.
📊 Key Highlights:
- Trendline breakout with sharp volume spike = momentum confirmation.
- 1.5R reached before first deep pullback; structure remains bullish above $0.5515.
- Watch for a higher low and subsequent break of $0.6250 with volume to confirm the next move to $0.85.
🚨 Conclusion:
SYRUP’s chart is at a pivotal juncture: a constructive pullback to $0.5515 could set up the next wave higher if supported by volume. A confirmed breakout above $0.6250 targets $0.85 — stay patient and wait for volume signals at key levels.
DeGRAM | GOLD will retest the channel boundary📊 Technical Analysis
● Fresh rejection at the blue resistance line (~3 435) pushed XAU back to the 3 355 mid-band, yet successive higher-lows (green arrows) keep price inside the May-origin rising channel.
● The pullback is probing 3 328-3 355 — confluence of the former flag roof and triangle top; holding this zone should launch another test of 3 400/3 435, with the channel crest targeting 3 500.
💡 Fundamental Analysis
● U-S S&P-Global PMIs softened, nudging 2-yr real yields to three-week lows, while cautious ECB rhetoric limits dollar gains — both supportive for gold.
✨ Summary
Long 3 328-3 355; above that aims 3 400 ➜ 3 435, stretch 3 500. Invalidate on an H4 close below 3 293.
-------------------
Share your opinion in the comments and support the idea with a like. Thanks for your support!

DOGE : Idea.Hello, good ? Good.
Enter in doge here is not a bad idea in SPOT.
• Above the last important resistance.
• Retest on 50 Weekly MA.
• Above 50 rsi weekly.
• Bollinger bands in consolidation.
Need to confirm rejection in weekly like always.
If rejectyion here : x2 incoming.
Good luck guys, take care of you.

DeGRAM | EURGBP exited the channel📊 Technical Analysis
● Breakout: price burst from the July descending wedge, reclaimed 0.8695 former cap, and is now riding a steep intraday channel of higher-highs; the channel mid-line aligns with the broken wedge roof, adding fresh support.
● A pennant is consolidating just above 0.8695; its measured pole and the outer channel top converge at the next horizontal barrier 0.8739.
💡 Fundamental Analysis
● Softer UK July composite-PMI (47.9 vs 50.2 prior) revived BoE cut bets, while ECB speakers flagged “premature to talk easing,” narrowing the rate gap in the euro’s favour.
✨ Summary
Long 0.8695-0.8705; pennant break targets 0.8739. Bias void on a 30 m close below 0.8648.
-------------------
Share your opinion in the comments and support the idea with like. Thanks for your support!

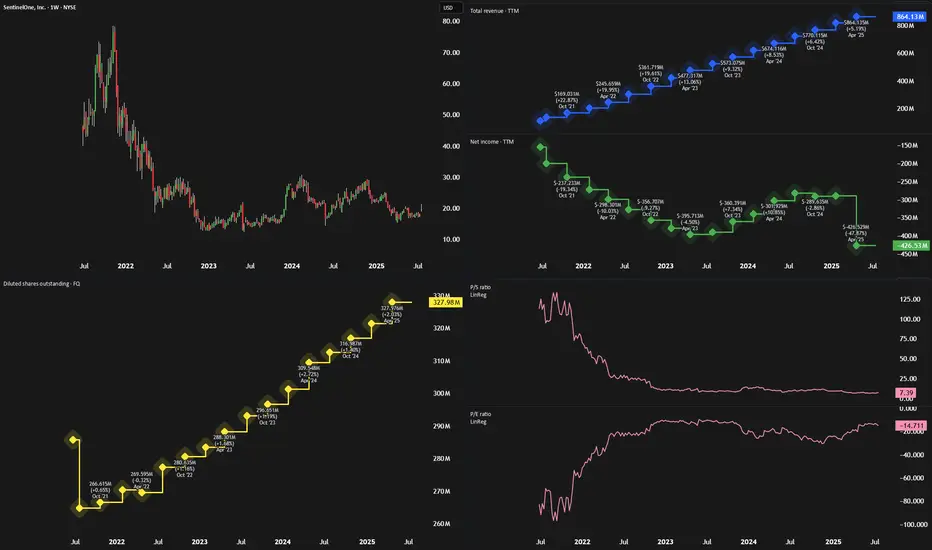
SentinelOne Looks Like Palantir Before The BreakoutIn every market cycle, some high-growth companies are misunderstood—until they aren’t. Palantir (PLTR) was one such stock, dismissed early for its lack of profitability and complex model, only to soar when its AI tools gained traction. Now, SentinelOne (NYSE: S) may be next in line.
🧠 What SentinelOne Does
SentinelOne is a top-tier cybersecurity firm offering an AI-powered endpoint protection platform called Singularity. Like Palantir, SentinelOne has faced criticism for:
Persistent losses
High stock-based compensation (SBC)
A misunderstood business model
Despite this, its technology is sticky, deeply embedded in client IT systems, and well-positioned to ride macro trends in AI and cybersecurity.
📈 Financials: Turning a Corner
While the stock hasn’t moved much in two years, trading around $18, SentinelOne’s fundamentals are improving:
Revenue Growth: Double-digit YoY revenue growth (23%+ in each of the last 10 quarters)
Free Cash Flow: $214 million in the past 12 months (~25% FCF margin)
Gross Margins: High and improving
Operating Expenses: Slowing, creating operating leverage
Adjusted Earnings: Near breakeven, signaling profitability is in reach
These trends mirror Palantir’s path before its breakout, particularly the shift from high OpEx to better margins and rising free cash flow.
💰 Valuation: Still Underrated
SentinelOne is trading at only 6x sales and 27x free cash flow, despite:
Strong 20%+ expected revenue growth
Analyst EPS estimates of ~$0.50 by 2028
A market cap under $6 billion
It’s significantly cheaper than peers like CrowdStrike and Palo Alto Networks—despite having similar growth and margin profiles.
⚠️ Risks to Consider
Fierce Competition: Cybersecurity is a crowded field. SentinelOne will have to keep innovating to stay relevant.
Market Sentiment: As a high-growth name, it may be hit hard in downturns.
Limited TAM vs. PLTR: The cybersecurity market isn’t as vast as AI data platforms.
🚀 Final Take
With strong recurring revenue, improving profitability, and an attractive valuation, SentinelOne looks poised for a re-rating. While it may not match Palantir’s scale or splash, the setup is strikingly similar.
Rating: Strong Buy
AMD: Potential Mid-Term Reversal from Macro SupportPrice has reached ideal macro support zone: 90-70 within proper proportion and structure for at least a first wave correction to be finished.
Weekly
As long as price is holding above this week lows, odds to me are moving towards continuation of the uptrend in coming weeks (and even years).
1h timeframe:
Thank you for attention and best of luck to your trading!
