BTCUSD Analysis : Channel Break + QFL Setup | Structure Analysis📊 Chart Overview
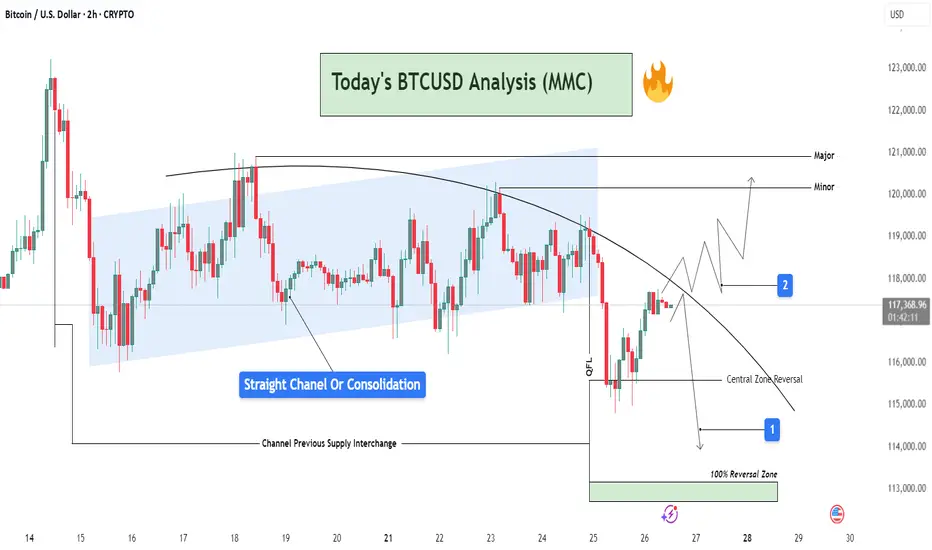
This 2H BTCUSD chart reveals a comprehensive view of market behavior transitioning from a phase of consolidation into a potential breakout or further rejection. The price action is analyzed inside a parallel channel, transitioning into a curved resistance path, which is currently governing the market structure.
🔵 Phase 1: Consolidation Inside a Straight Channel
Price has respected a clear ascending channel (highlighted in blue) from July 16 to July 24.
This phase shows a range-bound movement with defined supply and demand zones.
Labelled as “Straight Channel or Consolidation”, this represents a potential accumulation/distribution zone.
The Channel Previous Supply Interchange marks an important S/R flip zone, now serving as a key reference for future reactions.
🔻 Phase 2: Break of Structure & Curved Resistance
Price broke down below the channel support and is now respecting a downward curved trendline.
This indicates a shift in momentum from neutral to bearish, forming lower highs.
A sharp drop occurred post-channel exit, marking a QFL (Quasimodo Failure Level) area—hinting at smart money involvement or liquidation hunt.
🔁 Reversal Scenarios & Key Levels
There are two possible future paths visualized:
🟥 Scenario 1: Bearish Continuation
Price respects the curved trendline, failing to break resistance.
A rejection near the current region (~117.5k) could lead price back toward:
Central Zone Reversal near 115,000 USD
Further into the 100% Reversal Zone (green zone) near 113,500–114,000 USD
Ideal for short entries after clear rejection confirmations.
🟩 Scenario 2: Bullish Breakout
Price breaks and sustains above the curved resistance.
Temporary resistance seen at Minor level (~120,000 USD), followed by Major resistance near 121,000 USD.
This scenario requires bullish volume and reclaim of structure, invalidating the short bias.
🧠 Strategic Viewpoint & Trade Mindset
Market is at a decision point—either confirming a bearish rejection from dynamic resistance or invalidating it for a bullish reversal.
Patience is key; wait for either:
A failed breakout attempt (short opportunity), or
A confirmed breakout and retest (long opportunity).
Use lower timeframes (15m–1h) for execution once direction is confirmed.
Community ideas
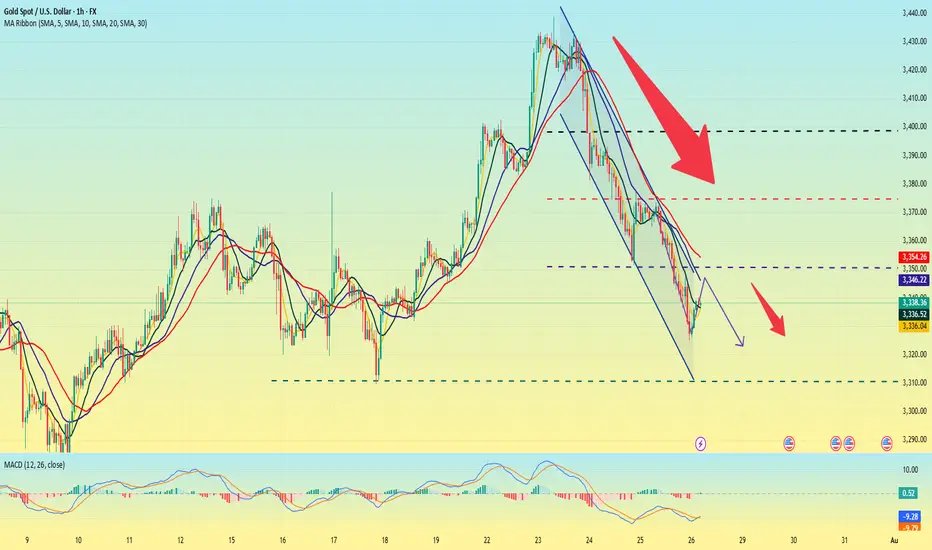
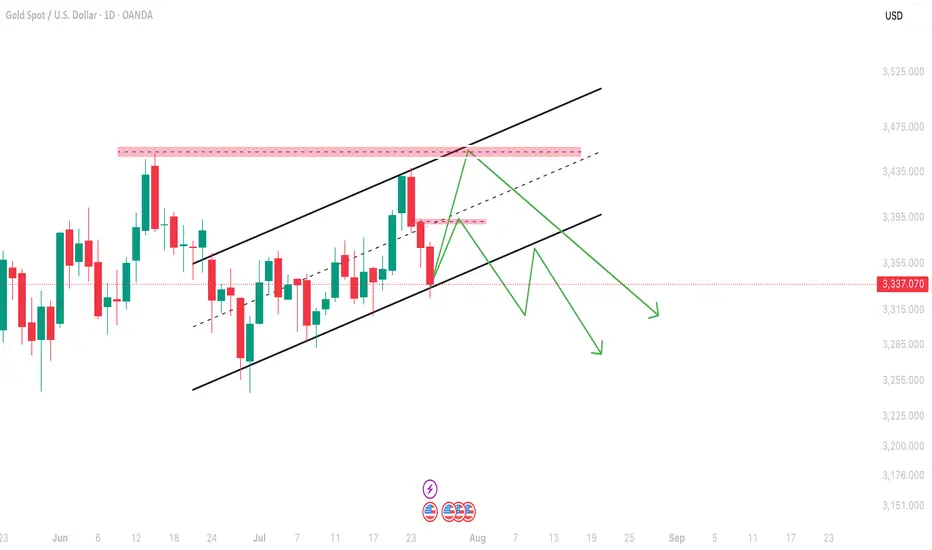
Gold is going down. It may continue next week.On the last trading day of this week, the bears attacked strongly and continued to refresh the recent lows, reaching the lowest point near 3325 before stopping.
From Monday's 3345 to 3440, it closed near 3337. This week, it also walked out of the large range roller coaster pattern, and all the strengths in the previous period did not exist. Under the continuous downward trend, the bulls were also vulnerable, and there was not even a strong rebound, which indirectly explained the strength of the bears in the short term.
As for the current trend, the bears are likely to continue to be strong, and before there is a symbolic upward breakthrough, we still need to maintain the idea of shorts to operate. The current upper pressure is maintained near 3350, which is also the bottom position touched for the first time in the previous period. It is possible that it will be transformed into a top-bottom conversion pattern; and the strong support level below is near 3310.
When the Asian market opens next Monday, we need to pay close attention to whether there is a gap problem on both the bulls and bears. After three consecutive negative daily lines, all the moving average systems have been broken, and it is also likely to form a resonance pressure pattern. On Monday, gold will first touch around 3350 and continue to short. The profit range will be around 3330-3320, and the stop loss will be 3360. If the European session is stronger, you can adjust the point before the US session.
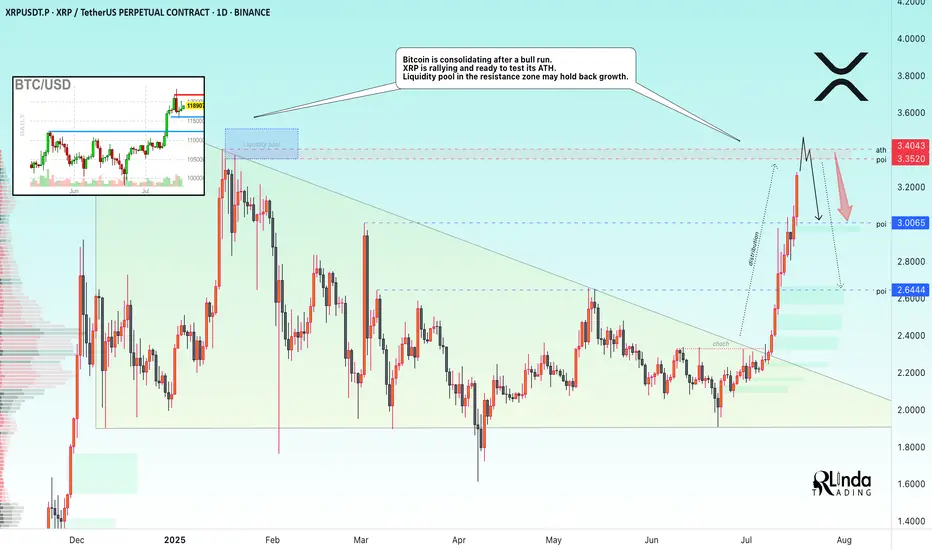
XRP → ATH retest. Reversal or continued growth?BINANCE:XRPUSDT.P is rallying and ready to test the resistance zone - ATH. Against this backdrop, Bitcoin is consolidating after a bull run. The liquidity pool may hold back growth.
Fundamentally, there is excitement across the entire cryptocurrency market. Altcoins are rallying after Bitcoin hit a new high and entered consolidation. The BTC.D index is declining, which generally provides a good opportunity for altcoins to grow. However, the index is approaching technical support, which may affect market sentiment overall...
As for XRP, there is a fairly strong liquidity pool ahead — the ATH resistance zone. The price is in a distribution phase after a change in character and a breakout of the downtrend resistance in the 2.33 zone. The momentum may exhaust its potential to break through the 3.35-3.34 zone, and growth may be halted for correction or reversal (in correlation with Bitcoin's dominance in the market).
Resistance levels: 3.35-3.40
Support levels: 3.0, 2.64
A breakout of resistance without the possibility of further growth, a return of the price below the level (i.e., inside the global flat) will confirm the fact of a false breakout of resistance, which may trigger a correction or even a reversal.
Best regards, R. Linda!
Summary of gold market this week and analysis of next week's mar
Gold closed with an inverted hammer candlestick with a relatively long upper lead this week. Technically, the market is still bearish next week, and the pressure from above is still relatively large. After reaching the highest point of 3438.7 this week, it started a unilateral decline mode, which caught the bulls off guard perfectly. This week, I also emphasized that the 3400 line is not a high point. Gold rose strongly at the beginning of this week, and the market had high expectations for bulls. In the second half of the week, gold fell unilaterally, hitting the bulls hard. This week, it closed at 3336.7, which is another distance from 3400. Next week, we will continue to give the operation ideas of rebound shorting according to the technical analysis. Following the trend is the way to invest. If your current operations are not ideal, I hope I can help you avoid detours in your investment. You are welcome to communicate with me!
From the 4-hour analysis chart, we focus on the short-term suppression of 3370-75 on the top, and focus on the suppression of 3397-3400 on the top. After all, gold fell and broke through here this week, and then fell southward. We focus on the support of 3312-18 on the bottom. On Friday midnight, we gave a long position at 3318-25. Gold rebounded at 3324.9 at midnight. In operation, gold will still be treated as rebound short next week. I will remind you of the specific operation strategy during the trading session, so please pay attention to it in time.
Gold operation strategy:
Short gold rebounds at 3370-75, stop loss at 3387, target 3327-3330, and continue to hold if it breaks;

Stellar (XLM): Bearish CME + Potential Buy Entries | Bullish!Stellar is building up for the major resistance zone near $0.60, which is also our target currently.
We have set 2 entry zones for buy trades, where the upper one will be activated once we form the proper BOS, but due to the fact that we have bearish CME, we also set a second entry in case we go and fill that CME.
Swallow Academy

The DAX Index Is Losing Its Bullish MomentumThe DAX Index Is Losing Its Bullish Momentum
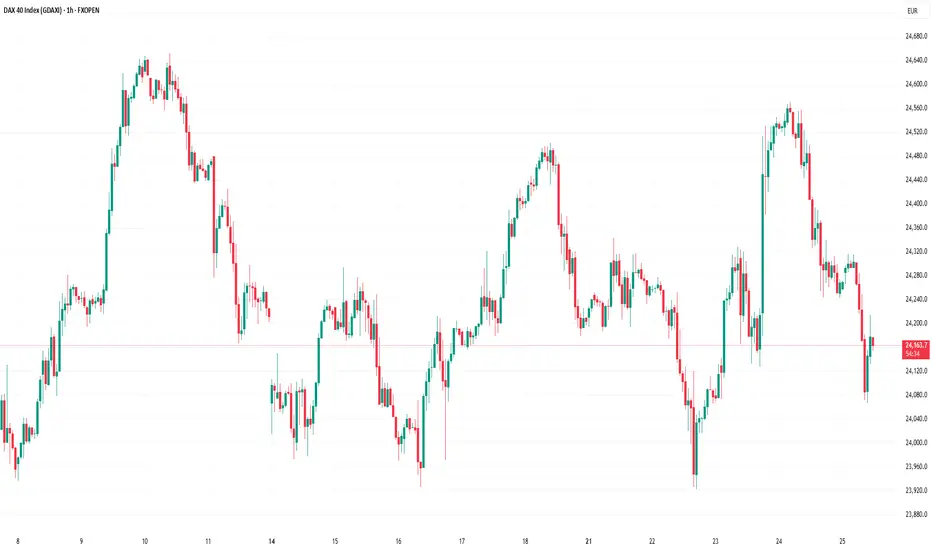
At the end of May, we noted that the German stock index DAX 40 was exhibiting significantly stronger performance compared to other global equity indices. However, we also highlighted the 24,100 level as a strong resistance zone.
Two months have passed, and the chart now suggests that bearish signals are intensifying.
From a technical analysis perspective, the DAX 40 formed an ascending channel in July (outlined in blue). However, each time the bulls attempted to push the price above the 24,460 level (which corresponds to the May high), they encountered resistance.
It is worth noting the nature of the bearish reversals (indicated by arrows) – the price declined sharply, often without intermediate recoveries, signalling strong selling pressure. It is likely that major market participants used the proximity to the all-time high to reduce their long positions.
From a fundamental standpoint, several factors are weighing on the DAX 40:
→ Ongoing uncertainty surrounding the US–EU trade agreement, which has yet to be finalised (with the deadline approaching next week);
→ Corporate news, including disappointing earnings reports from Puma, Volkswagen, and several other German companies.
Given the above, it is reasonable to assume that bearish activity could result in an attempt to break below the lower boundary of the ascending blue channel.
This article represents the opinion of the Companies operating under the FXOpen brand only. It is not to be construed as an offer, solicitation, or recommendation with respect to products and services provided by the Companies operating under the FXOpen brand, nor is it to be considered financial advice.
Gold’s Precision Drop: Wave 5 Ignites the Bullish Reversal
---
### 🚀 **Golden Opportunity Ahead: Wave 5 Bullish Breakout Incoming!**
After perfectly completing the **bearish Gartley pattern**, gold dropped precisely to the **target zone at 3,323**, just as predicted. This move confirmed the formation of **Wave 5**, signaling the end of the corrective phase.
Now, all signs point to a **strong bullish reversal**—and the next step is a powerful rally toward the predefined targets. This is a **prime buying opportunity** for traders looking to ride the wave!
### 🎯 **Buy Zone:**
- **Entry:** Around **3,323 USD**
### 📈 **Profit Targets:**
| Target | Fibonacci Level | Price (USD) |
|--------|------------------|-------------|
| TP1 | 1.0 | 13,447.875 |
| TP2 | 1.27 | 13,536.025 |
| TP3 | 1.618 | 13,649.640 |
The link of. The previous analysis is below in the comment
---


GOLD continues to correct down, good news from trade situationOANDA:XAUUSD has fallen sharply again, currently trading around $3,360/oz, reflecting the easing of global trade tensions, affecting demand for safe-haven assets. The US Dollar and US Treasury yields have also increased, affecting gold prices.
The US Dollar Index ( TVC:DXY ), which tracks the greenback against six other currencies, rose to 97.56.
The yield on the 10-year US Treasury note US10Y rose to 4.386%. The US real yield, calculated by subtracting inflation expectations from nominal interest rates, rose nearly 3.5 basis points to 2.046%.
Markets are increasingly optimistic about such deals after the United States and Japan reached a trade deal, and the European Union could be next. In addition, rising stock markets and low volatility have kept gold's gains in check.
The United States and the European Union are moving toward a potential trade deal that would include a 15% tariff on EU goods and zero tariffs on some items.
The European Commission said Thursday that a negotiated trade solution with the United States is within reach.
“Our focus is on reaching a negotiated outcome with the United States,” a European Commission spokesperson told reporters about the EU-U.S. tariff talks. “We believe that such an outcome is achievable.” The European Commission has repeatedly said that its current priority is to reach a deal with the United States to avoid the 30% tariffs that U.S. President Trump has proposed to impose on EU products starting August 1.
On the economic data front, initial jobless claims in the United States unexpectedly fell last week, suggesting the job market remains solid.
The U.S. Bureau of Labor Statistics reported on Thursday that initial jobless claims fell to 217,000 in the week ended July 19, below expectations of 227,000 and down from 221,000 the previous week.
Technical Outlook Analysis OANDA:XAUUSD
Gold is heading for its third consecutive day of decline since hitting the bullish target level sent to readers in the weekly edition on Sunday at $3,430.
Despite the sharp decline, gold still has enough technical conditions for an uptrend given its current position and structure.
Specifically, gold is still above the EMA21, which is considered the nearest support at the moment. Along with that, the uptrend price channel is the short-term trend. However, for gold to qualify for a short-term bullish cycle, it needs to be confirmed by price action above the 0.236% Fibonacci retracement level, then the target is $3,400 in the short term, more than $3,430.
On the other hand, RSI is still holding above 50, and 50 in this case acts as momentum support. Therefore, gold still has room to rise.
In case gold is sold below EMA21, it may suffer a further decline with the next target around $3,310 in the short term, more than $3,300 and the 0.382% Fibonacci retracement level. And if gold loses the support at the 0.382% Fibonacci level, it will qualify for a bearish cycle.
Intraday, the current position of gold price is still tilted towards the upside, and the notable price points will be listed as follows.
Support: $3,350 – $3,310 – $3,300
Resistance: $3,371 – $3,400 – $3,430
SELL XAUUSD PRICE 3406 - 3404⚡️
↠↠ Stop Loss 3410
→Take Profit 1 3398
↨
→Take Profit 2 3392
BUY XAUUSD PRICE 3329 - 3331⚡️
↠↠ Stop Loss 3326
→Take Profit 1 3337
↨
→Take Profit 2 3343

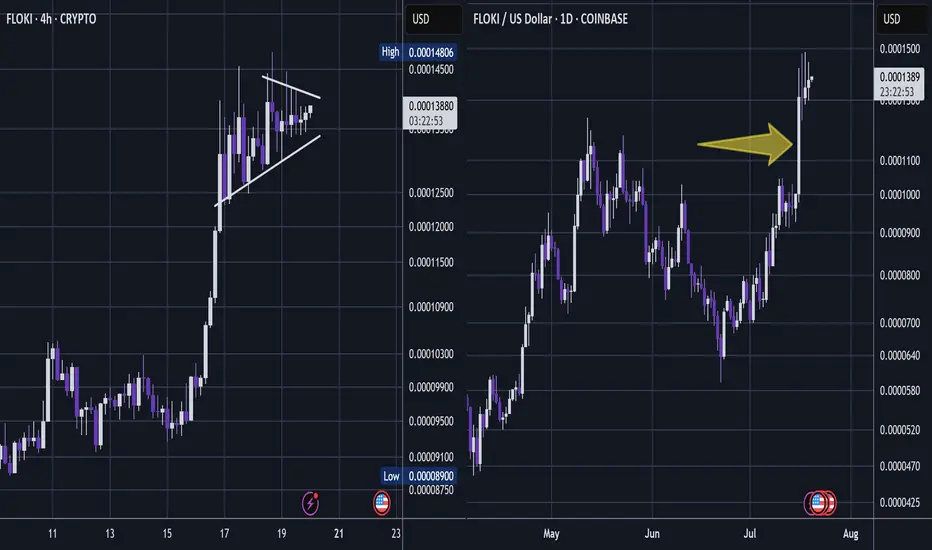
FLOKI - Oki Doki PumpJust one of many coins that I am picking in this area.
But these meme coins can have some pop - and so this is one I share with TradingView.
It had once nice push up (arrow) - signalling it has plenty of bullish potential.
The low time frame is choppy but the candles are both narrowing and shallowing -
I think this may be building pressure for a next wave up.
This analysis is shared for educational purposes only and does not constitute financial advice. Please conduct your own research before making any trading decisions.
BLDE – VolanX Smart Cycle Activation📈 BLDE – VolanX Smart Cycle Activation
Timeframe: Weekly
Posted by: WaverVanir International LLC | VolanX Protocol
Model: Accumulation → Manipulation → Expansion
After multiple Breaks of Structure (BOS) and prolonged markdown, BLDE has now confirmed a Smart Money Accumulation Cycle. A clear manipulation sweep below prior lows has triggered the upside phase. This chart follows the classic SMC model with:
🔹 Accumulation → Trap → Manipulation → Expansion
🔍 Key Observations:
Accumulation zone: $2.00–$4.00
Trap high: ~$5.00 (liquidity run & rejection)
Clean reclaim of $3.92 structure now acting as launchpad
Next zones of interest:
• $6.35
• $6.58
• $6.76
• Ultimate distribution zone: $9.90
📊 VolanX Thesis:
We are entering a Mark-Up Phase consistent with the VolanX Alpha Expansion Model. As liquidity rotates upward, expect a stair-step climb toward the equilibrium zone near $9.90.
🧠 Strategic Insight:
If price pulls back into the $3.92–$4.10 range, that would be considered a high-probability re-entry for bulls aligned with institutional footprints.
🛡️ Risk Lens:
Monitor for early distribution at $6.76. VolanX Guardian Protocol flags rising volume anomalies in that range.

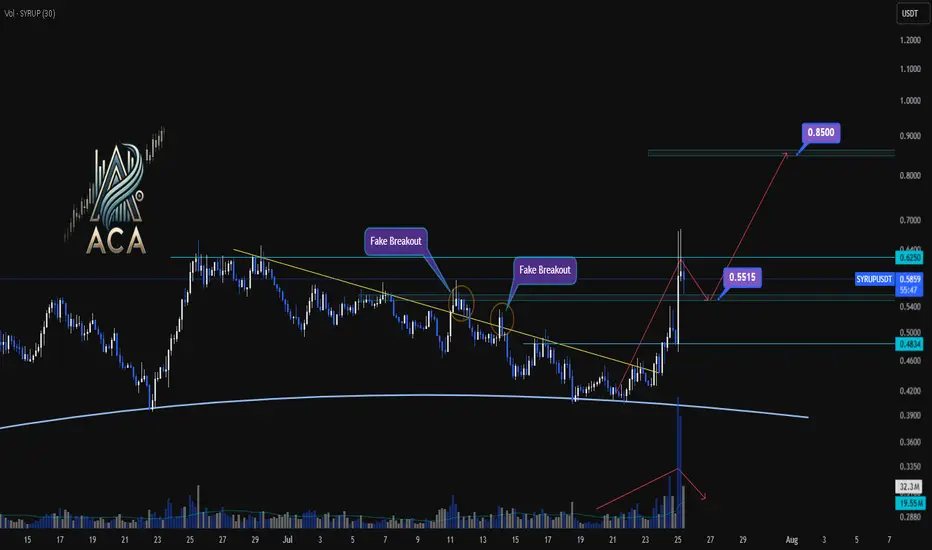
SYRUPUSDT 4H Chart Analysis | Trendline Breakout & Next MovesSYRUPUSDT 4H Chart Analysis | Trendline Breakout & Next Moves
🔍 Let’s break down the latest action on the SYRUP/USDT 4H chart and pinpoint what comes next as trend and momentum cues line up for traders.
⏳ 4-Hour Overview
- The recent breakout above the key trendline was backed by a surge in volume, providing clear momentum confirmation and pushing price toward resistance.
- Price has already reached 1.5R of the initial breakout target, a strong sign the trend is in motion.
- Upon touching the $0.6250 resistance, momentum cooled, with volatility decreasing — a classic consolidation phase after a high-energy move.
🔻 Correction & Structure
- With volume subsiding and momentum slowing post-$0.6250, we’re now expecting a corrective move down toward $0.5515.
- This retracement zone will be critical to watch for higher low formation – a bullish structural signal if supported by volume confirmation.
🔺 Long Setup:
- Should SYRUP reclaim and break above $0.6250 after setting a higher low at $0.5515, and with renewed volume, we could see another strong leg higher.
- The next major resistance sits around $0.85 — this aligns as a logical upside target based on the range extension.
📊 Key Highlights:
- Trendline breakout with sharp volume spike = momentum confirmation.
- 1.5R reached before first deep pullback; structure remains bullish above $0.5515.
- Watch for a higher low and subsequent break of $0.6250 with volume to confirm the next move to $0.85.
🚨 Conclusion:
SYRUP’s chart is at a pivotal juncture: a constructive pullback to $0.5515 could set up the next wave higher if supported by volume. A confirmed breakout above $0.6250 targets $0.85 — stay patient and wait for volume signals at key levels.
2025 BTC.D to %44 then retrace to %56 - 2026 real Altseasonthe drop in bitcoin dominance from now till end on August to %44 will send some Alts 5 to 10 X then all the market will dump till the end of the year and the dump will be brutal
Brutal means : bitcoin down %65 and altcoins %90 from the upcoming August mini Altseason run. which actually Alts prices will be cheaper than now ( today )
eventually BTC.D going down to %20
Not a financial advice

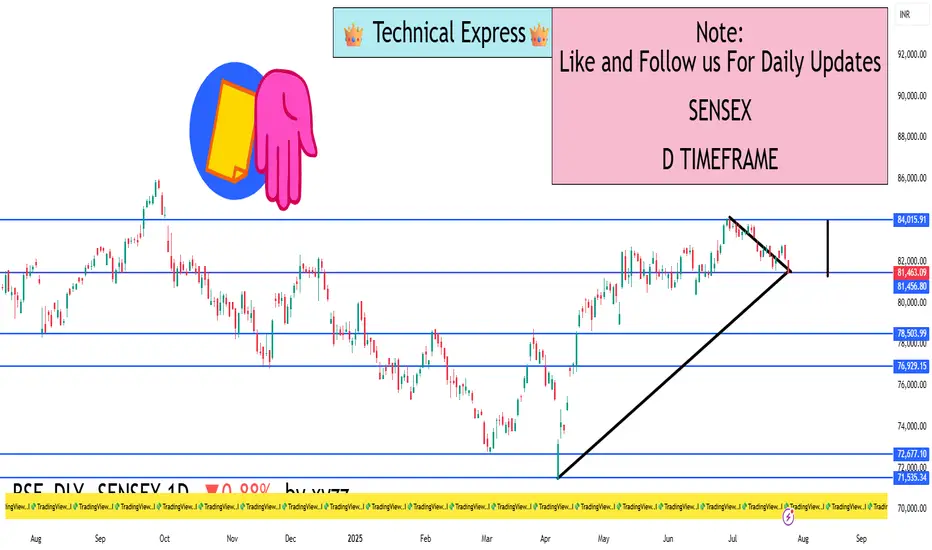
SENSEX 1D Timeframe📉 SENSEX Daily Overview (as of July 25, 2025)
Current Price: Around 81,460
Daily Change: Down by approximately 720 points (–0.9%)
Day’s High: About 82,070
Day’s Low: About 81,400
Previous Close: Around 82,184
📊 1-Day Candlestick Analysis
The candle for today is bearish, indicating strong selling pressure.
The price opened near previous levels but faced resistance at around 82,000.
Sellers dominated most of the day, pushing the index toward the 81,400 support zone.
🔍 Key Support and Resistance Levels
Level Type Price Range
Resistance 82,000 – 82,200
Support 81,400 – 81,000
If Sensex breaks below 81,400, the next target could be around 80,500 or 79,900.
If it holds above support and bounces, it could retest 82,200.
🧠 Technical Trend Analysis
Short-Term Trend: Bearish
Medium-Term Trend: Neutral to mildly bullish (as long as above 80,000)
Market Structure: Lower highs forming, suggesting pressure building on bulls
Indicators (assumed):
RSI may be approaching oversold
MACD likely showing bearish crossover
Volume increasing on red candles—indicating strong sell interest
📌 Sentiment & Market Context
Financial stocks (like banking, NBFCs) are under pressure.
Global cues (such as interest rate uncertainty and geopolitical concerns) are impacting investor confidence.
FII outflows and weak earnings in key sectors are adding to bearish momentum.
The broader trend remains range-bound, but with short-term downside bias.
✅ Strategy Suggestions (For Traders & Investors)
Swing Traders: Wait for a reversal candle (like a bullish engulfing or hammer) before considering long positions.
Breakout Traders: Watch for breakdown below 81,000 for continuation of the fall.
Positional Traders: Can wait to enter near 80,000–79,500 if the market holds that key level.
🔄 Summary
SENSEX is under pressure with a drop of 720+ points.
Technical structure suggests caution, especially if 81,000 breaks.
Support: 81,000 – 80,500
Resistance: 82,000 – 82,200

BANK NIFTY S/R for 28/7/25Support and Resistance Levels:
Support Levels: These are price points (green line/shade) where a downward trend may be halted due to a concentration of buying interest. Imagine them as a safety net where buyers step in, preventing further decline.
Resistance Levels: Conversely, resistance levels (red line/shade) are where upward trends might stall due to increased selling interest. They act like a ceiling where sellers come in to push prices down.
Breakouts:
Bullish Breakout: When the price moves above resistance, it often indicates strong buying interest and the potential for a continued uptrend. Traders may view this as a signal to buy or hold.
Bearish Breakout: When the price falls below support, it can signal strong selling interest and the potential for a continued downtrend. Traders might see this as a cue to sell or avoid buying.
MA Ribbon (EMA 20, EMA 50, EMA 100, EMA 200) :
Above EMA: If the stock price is above the EMA, it suggests a potential uptrend or bullish momentum.
Below EMA: If the stock price is below the EMA, it indicates a potential downtrend or bearish momentum.
Trendline: A trendline is a straight line drawn on a chart to represent the general direction of a data point set.
Uptrend Line: Drawn by connecting the lows in an upward trend. Indicates that the price is moving higher over time. Acts as a support level, where prices tend to bounce upward.
Downtrend Line: Drawn by connecting the highs in a downward trend. Indicates that the price is moving lower over time. It acts as a resistance level, where prices tend to drop.
Disclaimer:
I am not SEBI registered. The information provided here is for learning purposes only and should not be interpreted as financial advice. Consider the broader market context and consult with a qualified financial advisor before making investment decisions.

Dogecoin Wave Analysis – 25 July 2025
- Dogecoin reversed from resistance zone
- Likely to fall to support level 0.2000
Dogecoin cryptocurrency recently reversed down from the resistance zone between the key resistance level 0.2630 (former monthly low from December, acting as the resistance now), standing near the upper daily Bollinger Band.
This resistance zone wad further strengthened by the 38.2% Fibonacci correction of the previous sharp downward impulse from December.
Given the clear daily downtrend, Dogecoin cryptocurrency can be expected to fall to the next round support level 0.2000 (target price for the completion of the active correction ii).

DOGE : Idea.Hello, good ? Good.
Enter in doge here is not a bad idea in SPOT.
• Above the last important resistance.
• Retest on 50 Weekly MA.
• Above 50 rsi weekly.
• Bollinger bands in consolidation.
Need to confirm rejection in weekly like always.
If rejectyion here : x2 incoming.
Good luck guys, take care of you.

Daily Time frame Structure setAs you can see gold is moving in a channel in daily time frame so according to me next move will be till protected order block i.e 3382-3388 and after that big fall expected and if any candle close above 3384 then 3451 is the next target for gold.
ENS.usd eyes on $29.32: Golden Genesis fib stalling a BIG break?ENS surging along with Ethereum, as expectable.
Now up against a Godlen Genesis fib at $29.32
Look for a Break-n-Retest to signal a break out.

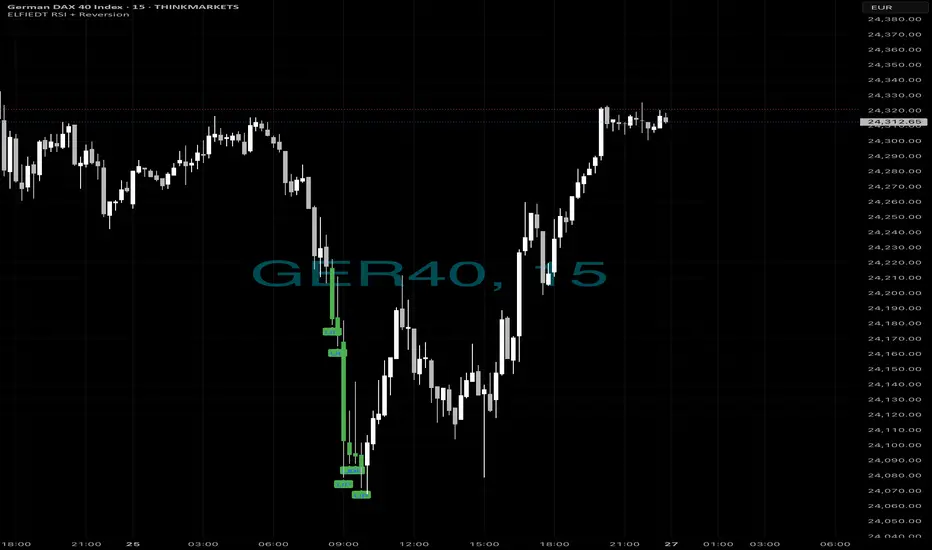
Same as always….📈 The Market Crashed. We Bought the Bottom. Again. 💥
Just another 15-minute chart… or is it?
While panic hit the DAX this morning, ELFIEDT RSI + Reversion was calmly printing BUY after BUY at the dead low. No guessing. No hype. Just precision.
✅ 5 Buy signals within minutes
✅ Picture-perfect mean reversion
✅ Price soared right after
✅ ZERO lag. ZERO repaint.
If you missed this move, don’t worry — this is what my system does.
🧠 Want to learn the logic behind this?
💰 Want to use it live on your own charts?
👉 Drop a 🔥 below if you want access.
👉 DM me “ELFIEDT” to test it out.
👉 Follow for real, repeatable setups.
“Buy the rumor, sell the news”
---
### 🎯 **“Buy the Rumor, Sell the News” – A Trader’s Mind Game**
Imagine you’re not just following the market… you’re dancing ahead of it. This strategy flips traditional thinking on its head—and rewards those bold enough to act **before** the spotlight hits.
---
### 🕵️♂️ **Step One: Buy the Rumor**
- Traders catch whispers—like talk of a potential interest rate hike.
- The markets start to react *before* anything official is announced.
- Assets like gold might drop on the expectation alone… that’s your **entry point**.
You're not buying certainty. You're buying what the crowd *thinks* will happen.
---
### 🔊 **Step Two: Sell the News**
- Once the news breaks, it's already "old" to seasoned traders.
- That shocking headline? Already priced in.
- The market might reverse or surge unpredictably.
- This is when savvy traders exit, locking in profits from those who just arrived.
---
### 🧠 **Why It Works**
- Financial markets aren’t just driven by facts—they’re powered by **sentiment** and **anticipation**.
- By the time news goes public, smart money has already moved.
It’s like buying concert tickets before the band announces a tour—then selling them the moment fans go wild.
---
### 📉 **A Real Example**
- **Monday Rumor**: “The Fed will raise interest rates.”
- Gold begins to slide as traders prepare—this is your chance to act.
- **Thursday News**: The hike is confirmed.
- Instead of dropping further, gold might **rise** due to market overreaction or repositioning.
- You **sell** into that chaos—profit made.
---

