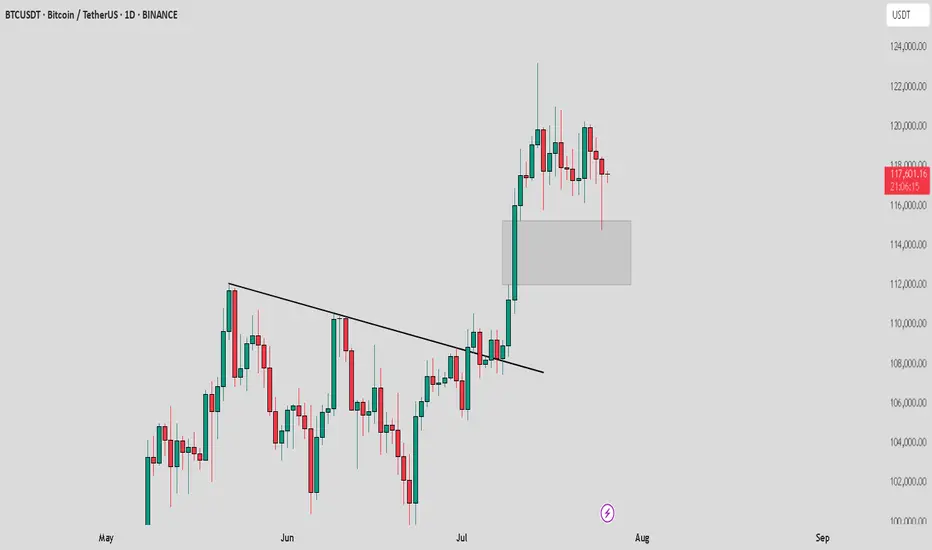
BTC /USDT : Getting support from FVG BTC Support from FVG - Bullish & Bearish Scenarios:
Bullish Scenario:
BTC is holding support from the FVG. As long as BTC stays above this zone, the market remains bullish. A bounce here could lead to further upside.
Bearish Scenario:
If BTC breaks below the FVG, it signals a potential downtrend. A breakdown may lead to more pain and further declines in the market.
Tips:
1. Wait for Confirmation: Look for a clear candle close above/below FVG for validation.
2. Risk Management: Set stops near the FVG to manage potential losses.
3. Monitor Volume: Strong volume during support retests increases bullish potential.
4. Stay Flexible: Be prepared for a market shift if BTC breaks the FVG support.
Community ideas
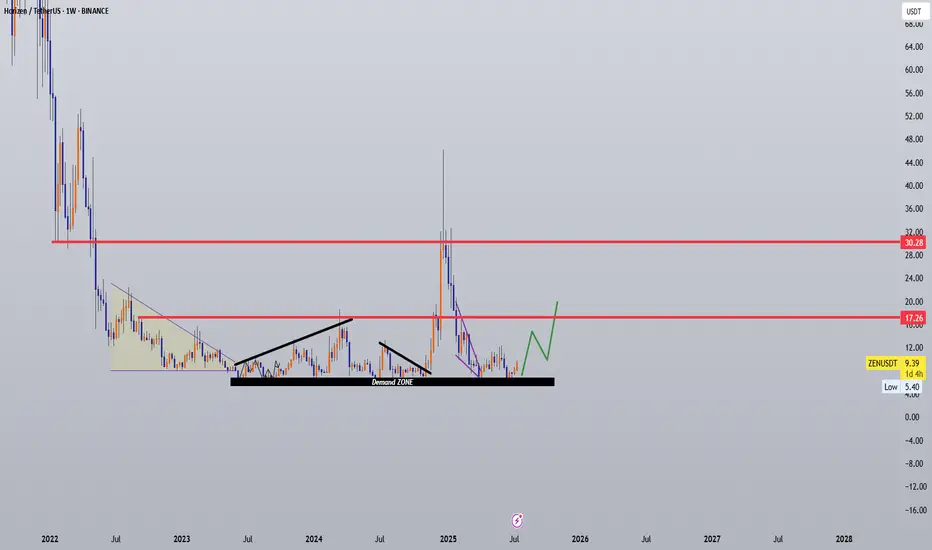
ZENUSDT Accumulation – Undervalued zk L1 with 5x–8x Potential?📌 Coin: ZEN (Horizen)
💰 Buy Levels:
✅ First Entry: $9.30
✅ Second Entry: $7.50
🛑 Panic / SL Level: Weekly close below $6.00
🧠 Fundamental Analysis (FA) – In Short
*️⃣ Sector: Layer 1 / Privacy Infrastructure / Sidechains
*️⃣ Use Case: Horizen is a privacy-preserving, scalable blockchain ecosystem focused on custom sidechains and cross-chain interoperability for real-world enterprise solutions.
*️⃣ Tech: Utilizes zero-knowledge proofs (zk-SNARKs) for privacy and supports sidechains via Zendoo, its proprietary SDK.
*️⃣ Unique Angle: Aims to let developers deploy fully customizable blockchains with privacy by default — a hybrid between Cosmos modularity and Zcash privacy.
*️⃣ Staking / Earning: ZEN offers passive rewards through node operation, including secure nodes and super nodes.
*️⃣ Enterprise Focus: Partners with companies building secure, private, and compliant solutions — positioning itself for regulated environments.
📊 Tokenomics & Market Data
(As of mid-July 2025)
🪙 Current Price: ~$9.39
🧾 Market Cap: ~$120M
🔢 Rank: ~#280–300
🧮 Circulating Supply: ~14.8M ZEN
🔒 Max Supply: 21M ZEN (like BTC)
💰 Inflation Model: Halving every 4 years (next: ~2026)
🛠️ Reward Sharing: 20% of block rewards go to treasury, rest split between miners and node operators
🎯 Bull Market Target (Realistic)
Target Range: $18 – $24
*️⃣ Reflects previous range tops and resurgence in interest toward privacy-focused ecosystems and sovereign rollups.
🚀 Mega Bullish Target (Speculative Top)
Target Range: $38 – $60+
*️⃣ Requires a full privacy narrative comeback, zk adoption surge, or enterprise-level announcement using Zendoo sidechains.
✅ Final Take
🧠 ZEN is one of the few chains combining scalable sidechains with zk privacy and enterprise tooling.
we ask Allah reconcile and repay
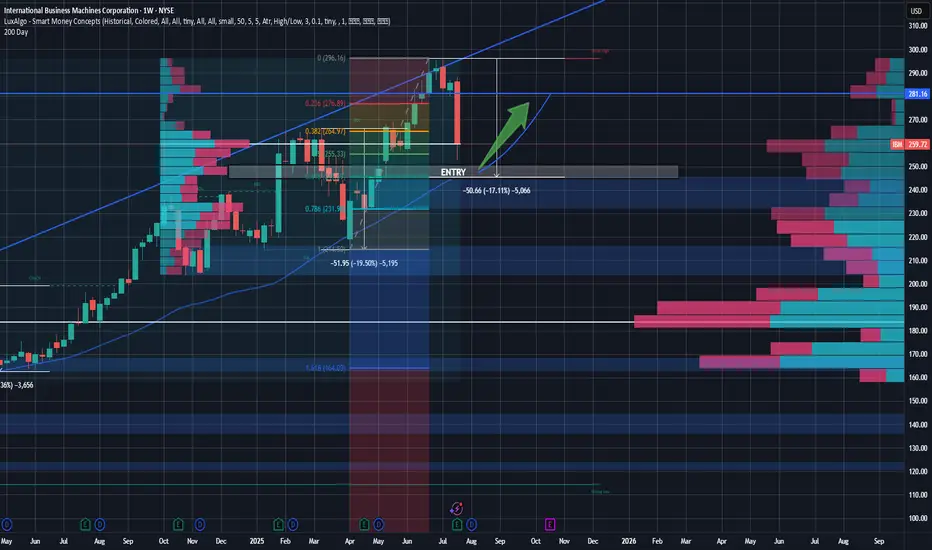
IBM Rebound Trade - Buying the Pullback at Key ConfluenceSetup:
IBM is setting up for a potential high-conviction long entry around the $245 level, a price zone marked by multiple layers of technical confluence and volume-based support. Over the last 18 months, IBM has seen two notable pullbacks—both in the 17–20% range, often around earnings events. The current drawdown is consistent with this historical behavior and may represent an opportunity rather than a breakdown.
Technicals & Indicators
Volume Profile Support:
Using a volume profile anchored from January 2024, a clear volume shelf exists between $245 and $265.
A second profile anchored 10 months ago confirms heavy volume at $260 and $245, indicating high institutional activity and potential support zones.
200-Day Moving Average:
IBM has consistently respected its 200-day MA over the past two years. The MA is now converging at $245, adding dynamic trendline support.
Fibonacci Retracement:
Applying retracements from the April 2025 lows to the recent ~ $300 highs, the $245 level aligns with the 61.8% Fibonacci level, a key zone for potential reversals.
GAP Fill:
Looking for the recent earnings gap to close within the next 2 months, as we see new opportunities for tech companies and rising demand. This overreaction created a gap that should be filled as investors digest the macro strength and re-enter long positions in IBM. Gap close ~ $280 level.
Candles & Buying Pressure:
Recent daily volume after earnings suggests strong buying pressure with a hammer/doji candle forming on the day after earnings. Investors are already buying back into this name.
Fundamentals & Business Operations:
Despite the post-earnings dip, IBM continues to display strong business fundamentals:
Free Cash Flow (TTM): ~$12.3B, supporting dividends and future investment.
FCF Margin: 19.1%
Gross Margin: ~58% | Operating Margin: ~ 17%
Forward P/E: ~22.45x | EV/EBITDA: ~19.85x
Dividend Yield: 2.6%
These metrics reflect operational efficiency, cash generation, and relative undervaluation compared to peers—especially given IBM’s AI and hybrid cloud positioning that remains strong. With margins that continue to be at the top of the industry, IBM also has the resources to execute on the tremendous opportunities arising in the tech world.
Macro & Industry Context:
We’re in the early stages of a long-term AI and data center growth cycle, and IBM, while not the most popular AI name, is deeply embedded in enterprise infrastructure, consulting, and mainframe compute. Their recent earnings beat didn’t change that narrative. Investor sentiment overreacted, giving patient traders a potential entry on weakness. Analysts still hold a buy on this name with price targets well above $270. This isn't a one-day trade, but in a few weeks, let's see where the market is at.
Price Targets & Risk/Reward:
Entry Zone: $245 (watch for confirmation & strength)
Target 1: $280 (resistance level with high volume in the range)
Optional Long-Term Hold: If the broader AI trend continues, IBM could break all-time highs and trend above $300 over time.
Strategy & Patience:
This is not a chase setup. I will wait for $245 to be reached and confirmed—a level backed by technical support, volume profile, and long-term valuation logic. If IBM holds and reverses with strength, this could be a strong swing trade or even a long-term position for investors who want value with AI exposure. I will be looking for a confirmation(maybe a candle pattern) before entering the trade, but if it gets there, I see good potential for a bounce.
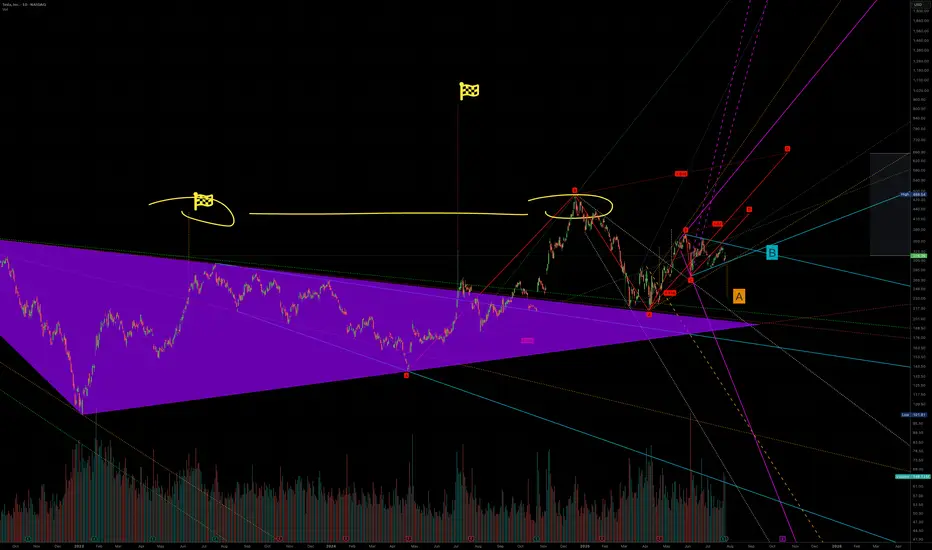
A to 236 or B killing A to 420Tesla is one of those stocks that is heavily manipulated algorithmically. When we were in an uptrend and needed a little push, a large fractal was created that could break a previously formed structure which should have taken us to $236(A). Interestingly, a very strong symmetrical triangle has emerged, influencing this upward movement, and the final price—due to some mystical reason—seems to be $420(B). It’s also worth noting that this whole move is being influenced by another similar structure whose target is above $600. So, if we analyze everything that’s happening, a 12% drop in sales means nothing compared to what Tesla will gain from robots, restaurants, and robotaxis, which I call RRR
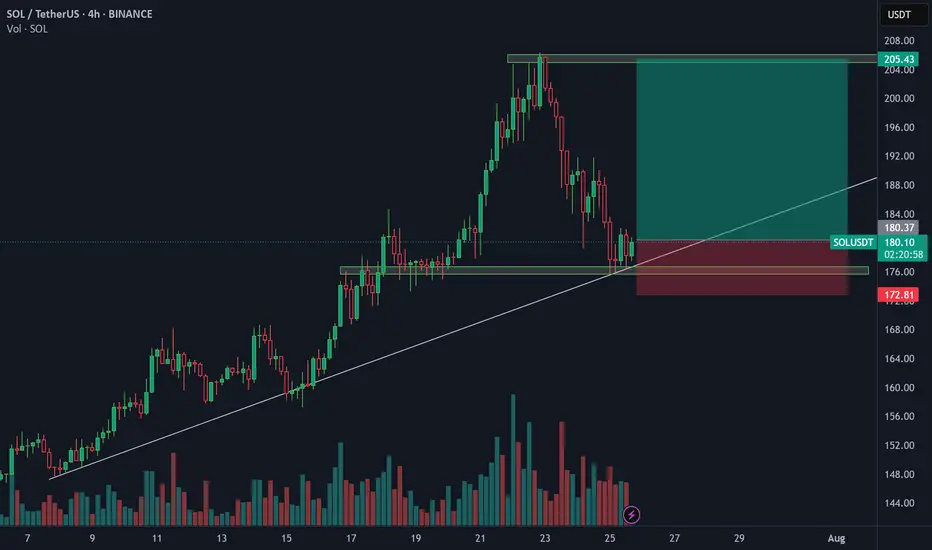
SOL LONGSolana is bouncing off the support level and the ascending trendline. Bullish movement is expected to continue and reach $205
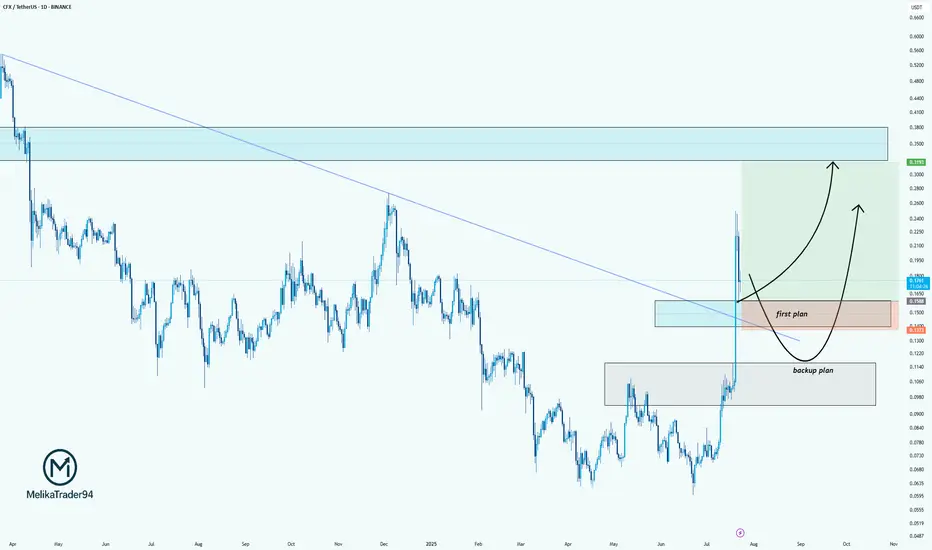
CFX/USDT: Two-Plan Strategy for the Next MoveHello guys.
CFX just broke out of a long-term downtrend line, showing strong bullish momentum. After this sharp impulse, we're now patiently watching for the pullback zone.
Here’s my plan:
✔ First plan: Looking for a reaction around the breakout retest zone (0.1500–0.1300). This is the ideal area for a bullish continuation if buyers step in early.
✔ Backup plan: If the price drops deeper, the second demand zone (around 0.1060–0.0950) is where we’d expect stronger buyer defense.
Potential upside target: 0.31+, where price previously showed strong selling pressure.
USDCAD SELLUSD/CAD rallies to 1.3680 as the market focuses on a hawkish Fed
The US Dollar extends its recovery for the second consecutive day, supported by strong US data. Upbeat US business activity and Jobless Claims support the Fed's "wait and see" rhetoric. In Canada, the weak Retail Sales data keep hopes for a BoC rate cut alive.
The year will be politically marked by Trump’s return to the White House. A Republican government is seen as positive for financial markets, but Trump’s pledge to cut taxes and impose tariffs on foreign goods and services may introduce uncertainty to both the political and economic landscape.
Canada’s political crisis peaked in late 2024 with a no-confidence vote against Prime Minister Justin Trudeau, leading to snap elections and a weakened Liberal minority government. Policy uncertainty and economic challenges dominate 2025’s outlook, raising concerns over market stability and investor confidence.
The BoC is set to continue easing interest rates through 2025, at least at a faster pace than the Fed is expected to, which could apply pressure on CAD’s already-rising rate differential.
SUPPORT 1.36991
SUPPORT 1.36739
SUPPORT 1.36495
RESISTANCE 1.37346
RESISTANCE 1.37455

EURUSD--LONG-- 26-07-25--2 weeks before tested end bounced from monthly support level 1.15652
--last week was a rising week.
--upward movement will likely to continue this week too.
--best enrty level is around 1.17096

XAUUSD 4H Technical Outlook The current market structure on the 4H timeframe shows a clear sweep of a liquidity pool near the recent highs (~3,348), followed by a strong bearish reaction. Price action suggests a short-term shift in momentum toward downside targets.
🔻 Bearish Scenario
After liquidity was grabbed above the recent highs (highlighted in the orange circle), price rejected sharply. The next critical level lies at the Bullish OB (LTF) around the 3,325–3,337 zone. A break below this could lead to a deeper retracement into the Fair Value Gap (FVG) and demand zone at 3,150–3,244.
📍 Key Levels:
Resistance: 3,347 – 3,439
Support: 3,244 – 3,150 (watch for reaction in the FVG zone)
Intermediate target: 3,244.41 (Low)
🟢 Bullish Case
If price finds support at the OB and respects the ascending trendline, we could see a reversal back to re-test the upper resistance near 3,438.
📈 Bias: Bearish until price confirms support above 3,337 and reclaims liquidity zone.
🔔 Watch for:
Price reaction at OB (3,325–3,337)
Break and close below 3,244 could accelerate selling
Potential long setup from FVG with bullish confirmation

XAUUSD--SHORT--second shoulder of "head and shoulder" pattern is about to form.
--next week, pullback to near to crossection point o two orange line, between levels 3369 and 3355
--then downward movement to the level 3283

NYA Hourly 5th of the 5th If the Bull market is to advance we can NOT drop below .382 of the rally from 4/7 2025 Were I said 4835 was wave 4 in Super cycle .it is this simple Which is the 200 day avg BTW !!!!!!!best of trades WAVETIMER

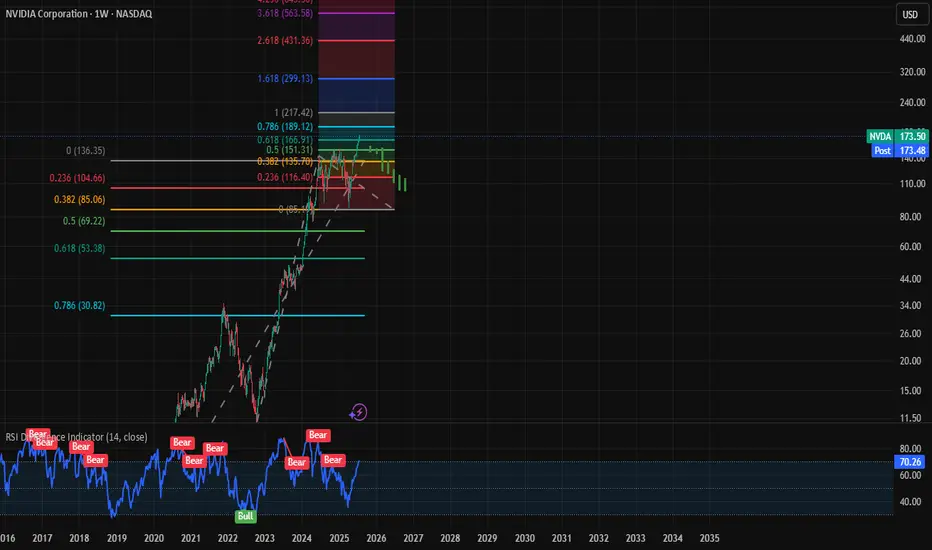
envidia drops from 173.50 to 130 ish or less to 104.00technical prediction based on the volumes pattern when sellers position themselves before the giant crash
EURUSD BUYTapped into an orderblock on the 4hr time frame, so i scaled down to the 30mins to look for a buy entry
Entry : 1.17172
TP : 1.17891
SL : 1.17001

going lower or bouncing on resistance? market is respecting key support/resistance or channel boundaries. These points often become decision zones where big moves occur.
Signs this could be a fakeout:
BTC wicks above a resistance or below a support with little follow-through
Volume spikes only on the wick, then dies quickly
Price reverses back into the range soon after breaking it
If BTC recently broke a trendline with low volume, it smells like a trap move — a liquidity grab.
If it’s testing support again after failing to rally, and volume is increasing on red candles, a leg down is possible.
However, macro trend is still up unless we lose a major higher low (say, sub-$60k or sub-$56k depending on your chart).

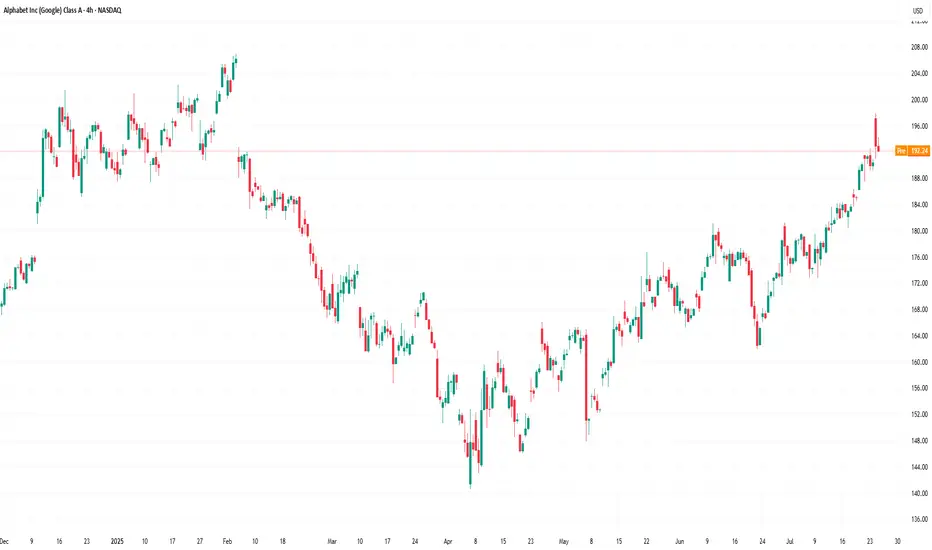
Alphabet (GOOGL) Stock Chart Analysis Following Earnings ReleaseAlphabet (GOOGL) Stock Chart Analysis Following Earnings Release
Earlier this week, we highlighted the prevailing bullish sentiment in the market ahead of Alphabet’s (GOOGL) earnings report, noting that:
→ an ascending channel had formed;
→ the psychological resistance level at $200 was of particular importance.
The earnings release confirmed the market’s optimism, as the company reported better-than-expected profits, driven by strong performance in both its advertising and cloud segments.
In his statement, CEO Sundar Pichai noted that AI is positively impacting all areas of the business, delivering strong momentum.
The company is expected to allocate $75 billion this year to expand its AI capabilities.
As a result, Alphabet (GOOGL) opened yesterday’s trading session with a bullish gap (as indicated by the arrow). However, as the session progressed, the price declined significantly, fully closing the gap.
This suggests that:
→ the bulls failed to consolidate their gains, allowing the bears to seize the initiative;
→ the ascending channel remains valid, with yesterday’s peak testing its upper boundary;
→ such price action near the $200 level reinforces expectations that this psychological mark will continue to act as resistance.
It is possible that the positive sentiment following the earnings report may weaken in the near term. Accordingly, traders may consider a scenario in which Alphabet’s (GOOGL) share price retraces deeper into the existing ascending channel. In this case, the former resistance levels at $180 and $184 may serve as a support zone.
This article represents the opinion of the Companies operating under the FXOpen brand only. It is not to be construed as an offer, solicitation, or recommendation with respect to products and services provided by the Companies operating under the FXOpen brand, nor is it to be considered financial advice.
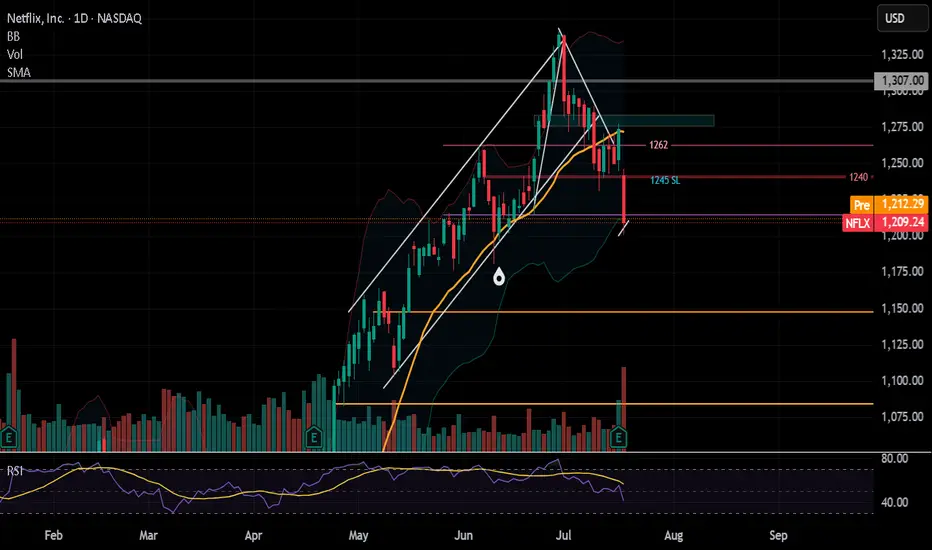
NFLX weak... gapping up to head back downWatching Monday... looking for continuation to downside. This week into next week. 1245 zone is where the post earnings gap down and go started. Using this as my stop loss.
Targets 1200 down to 1180.
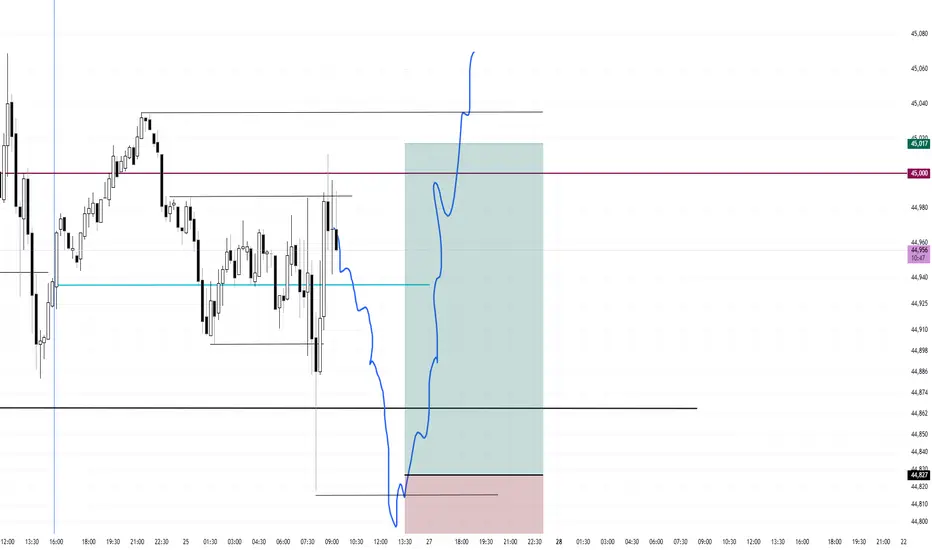
Range Bound Low of Day Buy (If Presented)Price is mean reverting around 45,000 and also mean reverting around today's open. I will be waiting for a mean reversion play under the low of day targeting the high of day.
I will be waiting for a small entry candle, a small doji. I did not take this first run up because the entry vs stop would have been too large. I believe the first mouse in will get dunked on.
Once entered, I will use a 75 tick stop and a 190 tick target for a 2.5 to 1
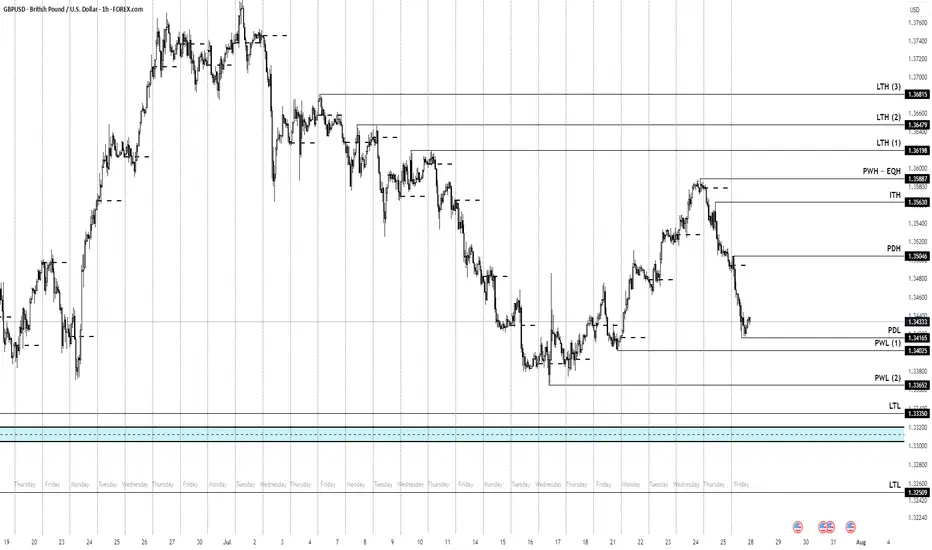
Cable Price Points to keep track off going into NFP/FOMC weekHeading into NFP week we have mixed bias.
Daily sais : BEARISH
Weekly is BULLISH (specially that we closed respecting a +FVG)
Ofc, being an NFP week we trade with care.
Nevertheless i highlighted some key Highs and Lows to keep track of.
"XAG/USD: Pirate’s Treasure Trade! Bullish & Loaded"🚨 SILVER HEIST ALERT! 🚨 XAG/USD Bullish Raid Plan (Thief Trading Style) 💰🎯
🌟 Attention Market Pirates & Profit Raiders! 🌟
🔥 Thief Trading Strategy Activated! 🔥
📌 Mission Brief:
Based on our elite Thief Trading analysis (technical + fundamental heist intel), we’re plotting a bullish robbery on XAG/USD ("The Silver Market"). Our goal? Loot profits near the high-risk resistance zone before the "Police Barricade" (bear traps & reversals) kicks in!
🚨 Trade Setup (Day/Swing Heist Plan):
Entry (📈): "The vault is open! Swipe bullish loot at any price!"
Pro Tip: Use buy limits near 15M/30M swing lows for safer pullback entries.
Advanced Thief Move: Layer multiple DCA limit orders for maximum stealth.
Stop Loss (🛑): 36.900 (Nearest 1H candle body swing low). Adjust based on your risk tolerance & lot size!
Target (🎯): 39.500 (or escape early if the market turns risky!).
⚡ Scalper’s Quick Loot Guide:
Only scalp LONG!
Rich thieves? Go all-in! Broke thieves? Join swing traders & execute the plan slowly.
Use trailing SL to lock profits & escape safely!
💎 Why Silver? (Fundamental Heist Intel)
✅ Bullish momentum in play!
✅ Macro trends, COT data, & intermarket signals favor upside!
✅ News-driven volatility? Expect big moves!
⚠️ WARNING: Market Cops (News Events) Ahead!
Avoid new trades during high-impact news!
Trailing stops = Your best escape tool!
💥 BOOST THIS HEIST!
👉 Hit LIKE & FOLLOW to strengthen our robbery squad! More lucrative heists coming soon! 🚀💰
🎯 Final Note: This is NOT financial advice—just a thief’s masterplan! Adjust based on your risk & strategy!
🔥 Ready to Raid? Let’s STEAL Some Profits! 🏴☠️💸
👇 Drop a comment & boost the plan! 👇
#XAGUSD #SilverHeist #ThiefTrading #ProfitPirates #TradingViewAlerts
(🔔 Stay tuned for the next heist!) 🚀🤫

NZD/USD "KIWI HEIST" – BEARISH BANK ROBBERY!🦹♂️ NZD/USD "THE KIWI HEIST" – BEARISH BANK ROBBERY PLAN! 🚨💰
(Thief Trading Style – Short Entry Strategy for Maximum Loot!)
🎯 MASTER TRADING HEIST BLUEPRINT
🔥 Thief’s Technical & Fundamental Analysis Confirms:
NZD/USD is OVERBOUGHT + TREND REVERSAL!
Police (Bulls) set a TRAP near the Red Zone (Support) – Time to ESCAPE with profits before they catch us!
✔ Entry Point (Bearish Loot Grab):
*"The vault is UNLOCKED! Swipe SHORT anywhere – but for SAFER HEIST, use Sell Limit orders (15m/30m pullbacks). Pro Thieves use DCA/Layering for max gains!"*
✔ Stop Loss (Escape Route):
"SL at nearest 4H Swing High (0.60400). Adjust based on YOUR risk tolerance & loot size!"
✔ Target 🎯 (Profit Escape):
0.58900 (or exit earlier if cops (bulls) show up!)
⚠️ THIEF’S WARNING – NEWS & RISK MANAGEMENT
📢 High-Impact News = VOLATILITY TRAP!
Avoid new trades during news releases.
Trailing SL = Lock profits & evade market cops!
💥 SCALPERS & SWING THIEVES – QUICK NOTES:
Scalpers: Only quick LONG scalp plays (use Trailing SL!).
Swing Thieves: Hold for the BIG BEARISH LOOT! 🏦
📉 WHY NZD/USD IS BEARISH? (Thief’s Intel Report)
Overbought + Trend Reversal Signals!
Bulls (Police) losing strength at Resistance!
For FULL Intel (Fundamentals, COT Report, Sentiment, etc.) – Klickk 🔗!
🚀 BOOST THIS HEIST! (Like & Share for More Loot Plans!)
💖 "Hit 👍 BOOST to strengthen our THIEF SQUAD! More heists = More profits!"
📌 DISCLAIMER (Stay Safe, Thieves!):
This is NOT financial advice. Trade at your own risk & manage positions wisely!
🤑 NEXT HEIST COMING SOON… STAY TUNED! 🎭

HK50 Index Robbery Plan – Bulls in Control, Load Up🚨💸💥**HK50 MONEY HEIST ALERT – Thief Trading Style Entry Plan!**💥💸🚨
"Swipe the Trend, Rob the Risk – The Hong Kong Vault is Open!"
🌍🌎Hey there, Global Money Movers, Heist Planners & Market Robbers!🕵️♂️💰
Welcome to another high-stakes operation brought to you by the Thief Trading Style – where strategy meets chaos, and profits are earned with precision. 🏴☠️📊
🎯 Mission Brief: HK50 Index Robbery – Long Entry Blueprint
Based on our exclusive blend of technical & fundamental analysis, the HK50 (Hong Kong Index) is entering the Loot Zone – bullish bias detected and price action confirming a strategic long opportunity. Here's how we execute the plan:
🔓 ENTRY – The Vault is Open!
🎯 Strike anywhere near recent swing lows/highs on the 15m or 30m timeframe.
💡 Ideal Entry Zones: Closest bullish structure or reversal support.
📌 Tip: Set alerts at key reaction zones – timing is the true thief’s edge.
🛑 STOP LOSS – Escape Hatch Point
🛡️ SL placed below nearest swing low on the 4H timeframe (~23640.0).
💡 Adjust based on your risk tolerance, lot size, and trade stacking.
🏁 TARGET – The Getaway Route
🎯 TP zone: ~25200.0
🚀 Optional: Use Trailing SL to maximize robbery exit on spikes or trap fails.
💬 “Escape before target” if market sentiment flips or volatility surges.
🧲 Scalper Alert: Ride the Bull Only!
💵 Scalping allowed on buy side only.
If you’ve got capital power – go direct. Otherwise, join the swing thieves and ride with momentum. 📈💣
🧠 Why Bullish? | Heist Justification
📊 Current momentum supported by:
🔎 Technical Trend Reversal Patterns
📉 ATR exhaustion near previous downside levels
📰 Positive Macro, Global Cues, & Institutional Sentiment
👉 For the full scoop – combine this with:
📰 COT Data & Market Sentiment
🌐 Intermarket & Geopolitical Outlook
📈 Index-Specific & Seasonal Cycle Studies
Stay ahead, rob smart! 💼💼
⚠️ Risk & News Alert – Don’t Get Caught!
🔔 Avoid entries during major news drops!
✅ Use trailing stop-losses on running trades.
🚷 Protect your loot at all costs – market volatility is the real SWAT team! 🚓
💥Support Our Robbery Crew!
📢 Smash the Boost Button 💣💥 to support the Thief Trading Style revolution!
Together, we rob with discipline, plan with clarity, and exit with satisfaction.
💰Let’s stack profits, not just candles. 📈🤑
📝 Disclaimer:
This is a high-level market outlook, not financial advice. Adjust based on your capital, risk tolerance, and analysis. Always monitor your trades and adapt to the ever-changing market landscape.
Follow for more Heist Plans – this is just the beginning! 🕶️🔐
**See you at the next vault…**🚁💼📈
#ThiefTrading #HK50 #MarketHeist #IndexAnalysis #BullishBreakout #SmartMoney #ScalpersWelcome #SwingTrading #TechnicalAnalysis #RiskReward #TradingViewElite #ProfitWithStyle

Gold vs Euro: Heist Plan Activated – Watch the Breakout🏆XAU/EUR Golden Robbery Masterplan: Steal from Weak Hands, Escape with Gold!💰✨
🌍Hi! Hola! Ola! Bonjour! Hallo! Marhaba!🌍
Welcome, Money Makers & Market Robbers! 🤑💰💸✈️
Another top-secret robbery mission drops now — this time on the XAU/EUR battlefield! Gold vs Euro... Who wins? We do! 🏴☠️🎯
🔍The Setup:
Thief Trading Strategy™ Active – Bullish Breakout Mode Engaged
🔒 Resistance wall at 3400 is the lock.
💣 Breakout is the detonation point.
🟢 Target: 2970.00 (but smart robbers always escape before the sirens ring 🚨).
⚠️ATR Zone = danger zone = potential trend reversal trap = don’t get greedy.
🛠️Execution Plan (aka How to Rob the Market Clean)
📈 Entry Plan
"The vault’s about to open..."
💥 Breakout above Moving Average (3400) = BUY confirmation.
☑️ Set Buy Stop Orders just above MA.
☑️ OR plan a Pullback Buy Limit on recent swing low/high in 15–30M TF.
🛎️ SET ALERTS like a real thief waiting for the back door to open!
🛑 Stop Loss Strategy
"Don’t be a hero – be a survivor."
📍 SL suggestion: 2845.00 (2H swing low)
💡 Customize SL based on lot size & risk appetite.
🚨 Only set SL after breakout confirmation (don’t let false alarms shake you).
🎯 Profit Target / Exit Strategy
⛏️ Dig for gold at 2970.00, but
🏃♂️Escape before the trap springs.
🧲 Scalpers: Stick to LONGS only!
💼 Big accounts: hit hard.
🧠 Small robbers: join swing crew and trail the stop — protect the loot 💰
📊 Trend & Fundamentals Summary
⚖️ Current Trend: Neutral → Bullish Bias
🔍 Influenced by:
Macro Data
Euro Sentiment Shift
COT Positioning
Central Bank Whispers
Intermarket Forces
Geopolitical Sparks 🔥
🧠 Full breakdown in the fundamental zone (liinkk 🔗 Klik).
🚨 News Warning Alert
📰 Avoid entries near major news releases.
🎯 If in trade, manage with trailing SL to lock profits & limit damage.
🔥💖 Support the Mission
Hit that BOOST 💥 button — fuel our next big heist.
Let’s show the market we rob, we don't beg!
💪 Be loyal to the crew. Trade smart. Escape rich. 🐱👤📈
🔐 Disclaimer:
This is for education & entertainment – not financial advice.
💡 Always DYOR & adjust risk per your capital.
🧠 Stay sharp. Stay rich. See you on the next score! 💼🚁💸
