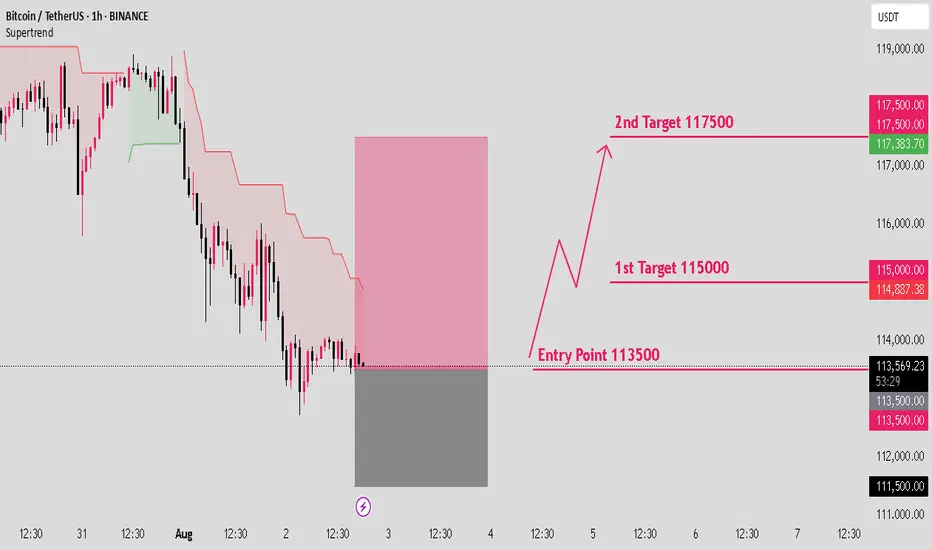
BTCUSD long setup: Targeting the next bull move.Hello IGT FOLLOWERS
Here is my BTCUSD overview, Bitcoin is showing bullish momentum after holding strong support near $112,000. A breakout above the $115000 resistance suggests buyers are regaining control. RSI is turning upward, and volume is increasing on green candles signaling demand. As long as price holds above $113,000, bulls may push toward the $117,500 target.
Key points :
Entry point : 113500
1st Target : 115000
2nd Target : 117500
Follow me for more latest updates and signals
Community ideas
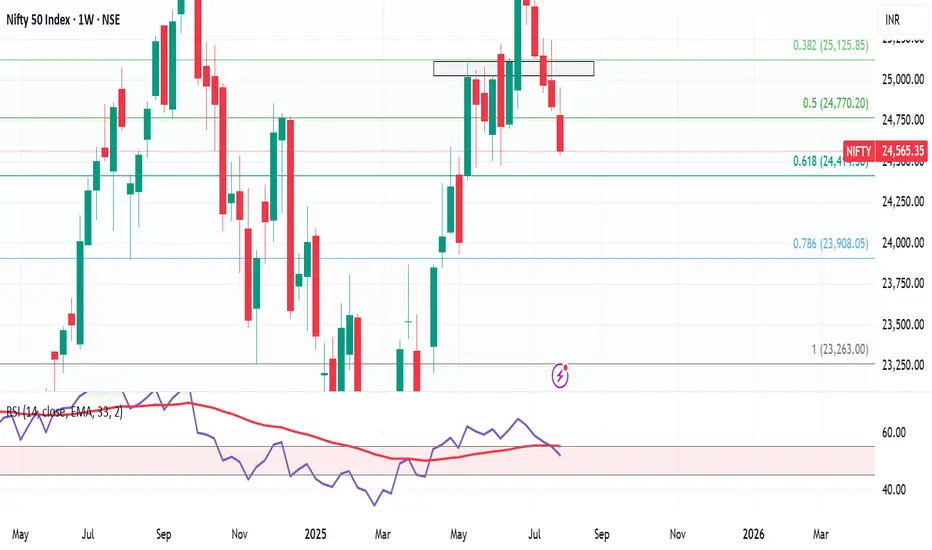
Weekly Market Wrap – Nifty Slides, Global Sentiment WeakensNifty ended the week on a bearish note, closing at 24,565, down 270 points or nearly 1.1% from last week's close. It touched a high of 24,956 and a low of 24,535, perfectly respecting the range I shared last week: 25,300–24,400.
As I highlighted earlier, the inverted hammer formation gave the bears an upper hand—and the index corrected 1.74% from the recent highs. My view continues to favor caution, with the expected trading range for the upcoming week at 25,000–24,100.
Key Levels to Watch:
Support Zone: 24,400 (key bounce area), followed by 24,100 / 23,900 in case of further breakdown.
Resistance Zone: Upside capped near 25,000.
If the market holds 24,400 around 6th–7th August, expect a short-term bounce. However, if this level is breached, expect dips to 24,100 or 23,900, which could offer short-covering opportunities.
Global Cues:
The S&P 500 also had a rough week, closing at 6,238, down 2.5% week-on-week. This decline sparked a wave of selling across global markets. The 6,200 level is crucial—if it holds, we might see a rebound globally, including in Indian equities. Below that, 6,100 remains the breakout retest zone, which I believe should provide some cushion.
💡 Strategy Going Forward:
Focus on stocks showing relative strength in this falling market—they’ll likely lead the rally once sentiment turns.
Avoid chasing rallies, and watch for signs of bottoming out near key support zones.
Keep an eye on global indices like the S&P 500 and Dow Jones, as their stability will dictate near-term direction for Indian markets.
Stay sharp, stay prepared. Let the bears have their moment, but be ready to pounce when the tide turns.
Hypecoin weekend short to $35.75hypeusdt short
Sl: $36.72-38.85
Tp1: $36.34---50%
Full Exit: $35.75
2.21-3 RR
DTT strategy applied
Time sensitive

Xtz historic supportXTZ is at a historic support level here where it has consistently respected as support or resistance after recently busting over it and on higher volume seen in a long time. I’m optimistic.
Most tied up in staking it seems ~77%, so moves could happen quickly, as seen previously.

GBPJPY: Bearish Market StructureLook to sell after the correction...
(H4)
✅ Confirmed BOS below 197.20
✅ LHs
✅ Supply Zone: 196.10 – 196.60
(H1)
✅ Nice impulse down from 197.30 to 195.50
✅ Short-Term Supply Zone: 195.90 – 196.20 (H1 OB inside H4)
Looking for price to tap this zone and form a new LH
(M15)
✅ Price consolidating after the drop
✅ No bullish BOS
✅ New LH
Expecting liquidity sweep above 195.90, then bearish BOS below 195.70 to confirm entry
❌ Invalidation: Bullish BOS above 196.70 on M15.

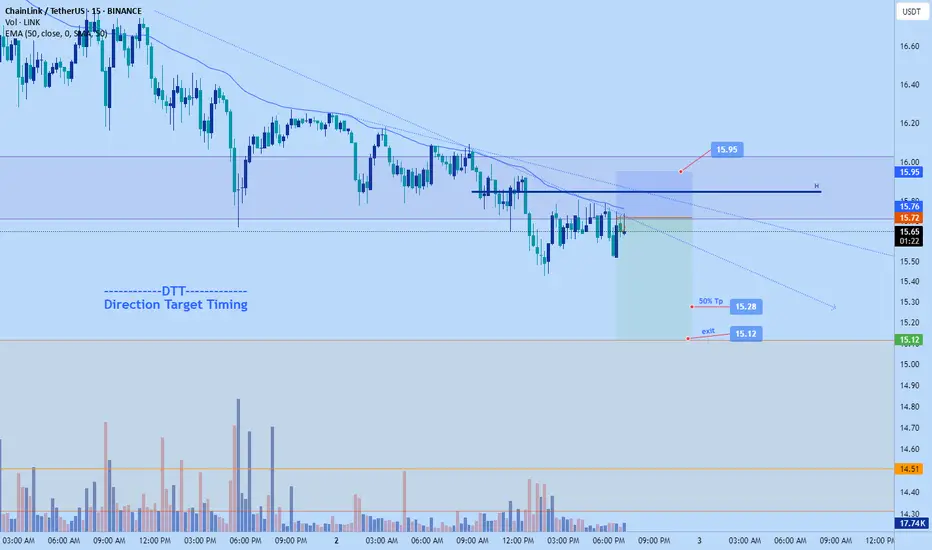
Chainklink further dump to $15.12Just now opened a short position on chainlink.
Aiming for $15.12 area
2-2.61RR
DTT strategy applied.
Time sensitive
Beautiful Monthly Closing.SNGP Analysis
Closed at 123.46 (01-08-2025)
Beautiful Monthly Closing.
However, immediate Resistance is
around 130 - 131.
Crossing & Sustaining this level with
Good Volumes may result in upside
move targeting 145 - 150 & then around 190.
It should not Break 105, otherwise we may
witness further selling pressure.

NVIDIANVIDIA Corporation is a leading American technology company known for designing and manufacturing graphics processing units (GPUs), system-on-a-chip units (SoCs), and AI computing platforms. Founded in 1993, the company originally focused on gaming graphics but has since evolved into a global powerhouse in artificial intelligence, data centers, autonomous vehicles, and high-performance computing. NVIDIA’s GPUs are widely used not only in gaming and visual computing but also in scientific research, AI model training, machine learning, and cloud infrastructure.
In recent years, NVIDIA has been at the forefront of the global AI boom. Its data center business, powered by its high-end GPU architecture (like the H100 and newer generations), has become a critical backbone for tech companies, cloud providers, and governments seeking to build large-scale AI systems. The company also made major strategic moves through acquisitions and software integration, further solidifying its dominance in the AI hardware space. NVIDIA’s strong financial performance and technological leadership led to rapid growth in its market capitalization, briefly making it one of the most valuable companies in the world.
As of August 2025, NVIDIA’s stock is trading at $173.60 per share, following a stock split that adjusted its price while increasing liquidity. Despite broader market volatility, NVIDIA remains a key player driving the AI revolution and is closely watched by investors and analysts. Its valuation continues to be shaped by demand for AI chips, innovation in GPU architecture, and its ability to maintain technological leadership amid growing global competition. NVIDIA stands at the intersection of multiple megatrends, making it a critical stock in both the technology and semiconductor sectors.

US30 Swing Short!
HI,Traders !
#US30 keeps falling down
And the index broke the
Key wide horizontal level
Around 43924.6 which is now
A resistance and the breakout
Is confirmed so we are very
Bearish biased and we will
Be expecting a bearish
Continuation on Monday !
Comment and subscribe to help us grow !

NIFTY50.....Miss a final sell-off! Part IIHello Traders,
the NIFTY50 is on track with my forecast! It declined over the course of the week to a level of 24565 points - a loss of almost 271 points, (nearly 1.09%).
The question is, if N50 is declining lower in the coming week. The question is, to what degree will it decline ?
Chart analysis:
Today, I'd like to show you another idea of the count. Here, at the level of 25669, a wave (v), green, has been established, and the following correction is a wave (iv), pink, to the level I have mark with the sky blue rectangle. This rectangle ranges from 24473 to 23934.90. If we reach these levels, wave (iv), whether of wave ((iv)) or wave (iv), should end!
In either case, there is more downside potential and has more room to go, and is not finished yet.
The first sign, that something went wrong would be at the point, when the high @ 23368, wave (i), green, were to be touched! This is because it is not permitted for a wave (iv) to touch the high of any degree of wave (i).
The indicators, too, have much room to decline for the rest of the week.
So, it will be exiting to watch how the market will makes its decision.
Have a great weekend.....
Ruebennase
Please ask or comment as appropriate.
Trade on this analysis at your own risk.

BTCUSD : Short levelHere is a great entry point for those who scalp this instrument or pips. The level is marked with a red arrow. It will be active until I report. It may become inactive over time.
Watch out for trading on the news.

ETHEREUM ETHUSDTTHE structure and strategy will never lie. Watch demand and supply roof .
from the top layers ,we have seen the 3touch supply roof sending Ethereum tanking again expect the retest of the broken supply from the bottom to provide buy opportunity
trading is 100% probability, please lower your expectations and know that any key level can fail.
#ethusdt #ethereum #bitcoin #btc #crypto

US500 Pulls Back from 6,400– Correction or Trend Shift?The index has rejected the 6,400 🔼 resistance zone with a strong bearish candle, pulling back toward the 6,200 🔽 support region. Price is still trading within a bullish structure, but this drop may signal early signs of exhaustion.
Support Levels: 6,200 🔽, 6,100 🔽, 6,000 🔽
Resistance Levels: 6,300 🔼, 6,400 🔼
Bias:
🔼 Bullish: If price holds above 6,200 and reclaims 6,300, the uptrend remains intact and bulls may reattempt a push toward 6,400.
🔽 Bearish: A daily close below 6,200 could open a deeper retracement toward 6,100 or even 6,000.
📛 Disclaimer: This is not financial advice. Trade at your own risk.

**"Gold Price Rebounding from Support:Potential Move Toward 3436This chart shows the **price movement of Gold (XAU/USD)** on a **daily timeframe**.
### Key Points:
* **Support Zone** : Around **\$3,266**, this is the area where price has bounced up multiple times, meaning buyers step in here.
* **Resistance Line**: Around **\$3,436**, this is the level where price has been rejected before, meaning sellers are strong here.
* **Current Price**: Around **\$3,293**.
### What the Chart Suggests:
* Price is near the **support** zone again.
* If the support holds, the green arrow shows a possible move **upward**.
* Price may first move up slightly, pull back, and then try to **break above resistance** at \$3,436.
Gold is in a sideways range. It's near a strong support level and might go up from here toward the resistance level, as shown by the green line.

BONKUSDT – Let the Market Come to YouIn a possible Q3 correction, BONKUSDT may retest the green box zones below.
These areas are not predictions — they’re prepared zones where I’ll be waiting, not chasing.
🟩 I don’t buy strength blindly. I buy value with structure.
All risk-on markets typically experience significant corrections in the third quarter of the year and struggle to recover from this correction until the end of the year.
🎯 My Strategy
🔔 Set alerts for the green boxes
🕐 Switch to the 1-hour timeframe when triggered
📈 Wait for upward breakout + positive CDV
🎯 Only then: take the shot — one bullet, risk-managed
“Markets reward those who wait with a plan, not those who rush with emotion.”
Let’s stay patient, structured, and consistent.
— UmutTrades 💙
📌I keep my charts clean and simple because I believe clarity leads to better decisions.
📌My approach is built on years of experience and a solid track record. I don’t claim to know it all but I’m confident in my ability to spot high-probability setups.
📌If you would like to learn how to use the heatmap, cumulative volume delta and volume footprint techniques that I use below to determine very accurate demand regions, you can send me a private message. I help anyone who wants it completely free of charge.
🔑I have a long list of my proven technique below:
🎯 ZENUSDT.P: Patience & Profitability | %230 Reaction from the Sniper Entry
🐶 DOGEUSDT.P: Next Move
🎨 RENDERUSDT.P: Opportunity of the Month
💎 ETHUSDT.P: Where to Retrace
🟢 BNBUSDT.P: Potential Surge
📊 BTC Dominance: Reaction Zone
🌊 WAVESUSDT.P: Demand Zone Potential
🟣 UNIUSDT.P: Long-Term Trade
🔵 XRPUSDT.P: Entry Zones
🔗 LINKUSDT.P: Follow The River
📈 BTCUSDT.P: Two Key Demand Zones
🟩 POLUSDT: Bullish Momentum
🌟 PENDLEUSDT.P: Where Opportunity Meets Precision
🔥 BTCUSDT.P: Liquidation of Highly Leveraged Longs
🌊 SOLUSDT.P: SOL's Dip - Your Opportunity
🐸 1000PEPEUSDT.P: Prime Bounce Zone Unlocked
🚀 ETHUSDT.P: Set to Explode - Don't Miss This Game Changer
🤖 IQUSDT: Smart Plan
⚡️ PONDUSDT: A Trade Not Taken Is Better Than a Losing One
💼 STMXUSDT: 2 Buying Areas
🐢 TURBOUSDT: Buy Zones and Buyer Presence
🌍 ICPUSDT.P: Massive Upside Potential | Check the Trade Update For Seeing Results
🟠 IDEXUSDT: Spot Buy Area | %26 Profit if You Trade with MSB
📌 USUALUSDT: Buyers Are Active + %70 Profit in Total
🌟 FORTHUSDT: Sniper Entry +%26 Reaction
🐳 QKCUSDT: Sniper Entry +%57 Reaction
📊 BTC.D: Retest of Key Area Highly Likely
📊 XNOUSDT %80 Reaction with a Simple Blue Box!
📊 BELUSDT Amazing %120 Reaction!
📊 Simple Red Box, Extraordinary Results
📊 TIAUSDT | Still No Buyers—Maintaining a Bearish Outlook
📊 OGNUSDT | One of Today’s Highest Volume Gainers – +32.44%
📊 TRXUSDT - I Do My Thing Again
📊 FLOKIUSDT - +%100 From Blue Box!
📊 SFP/USDT - Perfect Entry %80 Profit!
📊 AAVEUSDT - WE DID IT AGAIN!
I stopped adding to the list because it's kinda tiring to add 5-10 charts in every move but you can check my profile and see that it goes on..

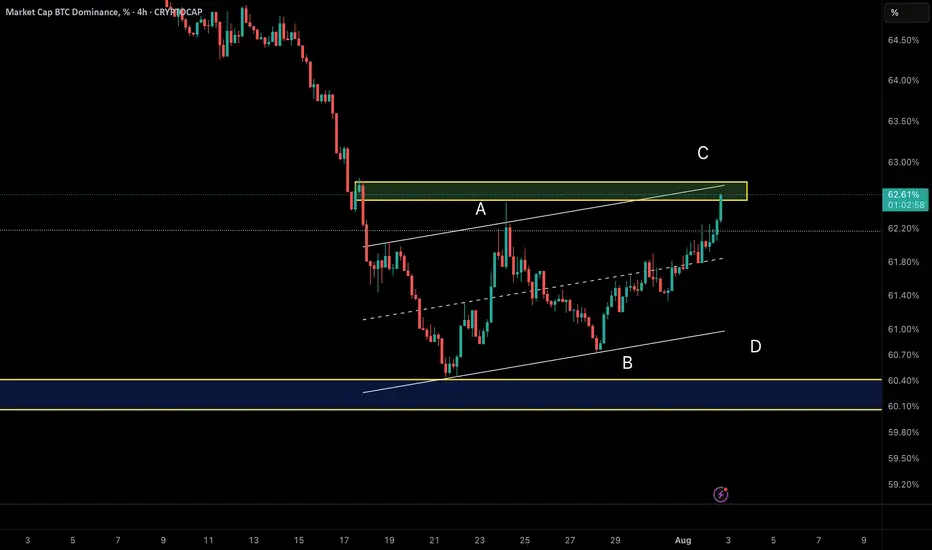
Smart Money Watching BTC Dominance – Rotation to Alts IncomingAfter a deep correction, BTC Dominance has entered a corrective upward phase inside an ascending channel.
Wave A rallied from 60.5% to 62.3%, followed by Wave B retracing to 60.74%.
Currently, Wave C is developing and has reached around 62.2%.
The key resistance sits near 62.7%, exactly at the upper trendline of the channel. This could act as a reversal point, potentially ending Wave C and triggering a bearish move.
💡 Implication:
If dominance drops from this zone, we could see capital rotation into altcoins, supporting a bounce across the broader altcoin market.
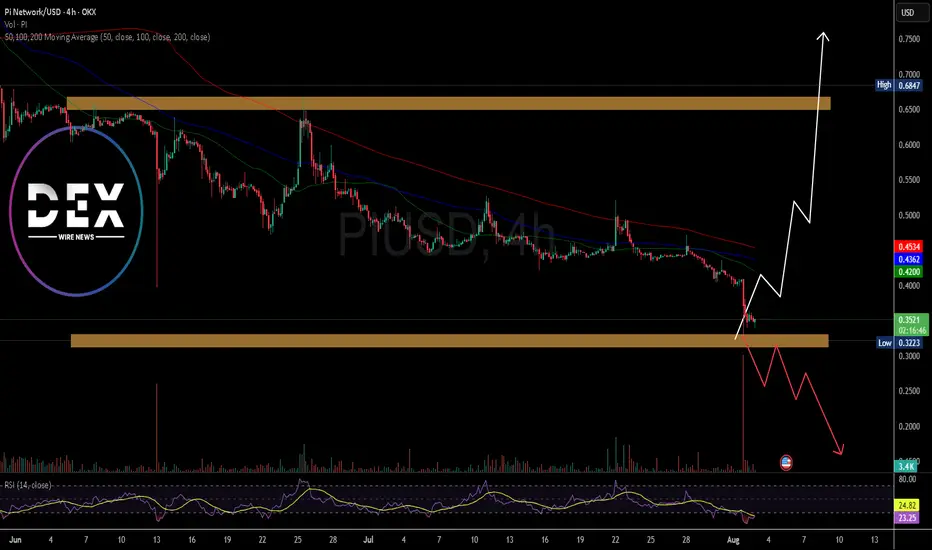
Is There Hope For PI Network? The Price of the notable altcoin NASDAQ:PI network has since seen a downtick of 80.86% since lunching and listing on major CEX like Kucoin, GateIo, OKX, etc. as per data from CMC.
The altcoin has lost the psychological $0.66 resistance zone forming a support or baseline at the $0.33 price range. with increasing selling pressure, NASDAQ:PI might experience further price dip to the $0.20 price point eventually leading to a deja vu to the $0.60 price point.
Possible factor to present price degradation is the dip in CRYPTOCAP:BTC 's price that most coins follow suit, and NASDAQ:PI wasn't an exception.
NASDAQ:PI is currently oversold as hinted by the data from Trading view. the altcoin has an RSI of 20 which entails weak momentum and possible chances of a market turnaround.
What Is Pi Network?
Pi Network is a social cryptocurrency, developer platform, and ecosystem designed for widespread accessibility and real-world utility. It enables users to mine and transact Pi using a mobile-friendly interface while supporting applications built within its blockchain ecosystem.
Pi Price Data
The Pi price today is $0.346618 USD with a 24-hour trading volume of $174,236,091 USD. Pi is down 14.58% in the last 24 hours. The current CoinMarketCap ranking is #38, with a market cap of $2,692,698,184 USD. It has a circulating supply of 7,768,487,700 PI coins and a max. supply of 100,000,000,000 PI coins.

ETHUSD : Key levelsHere is a list of key levels. All of them will be interesting to the market, but when exactly from them will be a bounce I will inform in the next posts. It is foolish to just wait for a bounce from them. Stay tuned for the next posts.

$CRWV: Reversal Brewing or More Pain Ahead?🧠 NASDAQ:CRWV – Technical Analysis (Daily Timeframe)
CoreWeave is currently trading at $104.14, sitting at the lower end of a well-defined descending channel after a steep selloff (-8.75% today). Volume is spiking, suggesting growing interest — whether that's accumulation or distribution is the key to watch next.
📉 Descending Channel Breakdown
Upper trendline = breakout trigger
Lower trendline = breakdown trapdoor
🟡 Midline of the channel = key decision zone (dynamic resistance/support)
Acts like a battlefield: bulls want to flip it, bears want to reject it.
CRWD has been respecting the midline as resistance — until price reclaims and holds above it, trend remains bearish.
If we break above the midline with volume, that’s early confirmation of strength before even touching the top of the channel.
🟢 Long Setup (Breakout Play)
Trigger: Break & close above channel top (~$110+)
Confirmation: Reclaim midline, convert it to support
Targets:
$120 local supply
$140 minor inefficiency
$186 gap-fill + key supply zone
🔴 Short Setup (Breakdown Play)
Trigger: Break & close below lower trendline (~$100 or under)
Confirmation: Fail to reclaim midline on bounce
Targets:
$85 psychological zone
$64.82 demand level
📊 Indicators
MACD: Bearish, but curling. A bullish cross on a midline reclaim = fuel.
RSI: Near oversold, showing early divergence = potential bounce
Volume: Big pop today — first real signal buyers/sellers are clashing hard.
🎯 Key Takeaway:
✅ Break & close above midline → early strength
✅ Break & close above channel → CONFIRMED BUY
❌ Close below lower channel → HIGH-PROBABILITY SHORT
❓ Rejections at midline → continue fading pops until proven wrong

The Only Bitcoin Chart You NeedUnderstanding Price Action is essential for successful trading as it allows traders to interpret market dynamics and make informed decisions based on pure price movements. By focusing solely on price movements, traders can eliminate noise and distractions caused by indicators or external factors, leading to a clearer understanding of market trends and patterns.

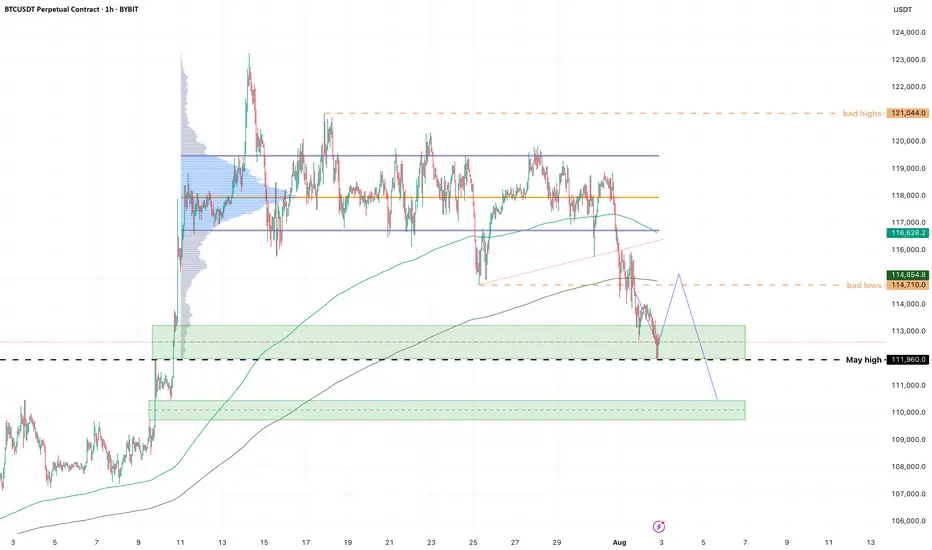
BTC - HOOOLLDDD!!!!Looks like we got our downside first.
Short update, but important level to watch is that 112k high from May this year. I longed on a ltf low hold, looking for a bounce into the highs of this sell-off cluster, then see what's what.
Flow is still very heavy; I expect to get stopped on this but it's one of those setups I just have to take, or I kick myself tomorrow.
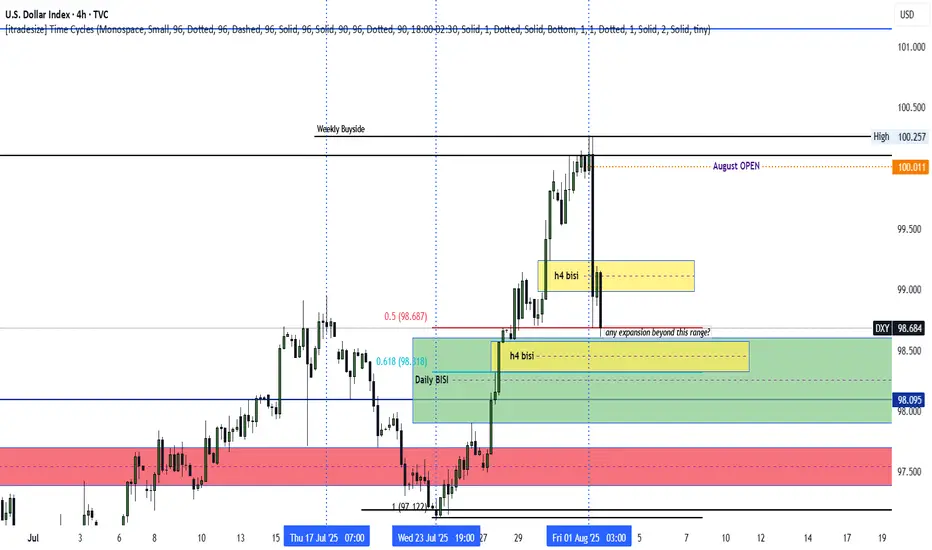
DXY bullish into AUGUSTThe dxy seems poised to rally following a rally above PMHs. The August OPEN decline could end up being nothing but a retracement as we rally high. Monday, Tuesday and Wednesday could range, while Thursday and the NFP push us above August's current highs. An expansion below Friday's New York AM lows (H4) could signal continued decline as we seek to establish weekly LOWS. Patience as the market unfolds is hand is ALWAYS key. Let's chat.