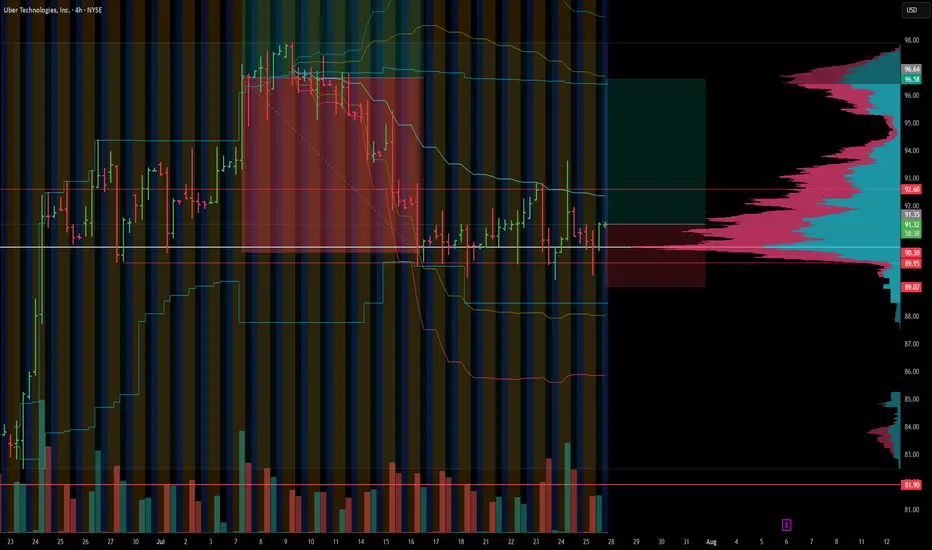
Repeating UBER longUBER has found the support at 91 level and will likely retest initial supply area.
Community ideas
Next Volatility Period: Around August 21
Hello, traders.
Please "Follow" to get the latest information quickly.
Have a nice day today.
-------------------------------------
#TSLA
We need to see if it is rising along the rising channel.
The key is whether it can rise with support near 311.48 to break out of the downtrend line.
The key is whether it can rise along the short-term uptrend line and break through the short-term downtrend line after passing through this volatility period around July 25.
Therefore, we need to see whether it can rise above the 347.21-382.40 range with support near 311.48.
The next volatility period is expected to be around August 21.
-
The important thing is to maintain the price above the M-Signal indicator on the 1M chart.
If not, there is a possibility of a long-term downtrend.
Therefore, if it shows support in the 268.07-311.48 range, it is a time to buy.
-
Thank you for reading to the end.
I hope you have a successful trade.
--------------------------------------------------

I'm optymist. 1.183-1.185 In front us3 year channel saying that we should to touch it.
Yellow line.
Before us
In my opinion before us is level. 1.18-1.20 before bigger correction until 1.12 even.
Then in few month i see 1.4-1.6

Aeva Technologies (AEVA) – Pioneering Next-Gen LiDAR Company Snapshot:
Aeva NASDAQ:AEVA is revolutionizing perception systems with 4D FMCW LiDAR—offering instant velocity detection, high precision, and long-range sensing, setting a new standard for autonomous systems.
Key Catalysts:
Breakthrough Technology
AEVA’s proprietary 4D Frequency Modulated Continuous Wave (FMCW) LiDAR provides real-time velocity and depth data, outperforming traditional Time-of-Flight systems in accuracy and safety.
Automotive OEM Traction 🚗
Strategic collaborations are translating into production-stage contracts, marking a key inflection from R&D to scalable revenue generation.
Multi-Sector Expansion 🌐
AEVA’s sensing tech is penetrating robotics, aerospace, and industrial automation, significantly broadening its TAM and diversifying revenue streams.
Government & Aerospace Validation
Recent contract wins with defense and aerospace clients underscore AEVA’s technological credibility and commercial viability.
Investment Outlook:
Bullish Entry Zone: Above $22.50–$23.00
Upside Target: $39.00–$40.00, supported by production scaling, cross-sector adoption, and deep-tech differentiation.
⚙️ AEVA stands at the forefront of smart sensing innovation with strong momentum into high-growth verticals.
#AEVA #LiDAR #AutonomousVehicles #Robotics #Aerospace #IndustrialTech #SensorRevolution #4DPerception #FMCW #TechStocks #Innovation #SmartMobility


SPX chit chat... we're still up for nowAfter that crazy April 2025 crash, it feels like we should not be this high so fast... that's how I felt before too. But the rising channel is holding up right now. We are approaching the top. In previous times, the market grinded even higher (COVID pandemic was the last example).
Today we squeezed out new ATHs. The month ends next week and a new one begins. Less fear; more charts for the rest of the year.
See you in August!

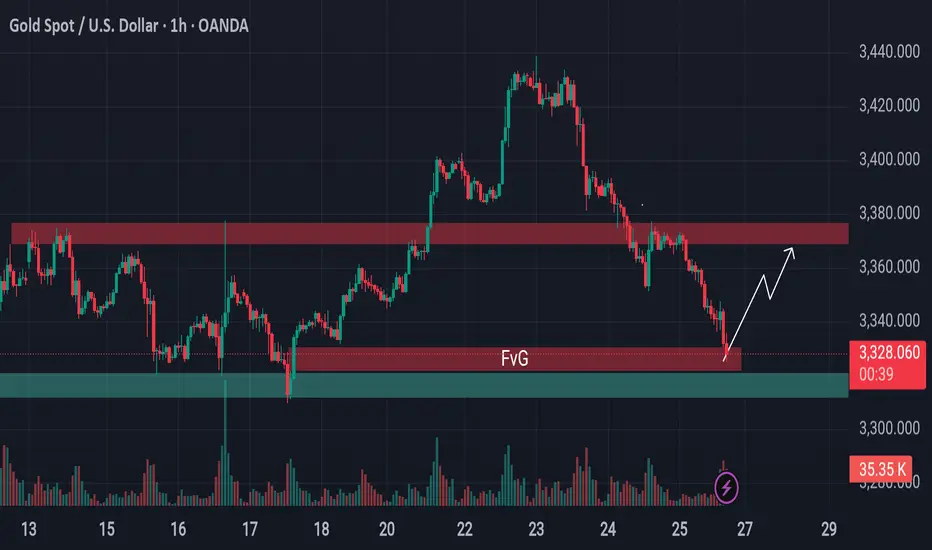
From Breakdown to Breakout? Gold Eyes Support Based Reversal!Gold is approaching a critical support area.
Previously, the price was holding above a key support level, but that zone has now been breached and is likely to act as resistance going forward. However, just beneath the current price, there's a well-established support level still intact—reinforced further by the presence of a bullish Fair Value Gap (FVG).
This setup hints at a possible reversal or a short-term surge from this zone. If market conditions align, gold may stage a pump from here. Keep this level on your radar—it could turn into a decisive point for price direction.
🛡 Always conduct your own analysis before taking any trades. DYOR.
Crypto market review [UPD]: set-ups in BTC and alt-coinsMade a quick video going over some of the setups I see developing in Bitcoin and a few altcoins I personally track and trade.
Thank you for your attention and I wish you successful trading decisions!
If you’d like to hear my take on any other coin you’re following — feel free to ask in the comments (just don’t forget to boost the idea first 😉).

S&P 500 Index Wave Analysis – 25 July 2025
- S&P 500 Index broke key resistance level 6300.00
- Likely to rise to resistance level 6500.00
S&P 500 Index recently broke the key resistance level 6300.00 (which stopped the previous waves 5 and (B), as can be seen below).
The breakout of the resistance level 6300.00 continues the active intermediate impulse wave (5) from the middle of this month.
Given the strong daily uptrend, S&P 500 Index can be expected to rise to the next resistance level 6500.00 (coinciding with the daily up channel from May).

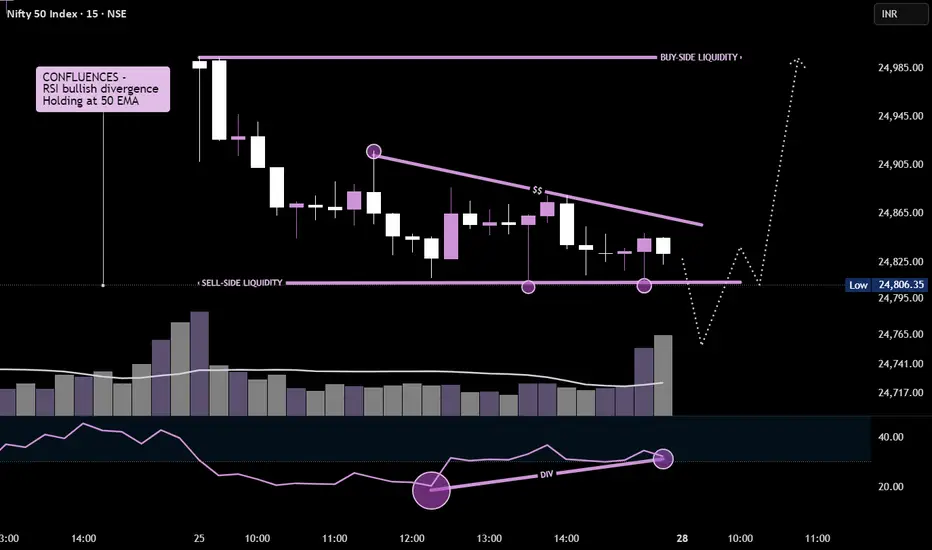
NIFTY50 - 15MIN Potential reversal brewingPrice is forming a falling wedge pattern with clear bullish RSI divergence, signaling potential reversal.
USUALUSDT 8H#USUAL has formed a Cup and Handle pattern on the 8H timeframe. It is currently facing the Handle resistance and the SMA200. In case of a breakout above these levels, the short-term targets are:
🎯 $0.1031
🎯 $0.1167
If the price then breaks above the Neckline, which serves as the main resistance zone, the mid-term targets are:
🎯 $0.1302
🎯 $0.1494
🎯 $0.1739
⚠️ As always, use a tight stop-loss and apply proper risk management.

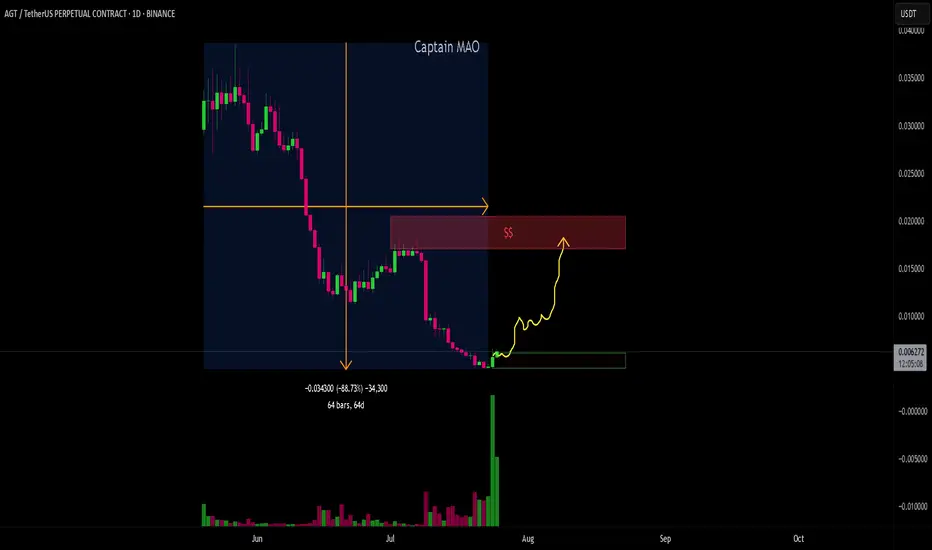
AGT/USDT - ReversalAGT/USDT has been under massive selling pressure since its listing on May 20, 2025, leading to a sharp ~90% decline. However, recent price action is showing strong signs of a potential reversal. Buyers have stepped in aggressively with a noticeable surge in volume, signaling a possible end to the downtrend. The current structure suggests the beginning of accumulation and a high-probability setup for a trend reversal. Targeting 0.018-0.02$ which huge liquidity can be found at this zone .
XAUUSDLongterm gold os going to 5K
Midterm 3,500
Shorterm, we going to the bottom of the consolidation.

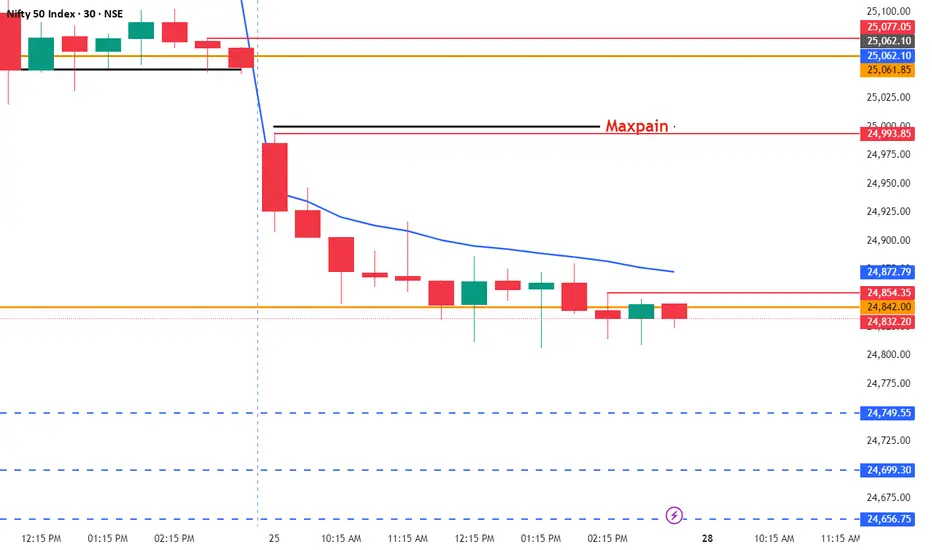
Monday Gap down ProbabilityAs market sentiments are negative where smallcap and midcap tumbles possible gap down after weekend , positive bias after breaking 25062 level till then market showing bearish movement
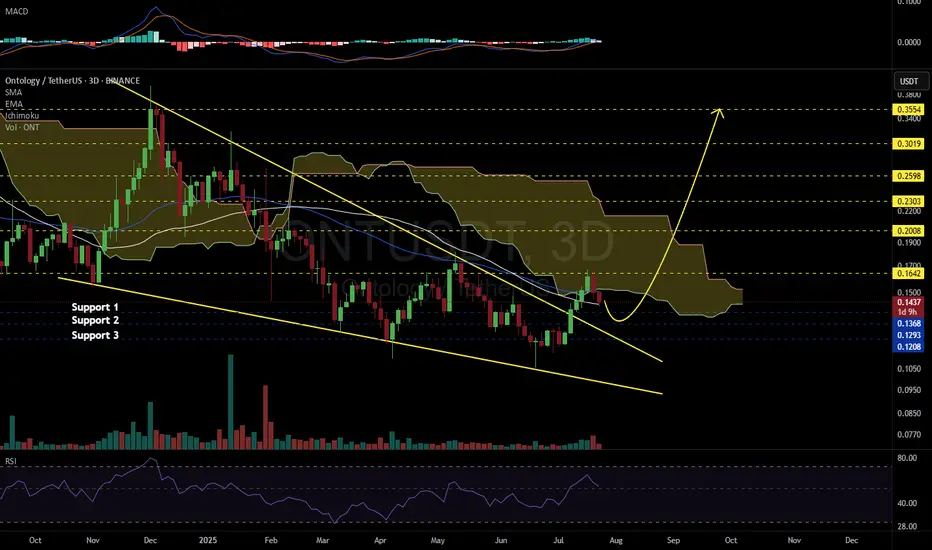
ONTUSDT 3D#ONT has broken above the large falling wedge pattern on the 3-day chart. It was recently rejected from both the Ichimoku Cloud and the 3-day EMA50, but is still holding above the SMA50 — a positive sign.
📌 Consider laddered entries at the current price and key support levels:
🔹 $0.1368
🔹 $0.1293
🔹 $0.1208
In case of a successful bounce, the upside targets are:
🎯 $0.1642
🎯 $0.2008
🎯 $0.2303
🎯 $0.2598
🎯 $0.3019
🎯 $0.3554
⚠️ As always, use a tight stop-loss and apply proper risk management.
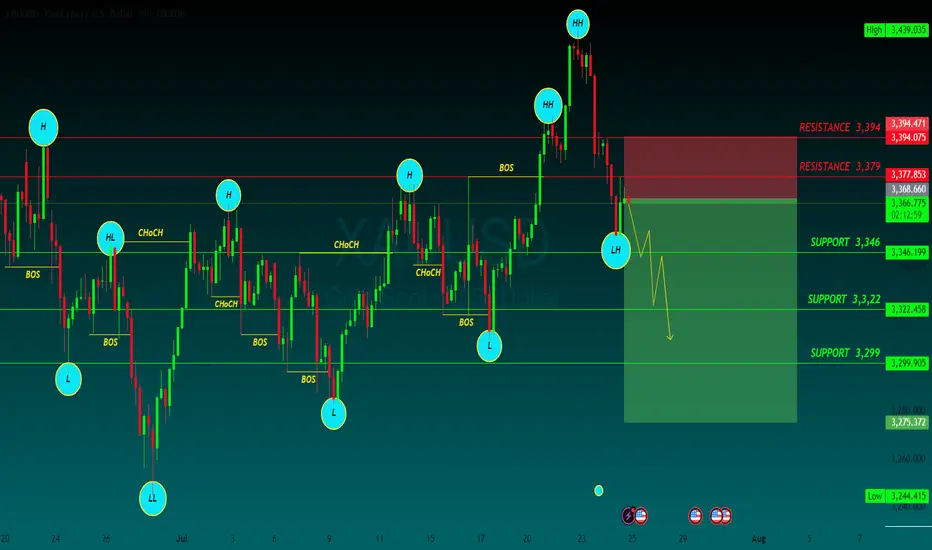
GOLD SELLGold price bears retain control amid fading safe-haven demand, rebounding USD
US President Donald Trump announced late Tuesday that his administration had reached a trade deal with Japan. Furthermore, reports that the US and the European Union are heading towards a 15% trade deal boost investors' confidence and weigh on the safe-haven Gold price for the second straight day on Thursday.
The markets do not expect an interest rate cut from the US Federal Reserve in July despite Trump's continuous push for lower borrowing costs. In fact, Trump has been attacking Fed Chair Jerome Powell personally over his stance on holding rates and repeatedly calling for the central bank chief's resignation.
Moreover, Fed Governor Chris Waller and Trump appointee Vice Chair for Supervision Michelle Bowman have advocated a rate reduction as soon as the next policy meeting on July 30. This keeps the US Dollar depressed near a two-and-a-half-week low and could offer some support to the non-yielding yellow metal.
Traders now look forward to the release of flash PMIs, which would provide a fresh insight into the global economic health and influence the safe-haven commodity. Apart from this, the crucial European Central Bank policy decision might infuse some volatility in the markets and drive the XAU/USD pair.
Meanwhile, the US economic docket features Weekly Initial Jobless Claims and New Home Sales data, which, in turn, would drive the USD and contribute to producing short-term trading opportunities around the commodity. Nevertheless, the fundamental backdrop warrants caution for aggressive traders.
SUPPORT 3,346
SUPPORT 3,322
SUPPORT 3,399
RESISTANCE 3,394
RESISTANCE 3,379
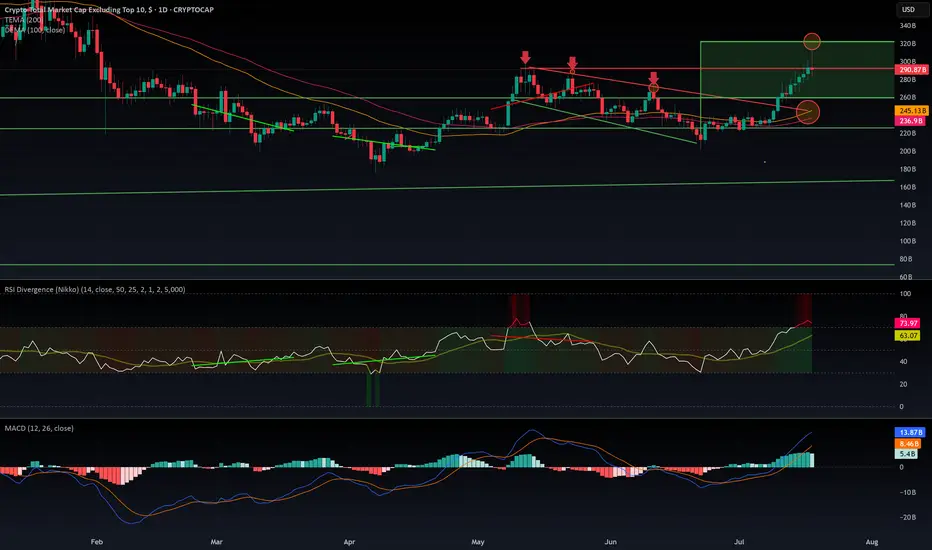
$OTHERS rejected from $320 B resistance. What is next?CRYPTOCAP:OTHERS Rejected at $320B: Is the Altseason on Pause?
CRYPTOCAP:OTHERS just got rejected at the $320B resistance after a decent pump — the kind that usually signals the start of an altseason. But if we dig into the indicators, warning signs are flashing:
- MACD is sitting in overbought territory.
- RSI is heavily extended, signaling potential exhaustion.
- EMA 100 & 200 are colliding with the top of a previous downtrend channel — a zone that historically acted as strong resistance.
The rejection was sharp. So what's next? Are we entering a range between $320B and $260B? It's quite possible. The aIf you wantltcoin market now sits at a decision point: either it keeps pushing higher or takes a breather — potentially pausing the rally until September.
Historically, August is a slow month in the West. People go on vacation, volumes drop, and markets tend to cool off. This seasonal pattern supports the idea of a consolidation phase before a stronger second leg of altseason kicks off in mid-September and carries into Q4.
I’m not posting too many ideas lately because the market landscape has changed. The new players aren’t just trading — they’re manipulating flows with massive capital to hunt retail liquidity.
They’re also using far more sophisticated tools than our classic MACD and RSI — including AI-powered indicators and multi-layered analytics that are beyond retail reach.
In this new environment, predictions are harder and risk is higher.
🧠 Do Your Own Research (DYOR), stay sharp, and don’t blindly trust social influencers.
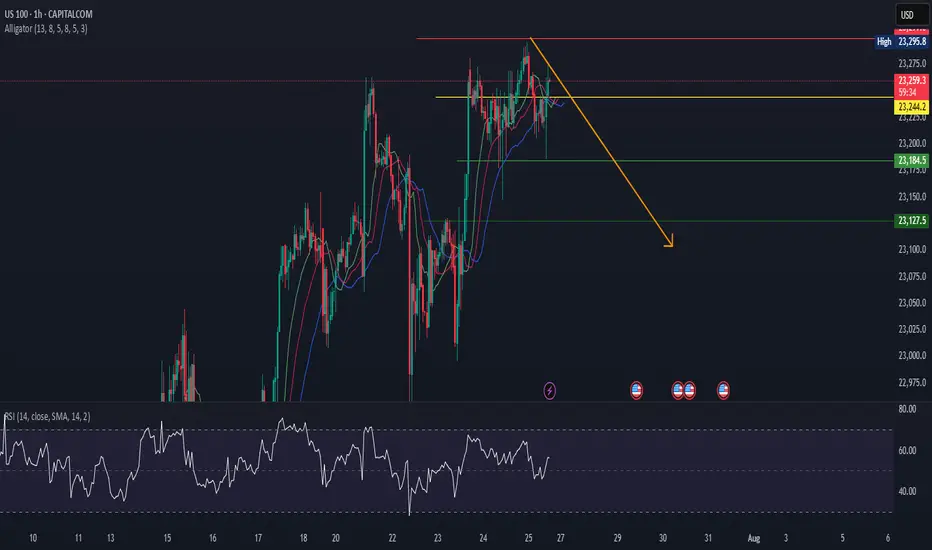
US100Us100 is in reversal MOde.
Big bearish divergence also shown in RSI.
Alligator alos indicates trend will go down from here.
we sell at CMP>
BTC Reloading for Breakout — Watching for 1H MSS Flip
BTC has bounced from local support (green zone) and is challenging the descending trendline.
The price is now testing the red resistance zone and the upper boundary of the 1H MSS (market structure shift) box.
Scenario A (Bullish):
— If BTC cleanly breaks the trendline and flips the 1H MSS box into support (with a strong close above), this is a trigger for a scalp long.
— Target for the move is the upper green box/previous high area near $122,000.
Scenario B (Bearish/Invalidation):
— If price is rejected at the red resistance and falls back below the green support box, risk of deeper pullback toward $116,000 increases.
BTC has shown resilience by quickly reclaiming support after a sweep lower, indicating strong demand. The market looks to be reloading for another push, with liquidity building up just below resistance. The setup favors a breakout if NY Open brings momentum. The flip of the 1H MSS box would confirm bullish intent. However, caution if the breakout fails — structure remains choppy and a failed breakout can trap late buyers.

Trendline BreakThe price has broken a bullish trendline followed by a pullback and now the price looks to go short
WE ONLY TRADE PULLBACKS

DUSK/USDTOn June 12, 2025, DUSK/USDT broke down below the key $0.06 support in a final liquidity grab, shaking out weak hands. Since then, the price has been in clear accumulation, forming a solid base below the $0.06 zone. On July 8, 2025, strong buyers aggressively stepped in, reclaiming the $0.06 level marking the first stage of a potential trend reversal.
Currently, price is holding firmly above this reclaimed zone, showing strength and readiness for a parabolic move as bullish momentum builds up.

Euro is pumping up Officially the market is targeting the buy side liquidity on the 1.8 , next week we will see if the market confirm the up trend in lower time frame
