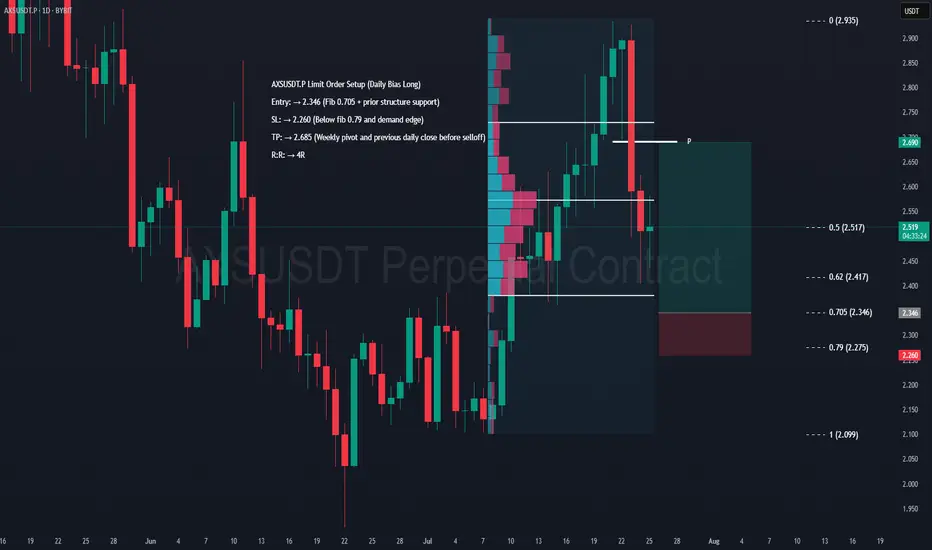
AXS Swing Long Setup – Daily Confluence TradeAXS Limit Order Setup (Daily Bias Long)
Entry: → 2.346 (Fib 0.705 + prior structure support)
SL: → 2.260 (Below fib 0.79 and demand edge)
TP: → 2.685 (Weekly pivot and previous daily low before selloff)
R:R: → 4R
DISCLAIMER: I am not providing trading signals or financial advice. The information shared here is solely for my own documentation and to demonstrate my trading journey. By openly sharing my process, I aim to put pressure on myself to stay focused and continually improve as a trader. If you choose to act on any of this information, you do so at your own risk, and I will not be held responsible for any outcomes. Please conduct your own research and make informed decisions.
Community ideas
EUR USD longas trend suggest and as today is Friday everything should settle this trade can be viable but the question that the target will hit would not be answered today
Please note: This is for educational purposes only and not a trading signal. These ideas are shared purely for back testing and to exchange views. The goal is to inspire ideas and encourage discussion. If you notice anything wrong, feel free to share your thoughts. In the end, to learn is to share !

GBP USD long as the price approaching the trend line we may have a rejection to the top so this trade is so viable ....
Please note: This is for educational purposes only and not a trading signal. These ideas are shared purely for back testing and to exchange views. The goal is to inspire ideas and encourage discussion. If you notice anything wrong, feel free to share your thoughts. In the end, to learn is to share !

USD JPY shortthe sl is a bit short and narrow but yet lets see the rr is very good 1 to 3 lets see
Please note: This is for educational purposes only and not a trading signal. These ideas are shared purely for back testing and to exchange views. The goal is to inspire ideas and encourage discussion. If you notice anything wrong, feel free to share your thoughts. In the end, to learn is to share !

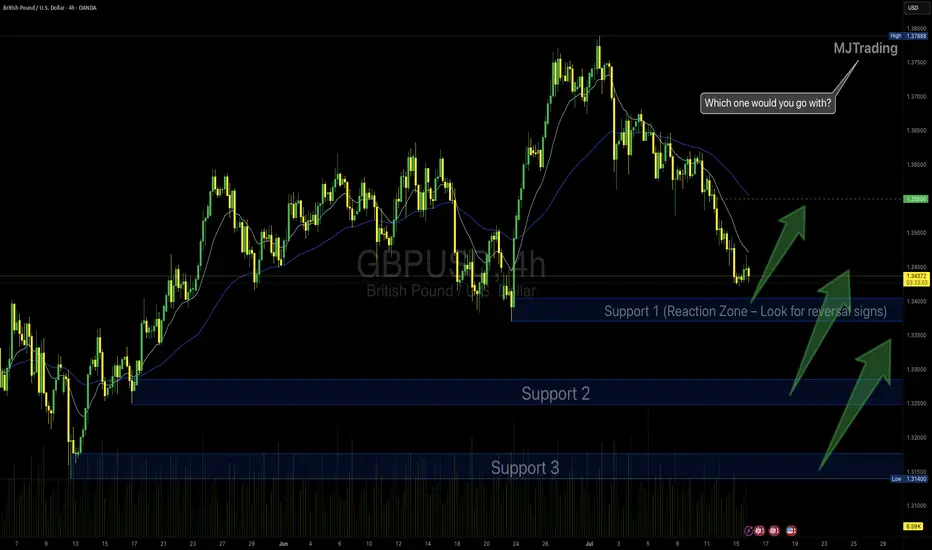
GBPUSD Idea – Demand Zones & Potential Reversal Play🧠 MJTrading:
After a steady downtrend, GBPUSD is now approaching a strong 4H demand zone (Support 1), where we previously saw explosive bullish reactions.
Price is also extended from both EMAs, showing potential for a technical pullback or full reversal.
💡Scenarios to consider:
🔹 If Support 1 holds → we may see a bounce toward 1.3500+
🔹 If broken → Support 2 & 3 offer deeper liquidity and high-probability demand zones
👀 Watch for:
Bullish reversal candles (engulfing / hammer)
Bullish divergence on lower timeframes
Volume spikes on reaction
⚠️ Invalidation:
If Support 3 breaks with strong momentum, we might enter a bearish continuation phase.
#GBPUSD #Forex #ChartDesigner #SmartMoney #PriceAction #MJTrading #ForexSetup #TrendReversal #SupportZones
ANET new positionStarted a feeler position in ANET today with 110 shares. Sold a low delta covered call and added a CSP on the monthly a bit lower. I believe this will be the range of interest here. I wanted to slowly diversify a bit away from small caps as I have made a lot on the risk account the last two years. Arista is heavily positioned to benefit from energy, cloud, and Ai expansion and it has some of the best growth financials I have ever seen.
My plan:
Repeat covered calls at a lower delta to capture share appreciation.
Buy 100 more shares if it gets closer to 100 and continue to sell CSP

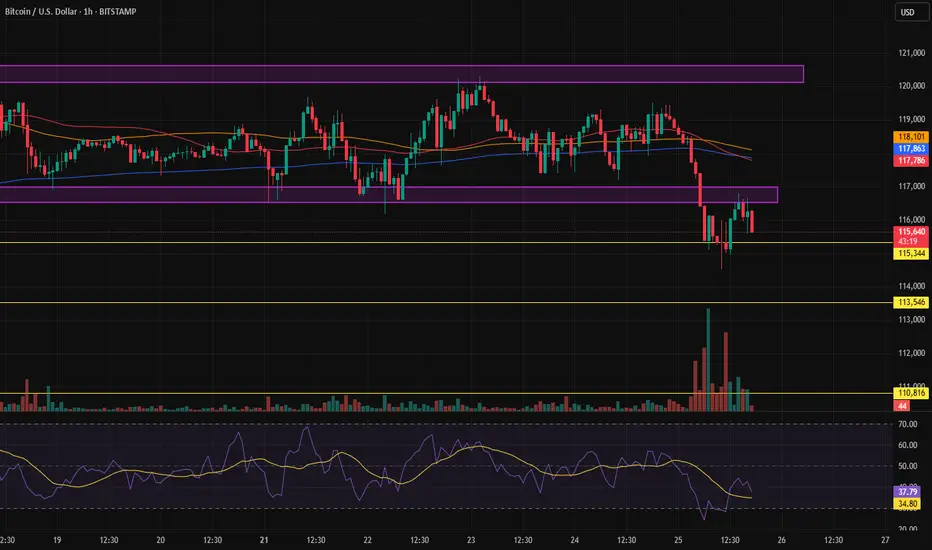
The sell trigger for Bitcoin is being activated.After breaking out of the channel and pulling back to the lower boundary (previous support) of the channel, we expect the price to decline.
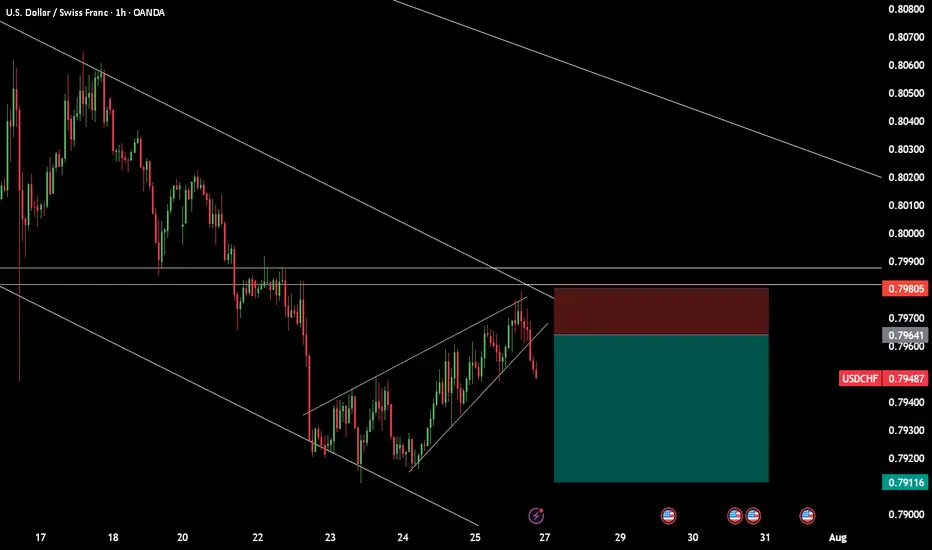
USDCHFPossible move to the down side. Waiting for a retracement around the 0.79650 zone before we go short.
@musehanezwothe
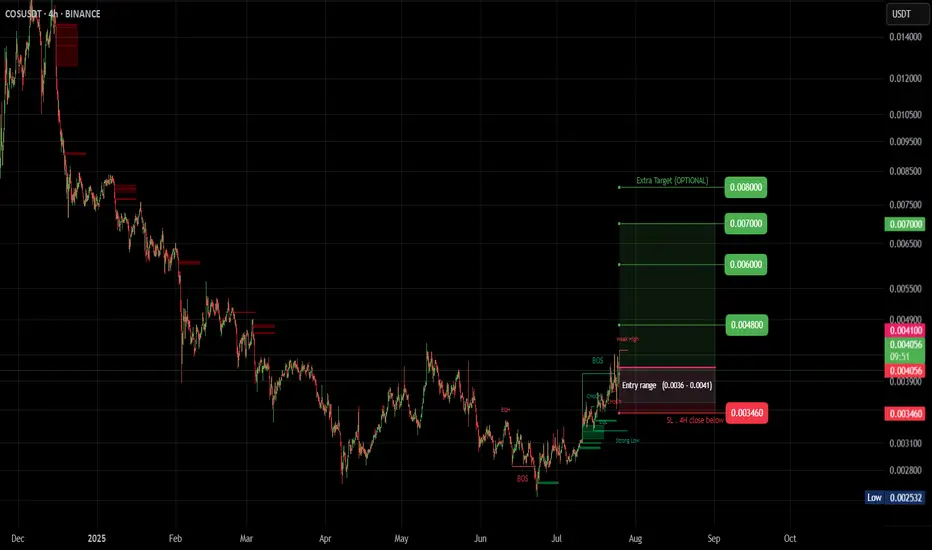
COS (SPOT)BINANCE:COSUSDT
#COS/ USDT
Entry (0.0036 - 0.0041)
SL 4H close below 0.003460
T1 0.0048
T2 0.0060
T3 0.0070
Extra Target
T4 0.0080
_______________________________________________________
Golden Advices.
********************
* collect the coin slowly in the entry range.
* Please calculate your losses before the entry.
* Do not enter any trade you find it not suitable for you.
* No FOMO - No Rush , it is a long journey.
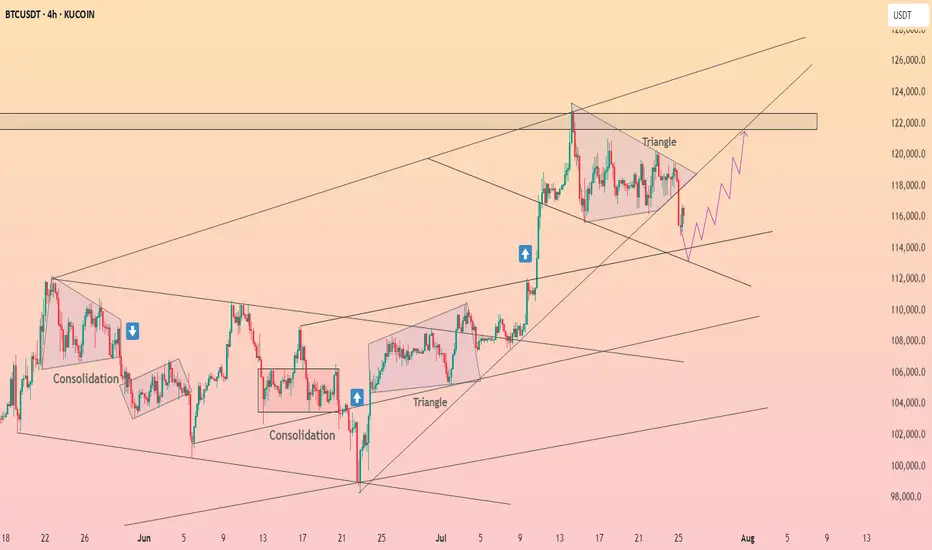
demand and supply strategybuy opportunity setup on BTC
the buyers are taking control in the market and i believe its making a way for a buy opportunity
apply risk management and be safe

USDJPY Under Pressure! SELL!
My dear subscribers,
My technical analysis for USDJPY is below:
The price is coiling around a solid key level - 147.83
Bias - Bearish
Technical Indicators: Pivot Points High anticipates a potential price reversal.
Super trend shows a clear sell, giving a perfect indicators' convergence.
Goal - 147.34
My Stop Loss - 148.12
About Used Indicators:
By the very nature of the supertrend indicator, it offers firm support and resistance levels for traders to enter and exit trades. Additionally, it also provides signals for setting stop losses
Disclosure: I am part of Trade Nation's Influencer program and receive a monthly fee for using their TradingView charts in my analysis.
———————————
WISH YOU ALL LUCK

Bitcoin is correcting ┆ HolderStatBINANCE:BTCUSDT compresses inside a triangle between $132K and $137K. Breakout above $137K could initiate a run toward $143K. Breakdown exposes $132K. Watch for decisive move.
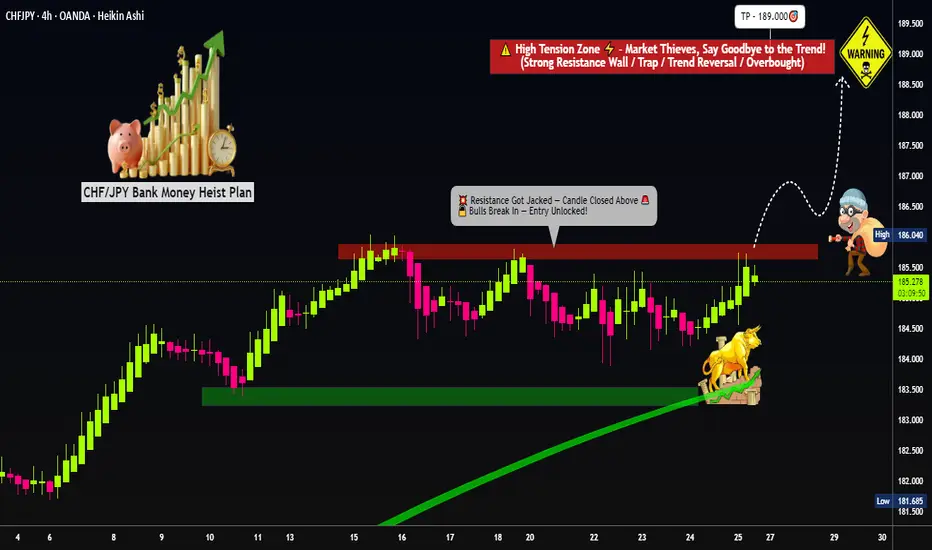
"Master Plan to Rob CHF/JPY – Breakout Trading Idea"💣CHF/JPY Forex Heist: Swiss vs Yen 🔥Master Robbery Plan Unfolded!
🌟Hi! Hola! Ola! Bonjour! Hallo! Marhaba!🌟
Dear Money Makers, Bandits & Chart Pirates 🤑💰💸✈️
It's time to reload your gear and lock in the blueprint. Based on our 🔥Thief Trader Technical + Fundamental Intelligence🔥, we’re all set to ambush the CHF/JPY "Swiss vs Yen" battlefield. This ain’t no casual walk—it’s a full-scale market operation targeting the High Voltage Reversal Trap Zone⚡. The pressure is real: Overbought, Tricky Consolidation, and Bears camping at resistance. Your job? Steal profits before they smell the breakout! 🏆💪💵
🎯 Entry Point — "Let the Heist Begin"
🗝 Entry Level: Wait for the Breakout @ 186.000. When price shatters the Moving Average ceiling—that's your greenlight!
🚀 Execution Choices:
Place Buy Stop above the breakout point
Or, use Buy Limit Orders near recent swing highs/lows on the 15/30-min chart using Layering/DCA tactics (that’s how the real thieves sneak in 🕶️).
🔔 Set an alert to stay sharp—don’t miss the vault crackin’ open!
🛑 Stop Loss — “Cover Your Escape”
🎯 SL Level: Just under the recent swing low on the 4H timeframe (around 184.000)
🚫 Never place the SL before the breakout confirms! Let the move prove itself first.
🧠 SL sizing depends on your capital, lot size, and number of entries stacked. You control the risk, not the other way around!
🎯 Target — "Cash Out or Vanish"
💎 First Take-Profit: 189.000
🚪Optional Escape: Secure the bag early if momentum fades. Better leave rich than be late!
👀 For Scalpers & Swing Robbers Alike
🔍 Scalpers: Only ride the Long wave.
💼 Big pockets? Hit straight entry.
👟 Small capital? Tag in with swing trades and trail that SL like a pro.
🎣 Use a Trailing SL to lock profits as price sprints toward resistance.
📰 The Bigger Picture: Why CHF/JPY?
The pair is pumped by:
📈 Macro Economics
📊 Quant Analysis
📰 COT Reports
📉 Intermarket Correlations
🧠 Sentiment Heatmaps
🔥 Future Price Dynamics
Don’t pull the trigger blind. Read the battlefield before charging in.
⚠️ Thief’s Caution Zone: News Traps Ahead
🛎 News = chaos.
📌 Avoid entering fresh trades during major data drops.
🔐 Use Trailing SLs to protect ongoing plays.
📉 Let the market dance, but you control the music.
💥Hit the Boost Button!💥
If this heist plan pumps your portfolio, smash that boost. That’s how we fund more blueprints, fuel the Thief Gang’s vault, and keep the robbery cycle alive.
🤑💵 Together, let’s rob this market clean—Thief Style.
New plan drops soon. Stay locked. Stay sharp. Stay profitable.
🧠💰🏴☠️
— Thief Trader Out 🐱👤🔓🚀
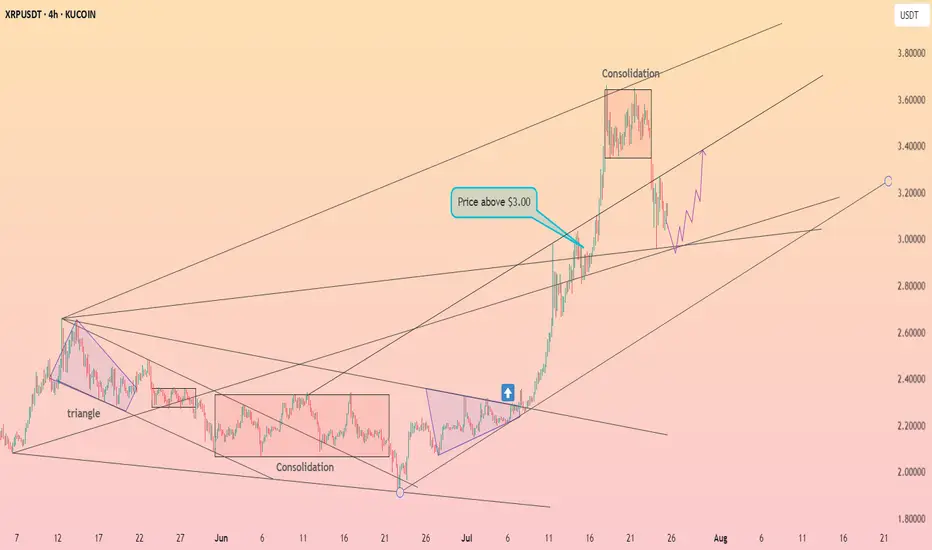
XRP stays above $3 ┆ HolderStatBYBIT:XRPUSDT is printing higher lows into the $3.44 resistance. Breakout could activate $3.60 target. Watch $3.30–$3.28 for possible pullbacks. Bullish pressure mounting.
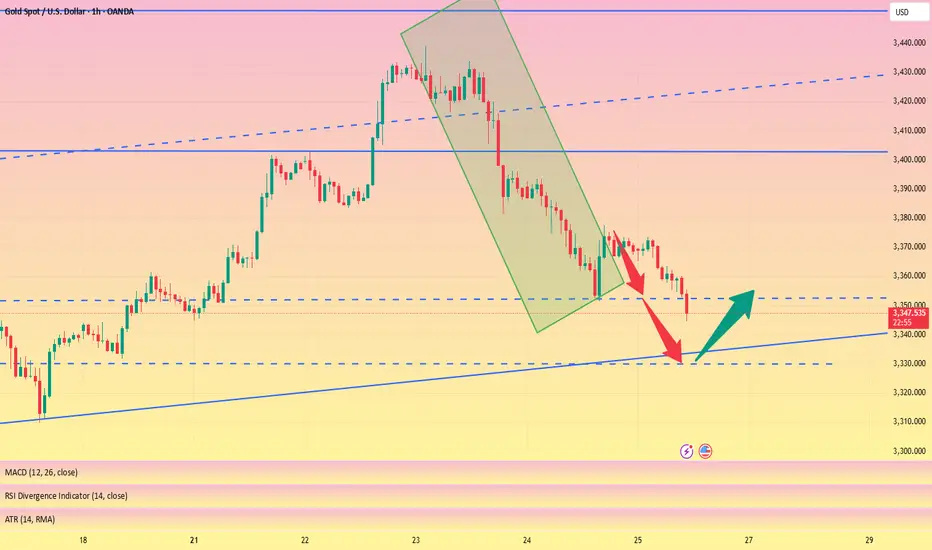
Wait for 3330 to buy the bottom and reduce unnecessary operation#XAUUSD
We have made good profits from short selling yesterday. Currently, gold has fallen to 3350📎. The 4HMACD death cross has increased in volume and is expected to continue to decline. Consider going long near 3330📈. I don’t think it is prudent to bottom out at 3340. Move forward steadily on Friday and reduce unnecessary operations⚖️.
🚀 BUY 3335-3330
🚀 TP 3345-3362
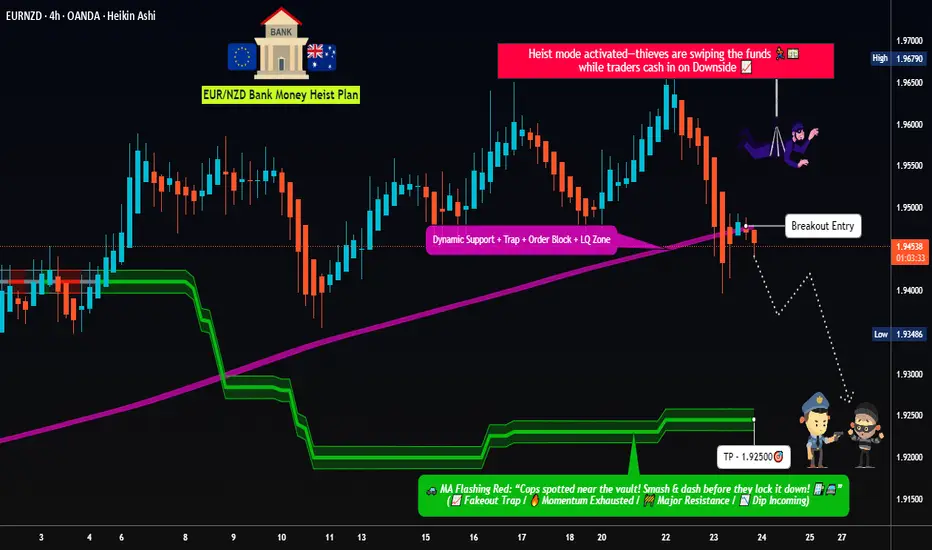
Dynamic Entry Alert – EUR/NZD Bearish Heist Execution!💣 EUR/NZD Robbery Blueprint: The Kiwi Vault Bearish Heist Plan 💰🕵️♂️
🌟Hi! Hola! Ola! Bonjour! Hallo! Marhaba!🌟
Dear Money Makers & Robbers, 🤑💰✈️
This ain't your usual trading tip — it’s a Thief Trading Masterstroke 🎯. We're gearing up for a high-stakes heist on the EUR/NZD forex market. Time to crack open the Kiwi vault and rob those bullish bandits blind! 😼💣
🧠 Strategic Mindset:
🔍 We're targeting the oversold consolidation zone. Bullish traders think they’re safe? Think again. This area is a trap — the perfect bait for our bearish ambush. Expect trend reversal vibes, layered with juicy liquidity grabs.
🕵️♂️ Entry Plan:
🎯 Sell Entry Trigger: Wait for a clean break below 1.94500.
💣 Setup:
Place Sell Stop Orders below the MA Support Breakout
Or... go stealth: Sell Limit Orders at nearest swing highs (15m or 30m timeframe)
Use DCA / Layering Method for multiple entries (scalp or swing tactics)
📌 Set your Alert 🚨 — no breakout, no entry. Patience pays.
🛑 Stop Loss Strategy (SL):
No premature moves! Don’t place that SL till we get the confirmed break.
🔥 SL Recommendation:
Just above 1.95700 (4H candle wick swing high)
Adjust based on lot size and number of layers
📍 Remember, the market’s a jungle — stay sharp or get sliced.
🎯 Take Profit (TP):
💵 Target Zone: 1.92500
(But hey, escape early if the vault starts shaking. Protect your gains like a pro.)
📊 Macro Intel – Why This Works:
This isn’t random — it's backed by our 🔥 combo of:
COT Reports
Sentiment Analysis
Quant/Algo Bias
Intermarket Correlation
Fundamental + Technical Confirmation
📌 You can dig deeper — but trust me, this setup’s been scouted like a pro job.
⚠️ Risk Protocols:
Avoid entries during high-impact news
Use Trailing SLs to lock in the loot
Adjust position size to suit your personal bankroll & risk appetite
🔥 Final Word from the Thief:
Smash that 💥Boost Button💥 if you're vibing with the heist plan!
Support the squad, stay profitable, and rob the market — legally, of course.
We don’t trade, we infiltrate.
We don’t predict, we execute.
📡 Stay tuned… More robbery blueprints coming soon!
🤑🐱👤🚨💸💪 #ThiefTrader #ForexHeist #EURNZDShortPlan
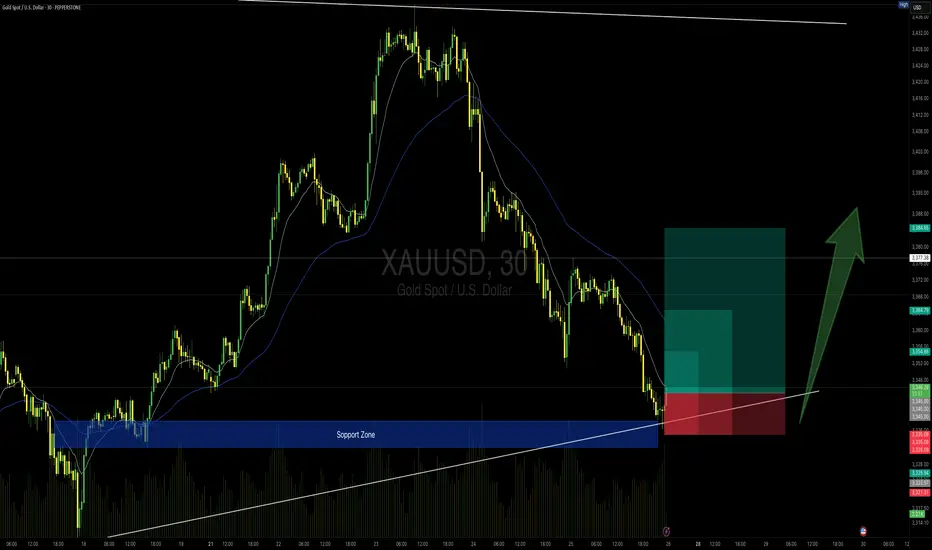
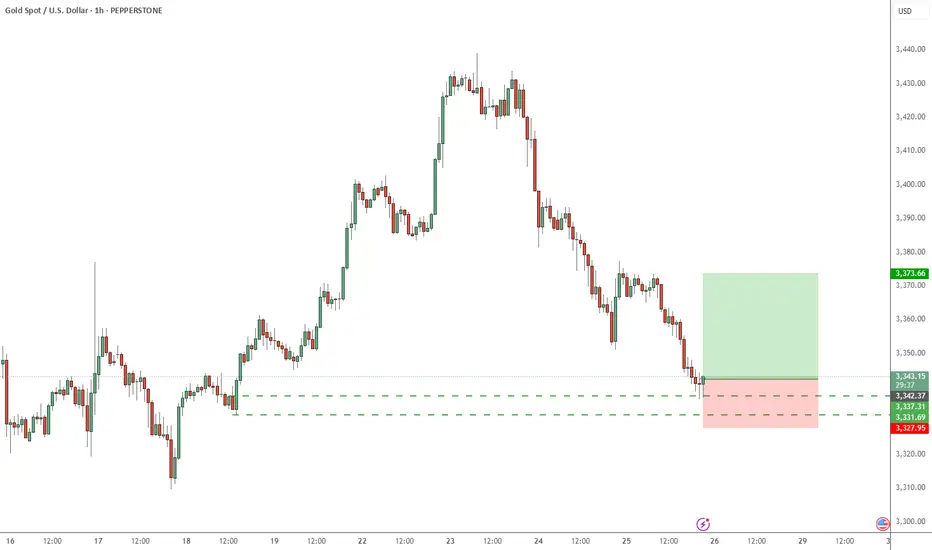
GOLD 30min Buy Setup (High Risk - High Reward)📍 TVC:GOLD 30min Buy Setup – MJTrading View
After an extended bearish leg, price has tapped into a strong support zone that previously acted as a launchpad. Also touching the main Uptrend...
We now see initial signs of absorption with potential reversal setup forming just above the ascending trendline.
🔹 Entry Zone: 3344–3346
🔹 SL: Below 3335 (under structure & wick base)
🔹 TP1: 3355
🔹 TP2: 3365
🔹 TP4: 3385+ (if momentum sustains)
🔸 RR: Up to 1:4 depending on target selected
🧠 Context:
– Still inside broader bullish structure (macro HL)
– Support zone coincides with rising trendline
– Potential for bullish reaccumulation after sharp drop
– Volume spike near zone suggests active buyers
Stay sharp and manage your risk please...
See the below Idea for full concept:
"Support isn't just a level — it’s a battlefield. If buyers win, they don’t look back."
#MJTrading #Gold #BuySetup #PriceAction #SmartMoney #ChartDesigner #ReversalSetup #MarketStructure
Psychology Always Matters:
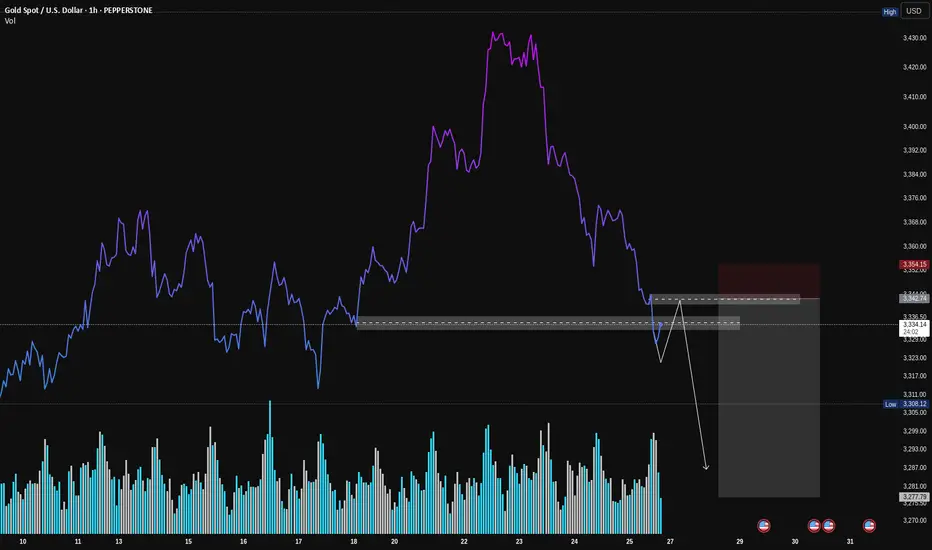
Gold (XAU/USD): A Classic VSA Short Setup in PlayHey Traders,
Following up on the general weakness we discussed in Gold, here's a closer look at a specific trade setup that's unfolding right now. This is a textbook example of a high-probability short setup according to Volume Spread Analysis (VSA).
Let's break down the story the volume is telling us.
1. The Breakdown: Sellers Show Their Hand
First, look at how the price broke down hard through that support level (the grey box). Notice the volume on that sharp drop? It was high. This is our clue that sellers are strong and in control. They had enough power to smash right through a level that was previously holding the price up.
2. The Retest: Buyers Don't Show Up
Now, the price is creeping back up to that same exact level. But here's the most important clue: look at the volume on this rally. It's much lower than the volume on the breakdown.
This is what VSA calls a "No Demand" rally. It’s like the market is trying to push a car uphill without any gas. It tells us that strong buyers (the "smart money") have no interest in buying at these prices.
3. The Setup: Selling into Weakness
This combination creates a classic short setup:
Logic: We are looking to sell at a level where old support has flipped into new resistance.
Confirmation: The low volume on the retest confirms the rally is weak and likely to fail.
How to Potentially Trade It
The grey box represents a high-probability entry zone. To time an entry, you could watch for a clear rejection signal right inside this zone. For example:
A "rejection candle" (like a pin bar) that pushes into the zone but gets slammed back down.
An up-bar with a tiny body and very low volume, showing buyers are completely exhausted.
Seeing one of these signs would be the final confirmation that sellers are about to take back control.
Conclusion:
This is a powerful setup because all the pieces line up: the background is weak, sellers have shown their strength, and buyers are now showing no interest at a key resistance level.
Disclaimer: This is my personal analysis using VSA and is for educational purposes only. It is not financial advice. Always do your own research and manage your risk. Good luck, traders!

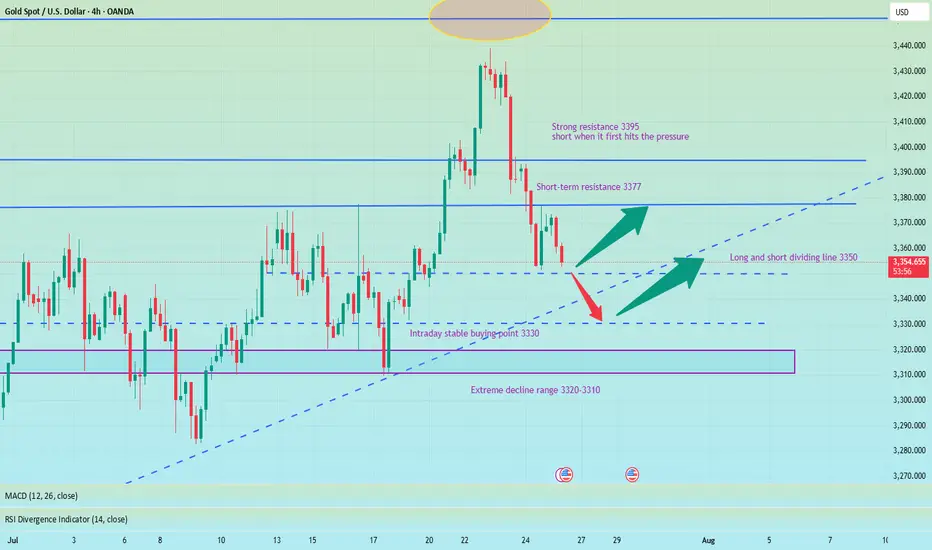
Be alert to new lows, pay attention to 3350 and go long at 3330📰 News information:
1. Tariff issues
2. Next week's NFP data
📈 Technical Analysis:
Last night, gold rebounded to only around 3377 before starting to fall back. Our judgment that the current rebound is weak is completely correct. 3350 is the support point of the bottoming out and rebounding to nearly $20 last night. Whether the European session can go down to 3350 will determine the trend of gold.
From the daily chart, the daily line has fallen for two consecutive days, suggesting that the price may continue to fall today. At present, we need to pay attention to this week's starting point of 3344-3345, and then the 3330 line below. The extreme decline is 3320-3310. At the same time, the narrowing of the daily Bollinger Bands is also paving the way for next week's NFP data.
From the 4H chart, the current MACD indicator crosses and increases in volume, and the middle track of the Bollinger Bands and SMA30 basically overlap near 3388. As for the hourly chart, the upper pressure is mainly concentrated near 3375-3377, which is also the high point of the rebound last night. If gold rebounds directly upward and encounters pressure and resistance at 3375-3385 for the first time, you can consider shorting and strictly implement stop loss.
Overall, if the current market falls to 3350-3345 for the first time and gets effective support, you can consider going long with a light position, defend 3340, and look to 3356-3362; if the decline is strong and continues to fall below 3350, the best stable long point for the day is 3330-3320, defend 3310, and earn $10-20 to leave the market.
🎯 Trading Points:
BUY 3350-3345
TP 3356-3362
BUY 3330-3320
TP 3345-3360
In addition to investment, life also includes poetry, distant places, and Allen. Facing the market is actually facing yourself, correcting your shortcomings, facing your mistakes, and exercising strict self-discipline. I share free trading strategies and analysis ideas every day for reference by brothers. I hope my analysis can help you.
TVC:GOLD PEPPERSTONE:XAUUSD FOREXCOM:XAUUSD FX:XAUUSD OANDA:XAUUSD FXOPEN:XAUUSD
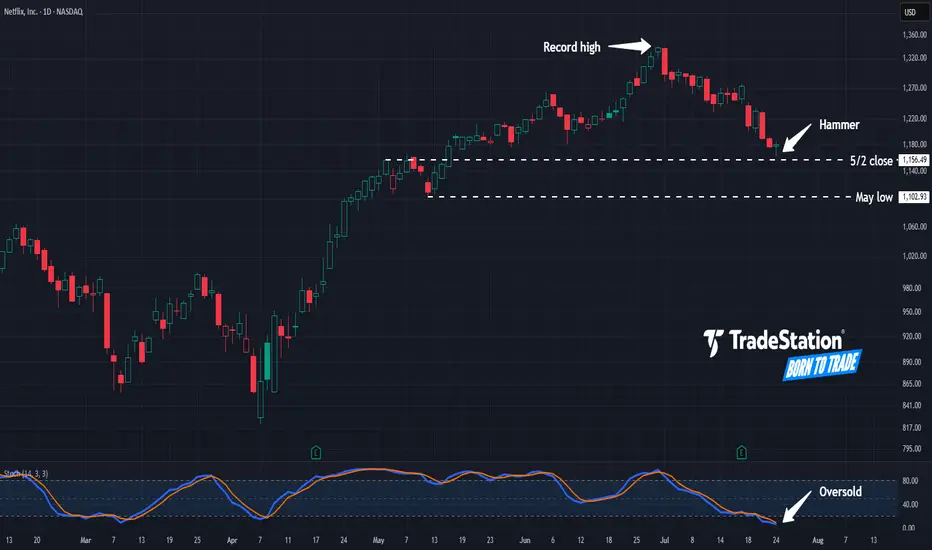
Hammer in NetflixNetflix has pulled back from record highs, and some traders may see potential opportunities in the streaming video giant.
The first pattern on today’s chart is the $1,156.49 level. It was a weekly close on May 2 and near the high the following week. NFLX is now showing signs of potential stabilization near that level. Is new support emerging?
Second, prices hit their lowest level in more than two months yesterday but rebounded. The resulting hammer candlestick pattern may be viewed as a bullish reversal pattern.
Third, stochastics have fallen to oversold territory.
Fourth, if the potential support at $1,156.49 breaks, traders may next eye the May low of $1,102.93.
TradeStation has, for decades, advanced the trading industry, providing access to stocks, options and futures. If you're born to trade, we could be for you. See our Overview for more.
Past performance, whether actual or indicated by historical tests of strategies, is no guarantee of future performance or success. There is a possibility that you may sustain a loss equal to or greater than your entire investment regardless of which asset class you trade (equities, options or futures); therefore, you should not invest or risk money that you cannot afford to lose. Online trading is not suitable for all investors. View the document titled Characteristics and Risks of Standardized Options at www.TradeStation.com . Before trading any asset class, customers must read the relevant risk disclosure statements on www.TradeStation.com . System access and trade placement and execution may be delayed or fail due to market volatility and volume, quote delays, system and software errors, Internet traffic, outages and other factors.
Securities and futures trading is offered to self-directed customers by TradeStation Securities, Inc., a broker-dealer registered with the Securities and Exchange Commission and a futures commission merchant licensed with the Commodity Futures Trading Commission). TradeStation Securities is a member of the Financial Industry Regulatory Authority, the National Futures Association, and a number of exchanges.
Options trading is not suitable for all investors. Your TradeStation Securities’ account application to trade options will be considered and approved or disapproved based on all relevant factors, including your trading experience. See www.TradeStation.com . Visit www.TradeStation.com for full details on the costs and fees associated with options.
Margin trading involves risks, and it is important that you fully understand those risks before trading on margin. The Margin Disclosure Statement outlines many of those risks, including that you can lose more funds than you deposit in your margin account; your brokerage firm can force the sale of securities in your account; your brokerage firm can sell your securities without contacting you; and you are not entitled to an extension of time on a margin call. Review the Margin Disclosure Statement at www.TradeStation.com .
TradeStation Securities, Inc. and TradeStation Technologies, Inc. are each wholly owned subsidiaries of TradeStation Group, Inc., both operating, and providing products and services, under the TradeStation brand and trademark. When applying for, or purchasing, accounts, subscriptions, products and services, it is important that you know which company you will be dealing with. Visit www.TradeStation.com for further important information explaining what this means.
Now We WaitTrading Fam,
In my last video, I mentioned how I had been learning to trade more patiently, giving myself those high-quality, high-probability winning trades. This is a perfect time to illustrate that strategy.
With our altcoin market overheated, I am expecting more rest, accumulation, and pullback in many of our alts. The selection of even decent entries is very slim. It's time for us to sit back, wait, and let the trades come to us again.
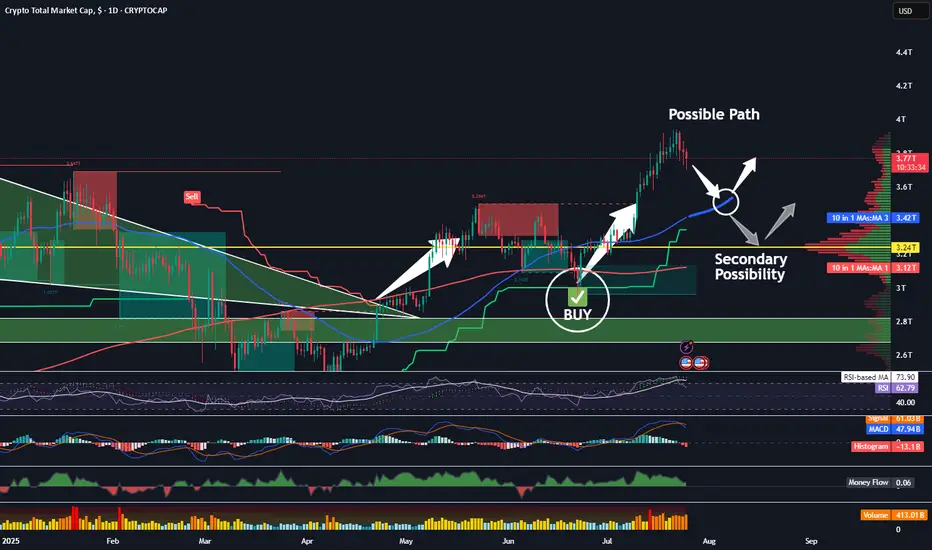
The TOTAL chart shows us more clearly what may occur. Let's discuss a few important indicators on this chart.
First of all, we see my indicator popped a BUY signal right around 3T. We had a safe bet at that point; we were going to see quite a bit of buying action in the altcoin space. Indeed, we did. The altcoin market increased by about 25 percent and went all the way to 4T, at which point the sellers came back in. Now, we are in the middle of a little bit of a pullback, and I think there could be more to come. I am expecting at least a touch of that rising 50-day SMA, currently at 3.4T.
Supporting my thesis here are the crossover of the RSI to the downside of its 14-day MA, the MACD cross, the Chalkin money flow decrease, and the HMV indicating high volume during these sell-offs. Leverage is being liquidated. This is healthy!
It is possible that the total market cap could drop even further, all the way down to that 3.24T PoC on the VRVP. That is where we see most of our volume in alts has occurred. Keep these two targets in mind. Once hit, I will begin looking for more trade entries once again.
✌️Stew