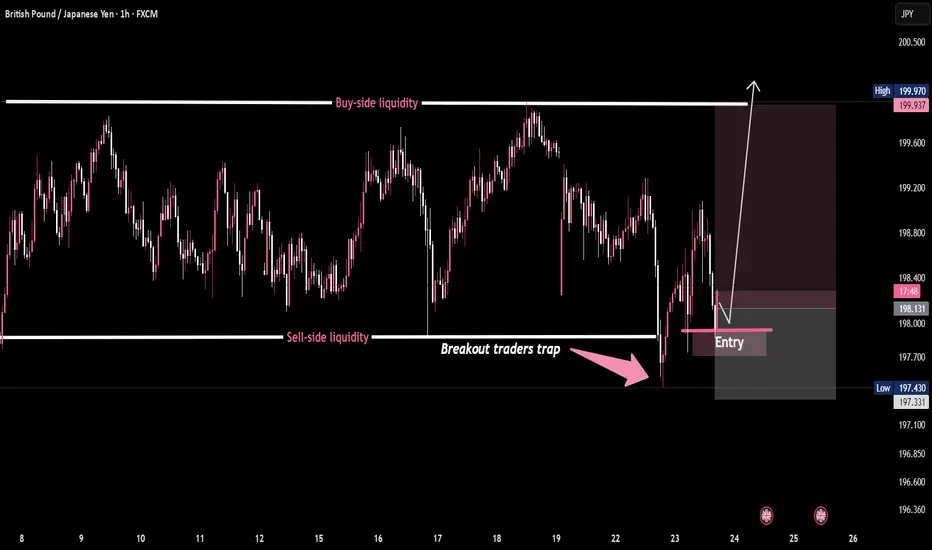
GBP/JPY - Classic Breakout Trap in PlayPrice nuked below range lows to sweep sell-side liquidity, trapping breakout sellers.
Smart money scooped it up. Entry reclaimed — now eyeing buy-side liquidity above 🎯
This is how the game is played:
1️⃣ Liquidity grab
2️⃣ Breakout trap
3️⃣ Reclaim & reverse
4️⃣ Target resting orders up top 🚀
📈 GBP/JPY – Classic Breakout Trap in Play 🧠💥
Community ideas
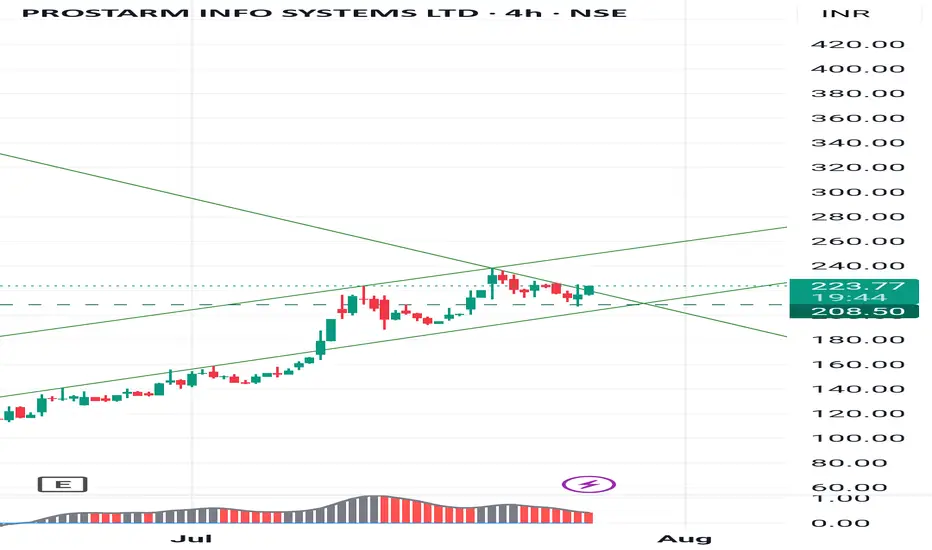
Prostarm : go long with support of 208There is a great move in Prostarm : go long with support of 208, enter 220-216. Stock is making higher high pattern which may result a upper side moves..
It may hit 230 in coming days.
Stay cautious with levels.
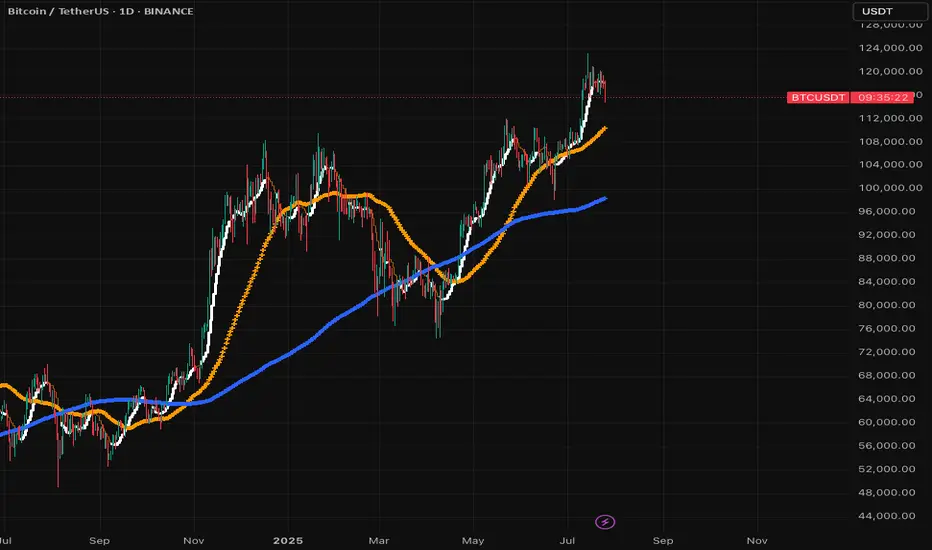
Short-term BITCOIN analysisShor-term
In my opinion, Bitcoin could make a move towards $113,000-115,000 and then start moving upwards. In any case, according to previous analysis and apart from short-term fluctuations, it could touch the target of $140,000-150,000.
Good luck
NEoWave Chart

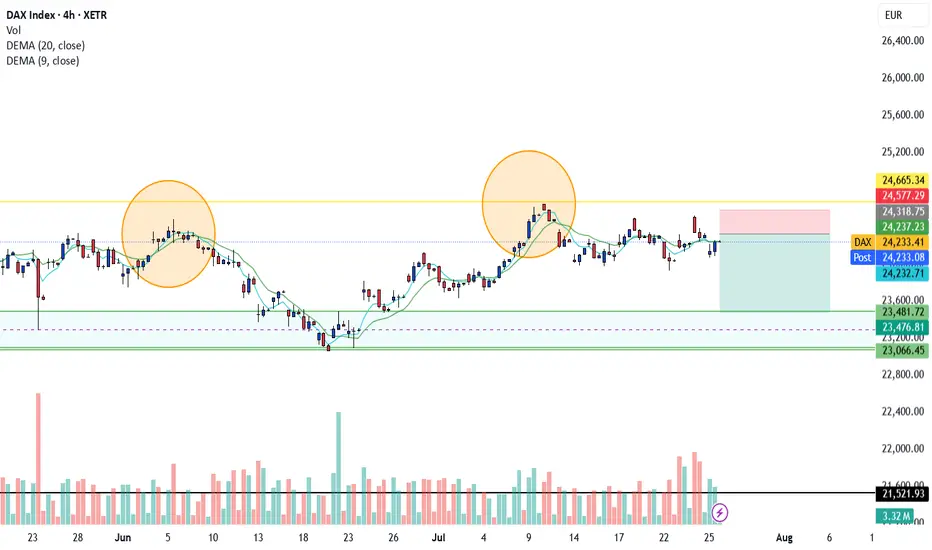
DAX Bearichthe complete set up shoxs that Dax is ranging inside the internal zone , creating a double top on the 4H time frame, witing for the smal trigger to short the position

BTC- New ATH?BTCUSDT – Potential Reversal from CME Gap Support
Bitcoin is currently trading around a key demand zone aligned with a CME gap between ~$115,272 and $114,000. Price recently swept local lows with increased volatility and is showing signs of absorption just above the 0.382 Fibonacci retracement ($113,660), which adds confluence to the area.
If BTC continues to hold above this zone and shows volume confirmation, I expect a strong bullish reaction. This move could initiate a rally toward the previous high and potentially lead to a breakout to new all-time highs (ATH), as outlined in the red projected path.
Key levels- LQ, Fibbo 0.382, CME gap - futures

#DOGE/USDT falling wedge#DOGE
The price is moving within a descending channel on the 1-hour frame and is expected to break and continue upward.
We have a trend to stabilize above the 100 Moving Average once again.
We have a bearish trend on the RSI indicator, supporting the upward break.
We have a support area at the lower boundary of the channel at 0.22270, acting as strong support from which the price can rebound.
We have a major support area in green that pushed the price upward at 0.21777.
Entry price: 0.2320
First target: 0.24210
Second target: 0.25380
Third target: 0.26920
To manage risk, don't forget stop loss and capital management.
When you reach the first target, save some profits and then change the stop order to an entry order.
For inquiries, please comment.
Thank you.

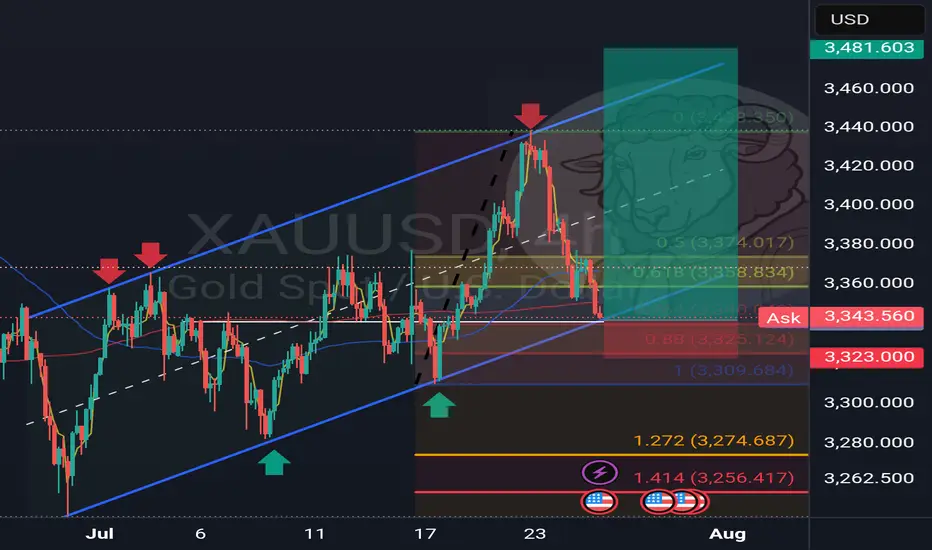
Gold to Take Support Gold at key support level, There is two chances.. where it can grab the liquidity... we will wait and watch... Cheers

GOLD (XAUUSD): Bullish Move Ahead?!
I think that Gold is going to rise soon.
The price is now entering a strong demand area
based on a horizontal support and a rising trend line.
The price may pull back to 3376 level.
❤️Please, support my work with like, thank you!❤️
I am part of Trade Nation's Influencer program and receive a monthly fee for using their TradingView charts in my analysis.

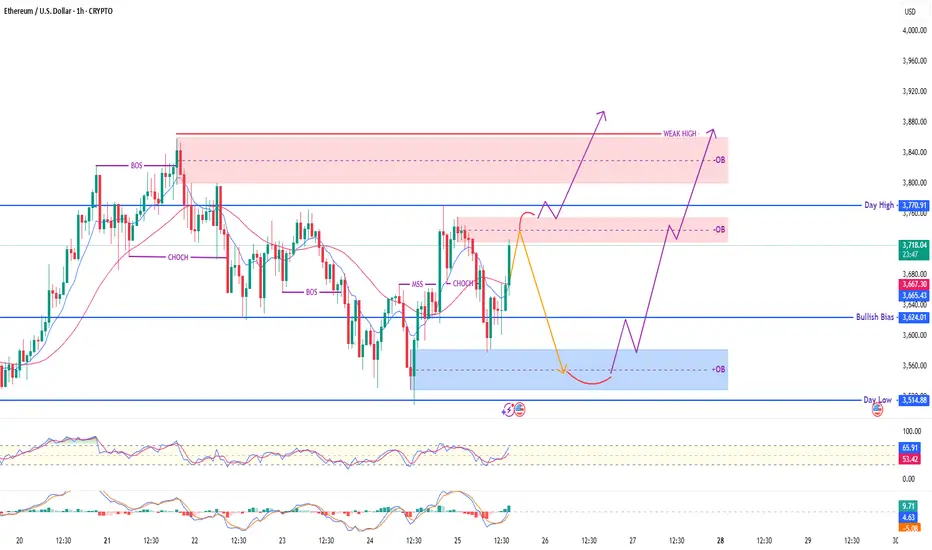
Ethereum / USD – 1H Smart Money Outlook🔹 Current Price: $3,718
🔹 Key Zones:
🔴 Supply Zone (OB): $3,770 – $3,850 (Weak High)
🔵 Demand Zone (OB): $3,540 – $3,600
⚠️ Bullish Bias Level: $3,624
🔹 Day High / Low: $3,770.91 / $3,514.88
🧠 Market Structure Overview:
✅ CHoCH → MSS confirmed bullish intent
✅ Price reclaimed structure above EMA
🔁 Price may react at supply zone, retrace to demand, then rally
📈 Scenario Outlook:
Bearish Rejection from OB Zone:
🔸 Price taps OB → drops to demand (blue zone)
🔸 Bullish reaction expected at deep discount zone
Direct Bullish Breakout:
🔸 Clean breakout above weak high → potential for trend continuation
🧠 Smart Money Notes:
BOS + CHoCH + MSS confirms internal liquidity shifts
OB zones respected repeatedly = high reaction probability
RSI overbought → short-term pullback likely
📊 Indicators:
RSI: 65.99 (Approaching overbought)
MACD: Bullish crossover
EMA Crossover: Bullish
✅ Bias: Bullish
🕰️ Timeframe: 1H
🔍 Strategy: Wait for discount entry or bullish breakout
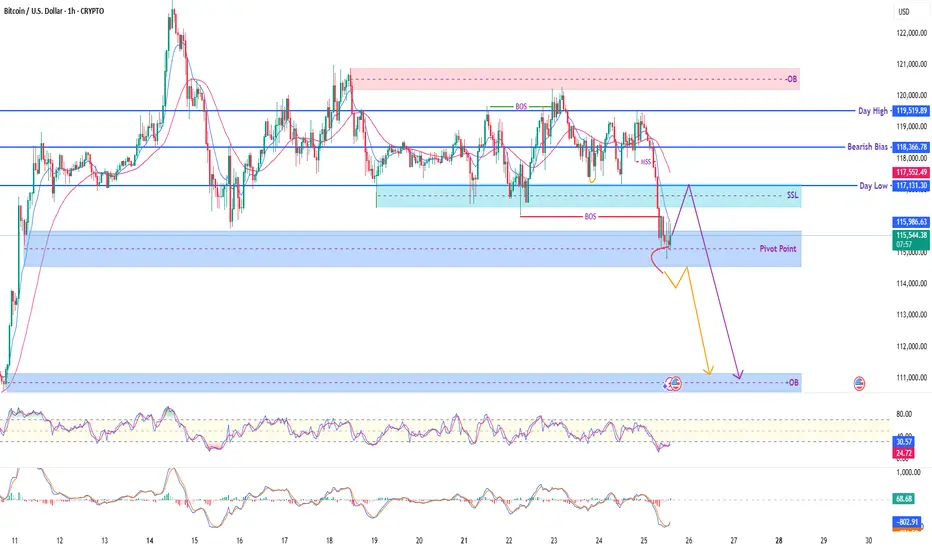
Bitcoin / USD – 1H Smart Money Outlook🔹 Current Price: $115,549
🔹 Key Zones:
🔴 Supply OB (Resistance): $119,500 – $121,000
🔵 Demand OB (Target Zone): $111,000 – $112,000
🔻 Bearish Bias: Below $118,366
⚠️ Pivot Point: $115,987
🔹 Day Low: $117,131 | Day High: $119,519
🧠 Market Structure Overview:
❌ BOS + MSS indicates internal weakness
🔁 Price rejected key resistance (OB) and shifted structure bearish
🔹 SSL (Sell-Side Liquidity) near $117,000 likely to be targeted
📉 Expected Scenario:
Retracement to SSL / Pivot → Continuation Drop
Possible minor bullish pullback but overall structure favors downside
📊 Indicators:
RSI: Bearish divergence zone (30.70)
MACD: Bearish momentum building
Price trading below EMA
✅ Bias: Bearish
🕰️ Timeframe: 1H
🎯 Plan: Look for short setups on retracement toward SSL / OB
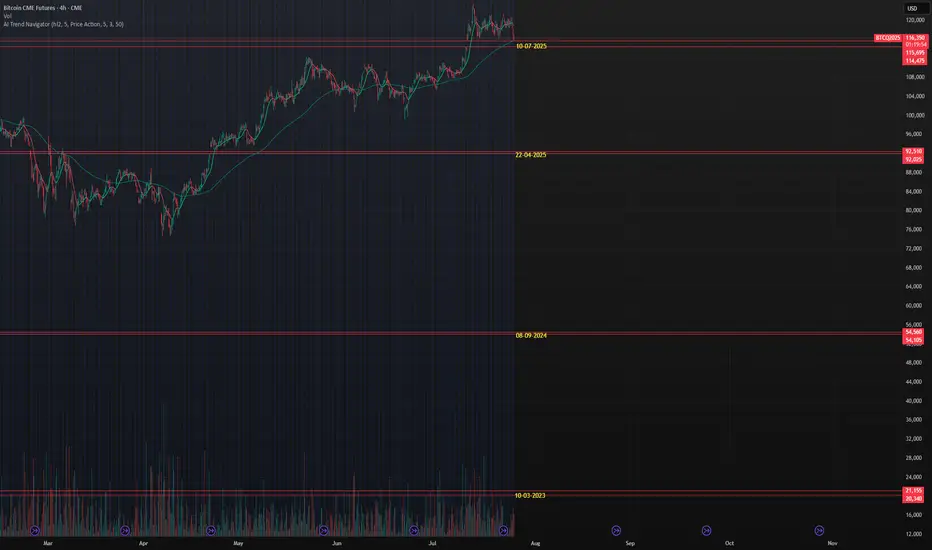
CME Gaps, which will be filled?Currently 4 gaps in the CME futures chart, running back till 2023 (march). What gap will be filled at some point in the future or will some remain open....
USDCHF Broke the Trendline resistance, what about Fib 0 .5? USDCHF was trading in downward and recently it has Broken the trendline resistance and price is currently at 0.5 fib will it reject form here again ? or fib 0.5 will be broken after correction and further growth ?

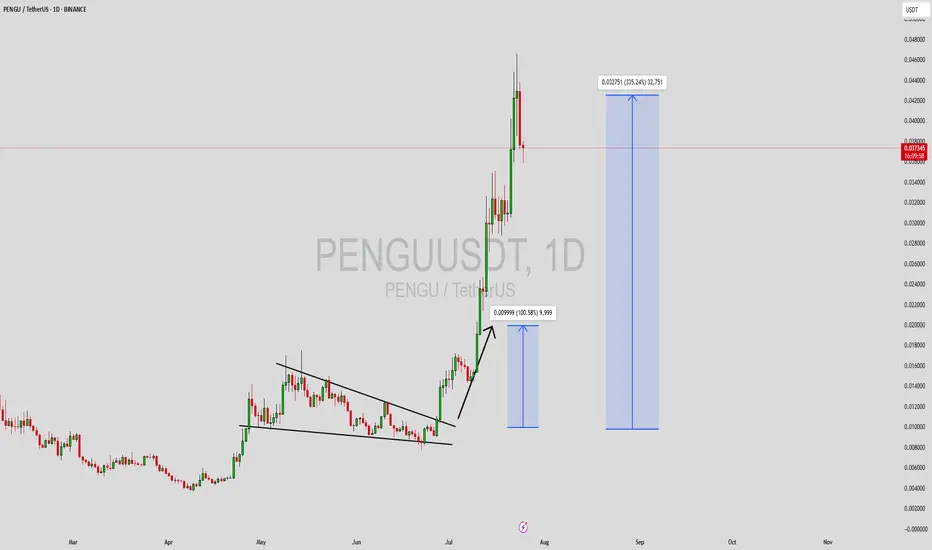
PENGUUSDT Forming Falling WedgePENGUUSDT has recently formed a classic falling wedge pattern on the chart—a well-known bullish reversal structure that often precedes explosive upward price movements. As the wedge narrows and consolidates, it typically signals a decline in selling pressure, preparing for a significant breakout. In PENGU's case, this technical setup, paired with increasing volume, points toward a potentially massive upside of 300% to 350% or more, making it one of the most closely watched low-cap altcoins right now.
This crypto project has been attracting fresh investor interest across various social platforms and trading forums, signaling growing awareness and community engagement. The technical pattern aligns with recent shifts in market sentiment, and volume confirmation during the breakout would provide further confidence to traders. Historically, such setups in meme and low-cap community tokens have led to sharp rallies once momentum builds up, particularly when backed by enthusiastic investor sentiment.
Market conditions currently favor altcoin breakouts, and PENGU appears to be positioning itself for a parabolic move. Traders looking for high-risk, high-reward plays may find this pair especially attractive, given the technical clarity and strong accumulation signals seen at current levels. The confluence of pattern breakout, solid volume, and social buzz could create a perfect storm for significant upside.
As always, risk management is key, but the setup offers a compelling technical opportunity worth watching closely in the coming days. A confirmed breakout above resistance could kickstart the rally and attract further retail and speculative flow.
✅ Show your support by hitting the like button and
✅ Leaving a comment below! (What is You opinion about this Coin)
Your feedback and engagement keep me inspired to share more insightful market analysis with you!
Head & Shoulders Pattern Confirmed bearish sign A clear Head and Shoulders pattern has formed on the 4H timeframe, and confirmation is in place after a decisive break below the neckline around $39.00.
🔍 Technical Breakdown:
Left Shoulder: Formed around July 11–15
Head: July 19–23 peak
Right Shoulder: Developing through July 24–25
Neckline: ~$39.00 zone (now broken)
Current Price: ~$38.30
Target: ~$38.00 – $37.80 (based on pattern projection)
The break below the 50 EMA adds bearish confirmation. Caution is advised unless price reclaims the neckline level.

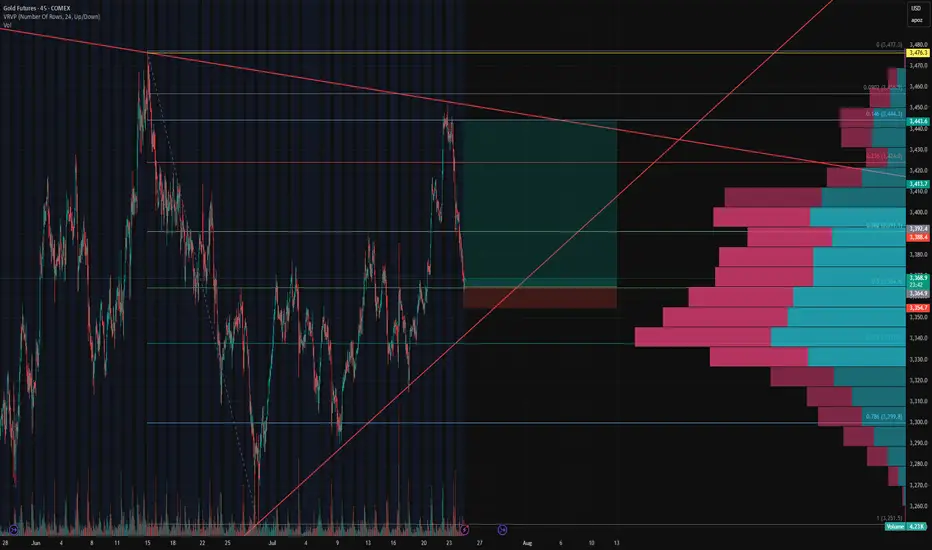
Gold Futures (GC1!) Long Setup – 0.5 Fib Bounce🟡 Gold Futures (GC1!) Long Setup – 0.5 Fib Bounce
After nailing the long from the bottom and perfectly shorting the top, we’re stepping back in for another calculated move.
📉 Price pulled back to the 0.5 Fibonacci retracement, aligning perfectly with the upward trendline support and a key HVN on the Volume Profile.
📈 Entered long at 3,365 with a tight stop below 3,354 (0.3% risk), targeting the descending trendline near 3,444 for a clean 7.7R setup.
🧠 Context:
Price reacted hard at resistance, but volume support and structure still lean bullish.
Clear invalidation if we break trend and lose 3,350 support cluster.
Let’s see if this bounce gets legs. 🚀
Double bottomDouble bottom with RSI regular divergency. It seems that buyers a willing to buy at this level again.

GOLD Drops $60 – Bearish Bias Holds Below 3365GOLD | OVERVIEW
As expected, gold continued its bearish momentum, dropping from the 3430 level and delivering a move of approximately $60.
For today, the bearish bias remains valid as long as the price stays below 3365, with potential targets at 3337 and 3320.
However, if the price reverses and stabilizes above 3365, it could signal a shift to bullish momentum.
Key Levels:
Support: 3355 · 3337 · 3320
Resistance: 3374 · 3388

BTC dropping like a brick....bound to happen sooner or laterHard drops follow big spikes. Happens every time, just look back in time. But this time it's different? Maybe to some extent, but as long as there are short term profit takers and insane volatility this trend will continue. Only 2 cents is to not SHORT SELL. You will only contribute to the potential squeeze and will lose money. If you're up now, your priority should be to retain value and sell before it goes down to it's next support level which is under 100k! Maybe it does or not, but the dips do happen and with automated trading bots it could hit more aggressively and faster. If anything, but the dip when there's sufficient support. Best of luck!