Looking like an immediate buy on IBM! OptionsMastery:
🔉Sound on!🔉
📣Make sure to watch fullscreen!📣
Thank you as always for watching my videos. I hope that you learned something very educational! Please feel free to like, share, and comment on this post. Remember only risk what you are willing to lose. Trading is very risky but it can change your life!
Community ideas

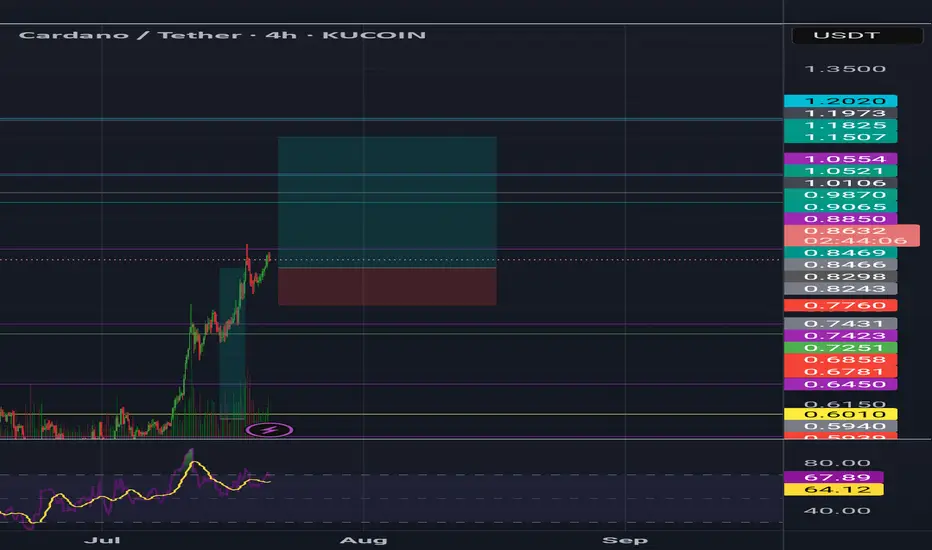
CardanoAda usdt Daily analysis
Time frame 4hours
Risk rewards ratio >4.3
Target =1.15$
Cardano is the Valuable asset in crypto market
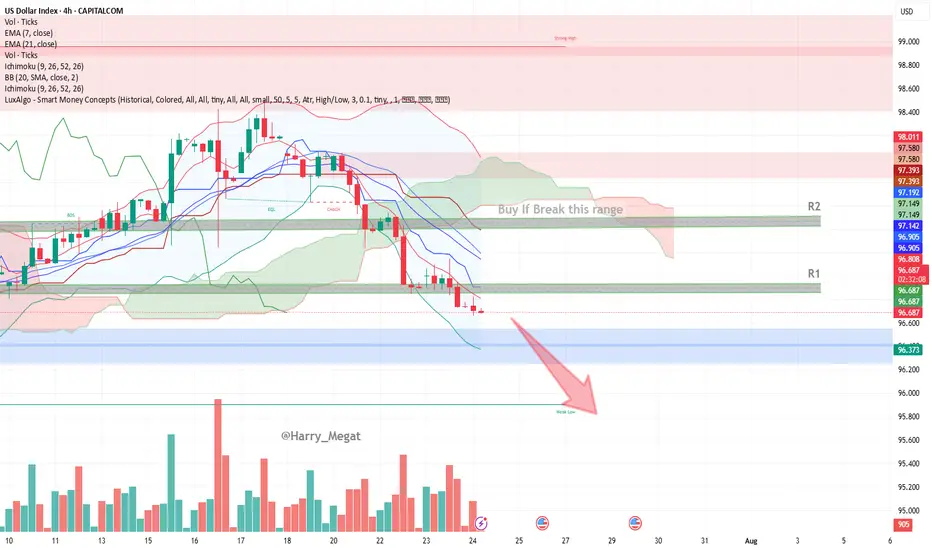
US Dollar Index (DXY) – 4H Chart AnalysisUS Dollar Index (DXY) – 4H Chart Analysis
**Current Trend:** Bearish
Price trades below EMAs, Ichimoku Cloud, and within a bearish channel.
#**Bearish Scenario (Favorable)**
* **Conditions:**
* Price remains below EMA 7 & 21
* Stays under Ichimoku Cloud and 96.812 resistance (R1)
* Lower lows forming, bearish momentum increasing
* **Confirmation:**
Break below **96.37 (blue zone)**
* **Target:**
* TP1: 96.00
* TP2: 95.60 (next weak support)
**Bullish Scenario (Reversal)**
* **Conditions:**
* Price must break above **96.81 (EMA 7 + resistance)**
* Break above **R1 → 96.90**, and then above **R2 → 97.14–97.19**
* Bullish candles close above the Ichimoku cloud
* **Confirmation:**
Break and retest of **97.20**
* **Target:**
* TP1: 97.39
* TP2: 97.58 (key structure)
* TP3: 98.00 (major resistance)
**Bias:** Bearish unless DXY breaks above **97.20** with strong volume and bullish structure.
USDCAD SELL TRADEOpportunity to sell on USDCAD
ENTRY: 1.36800
STOP LOSS: 1.37000
TAKE PROFIT: 1.36100
Note: Higher Timeframe Zone level
Support turn to Resistance
Comment your opinion pls.
For Account Management. Contact me on X @shajudeakinoba1 Good Proift Splitting

Bitcoin Btc usdt Daily analysis
Time frame daily
If btc can't break the green uptrend line strongly I guess it drops to 87$
But if btc can continue it's sharp way , my target is 170 $

EURUSD –Bearish Pressure Below 1.1780 |Channel Structure HoldingEURUSD | UPDATE
The price is currently respecting the descending channel, failing to close above the pivot zone (1.1780 – 1.1750) and rejecting from the upper boundary of the structure.
Bias: Bearish While Below 1.1780
As long as price remains under the pivot zone and inside the descending channel, the bearish pressure is likely to persist. A potential correction may retest 1.1750 – 1.1730 levels before continuation.
Next Targets:
1.1700 – Minor support
1.1684 – Short-term level
1.1627 – Mid-target
1.1557 – Main support zone and channel bottom
Invalidation:
Clear breakout and H4 close above 1.1780 would invalidate the short bias and open a path toward 1.1820 and possibly 1.1882.
Structure: Bearish inside descending channel

GOLD Will Move Higher! Buy!
Here is our detailed technical review for GOLD.
Time Frame: 12h
Current Trend: Bullish
Sentiment: Oversold (based on 7-period RSI)
Forecast: Bullish
The market is on a crucial zone of demand 3,347.64.
The oversold market condition in a combination with key structure gives us a relatively strong bullish signal with goal 3,425.86 level.
P.S
We determine oversold/overbought condition with RSI indicator.
When it drops below 30 - the market is considered to be oversold.
When it bounces above 70 - the market is considered to be overbought.
Disclosure: I am part of Trade Nation's Influencer program and receive a monthly fee for using their TradingView charts in my analysis.
Like and subscribe and comment my ideas if you enjoy them!

Market Analysis – Key Levels to Watch!
🔥 Market Analysis – Key Levels to Watch! 🔥
❗️The market is unstable, and fear is visible – but let’s break down what’s next!
♦️ Recap of Yesterday’s Analysis:
✅ We discussed the potential altcoin rally – but only if BTC.D and USDT.D confirm.
✅ We also warned about fake breakouts in alts.
Over the last 24 hours, many altcoins spiked on the 1H timeframe, but due to low volume & weak momentum, and no confirmation from BTC.D & USDT.D, a fake breakout occurred.
🟢 Current Market Outlook:
The best move right now is to wait for BTC.D and USDT.D reactions to the key levels I’ll highlight below.
If the market turns bullish & BTC dominance drops, coins like ADA, DOGE, XRP, BNB, SOL, SUI, ETH will be on my radar.
👉 I’ll try to analyze a few of these coins before the next potential move and share trade setups. 🚀 Stay tuned!
♦️ BTC (Bitcoin)
• Sellers have pushed price into buyer micro-zones.
• Key support: 111
• Two bullish scenarios:
1️⃣ Price hits 111, ranges for a while, then breaks the range top upward → long setup.
2️⃣ A sharp bullish candle forms. If BTC.D drops on the same move, I’ll look for alts near previous highs for potential entries.
♦️ USDT.D
• Support: 4.22
• Max correction: 4.51
• If this level breaks upward → short setups will be in play.
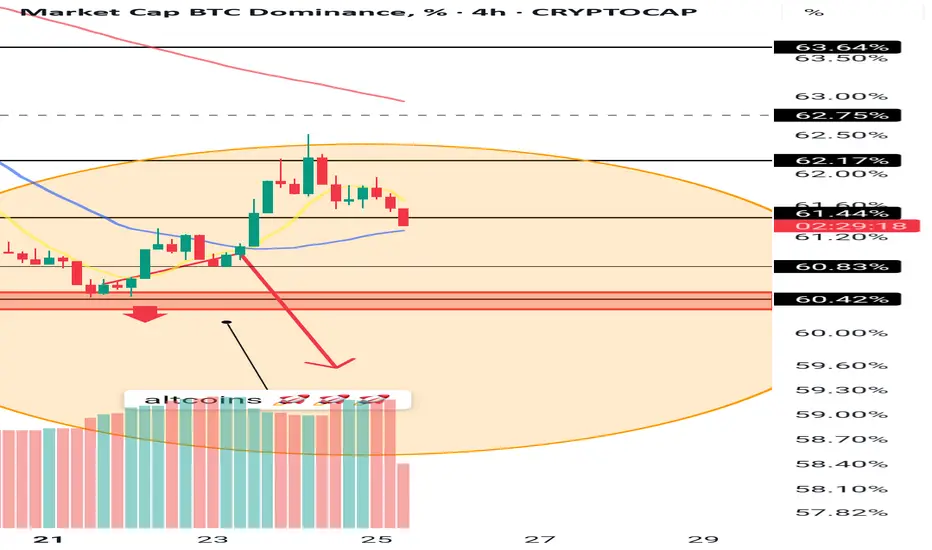
♦️ BTC.D
• Yesterday’s analysis is still valid.
• After the recent downtrend on 1D (HWC), there’s only one bullish candle.
• For alts to rally: BTC.D must break 61.6 → 60.83 → 60.42 downward.
• If BTC.D rises instead, watch 62.17 as a critical level for altcoin drop scenarios.
♦️ TOTAL (Crypto Market Cap)
• Needs to break 3.91 to confirm bullish momentum.
• Early signal: 3.85 (1H timeframe).
♦️ TOTAL2 (Altcoin Market Cap)
• Early bullish signal: 1.48
• Strong confirmation: 1.55
💎 Follow me & hit 🚀 if you want real-time updates before the next big move!
Gold on the magic level, pullback?Gold reached a key level i was waiting for more than a week. The area from 3325 till 3350 is the real support zone that could lead the price to pullback. In H1 and M15 timeframe i can see a reversal pattern, that let me join this trade with a small risk (due to the RR ratio). I will increase my size if NY will give us a better scalp opportunity

Chart Analysis Gold (XAU/USD)Chart Analysis Gold (XAU/USD)
**Bearish Outlook (Short-Term)**
* **Price is below EMA 7 and EMA 21**, showing short-term bearish momentum.
* Strong **resistance zone** around **\$3,430–\$3,440** was rejected sharply.
* Price has broken below **\$3,405–\$3,395** support and is now **consolidating above \$3,385–\$3,380**, a critical support area.
* Volume is rising on red candles, supporting **selling pressure**.
**Key Support Zone:**
\$3,380 – If broken, next downside targets:
→ **\$3,370**
→ **\$3,360**
*Bullish Scenario (If Support Holds)**
* If **\$3,380** holds and price reclaims above **\$3,395**, a **bounce toward \$3,405–\$3,410** is possible.
* Look for a **break above EMA21 (currently near \$3,402)** for bullish confirmation.

Global Liquidity Index vs BitcoinGlobal liquidity index at ATH!
CRYPTOCAP:BTC will continue to follow hard!

Blokblok usdt daily analyses
time frame daily
long position risk of ratio >9
target 0.00075$
if price breaks the upper line my long position will start. duration of this forecast is long
if it cannot break and move between orange lines my short position will be active. this duration is short
short position risk of ratio >2
target 0.00027$

Terra classic Lunc usdt Daily analysis
Time frame 4hours
Risk rewards ratio =2 👈
Target = 0.000083 $
Double benefit in short time is good for traders

Ethereum (ETH): Buyers Accumulated | Time For Boune & BreakoutEthereum had its fun this week, and now we are already seeing some signs of buyer dominance forming here.
Based on our overall target and bigger timeframes, TAs, the $4000 is the target and 4hour candels are showing that buyers have not given away anything yet but rather have just been accumulating.
As long as we are above our entry area, we are bullish, and so should you be ...
Swallow Academy

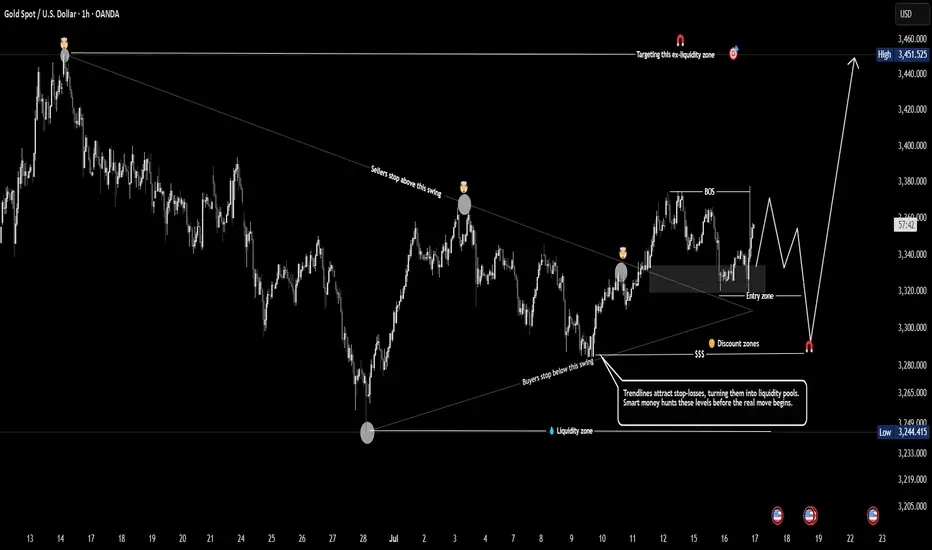
Liquidity Sweep & Discount Entry Zone - Gold Swing Play Gold is targeting an external liquidity zone around 3,450 after breaking structure and forming a bullish setup. Price is expected to dip into the discount zone near 3,300 to collect liquidity from trendline stops before a strong move upward. Smart money is likely hunting below prior lows before initiating the next bullish leg.
XAU/USD 25 July 2025 Intraday AnalysisH4 Analysis:
-> Swing: Bullish.
-> Internal: Bullish.
You will note that price has targeted weak internal high on three separate occasions which has now formed a triple top, this is a bearish reversal pattern and proving this zone is a strong supply level. This is in-line with HTF bearish pullback phase.
Remainder of analysis and bias remains the same as analysis dated 23 April 2025.
Price has now printed a bearish CHoCH according to my analysis yesterday.
Price is now trading within an established internal range.
Intraday Expectation:
Price to trade down to either discount of internal 50% EQ, or H4 demand zone before targeting weak internal high priced at 3,500.200.
Note:
The Federal Reserve’s sustained dovish stance, coupled with ongoing geopolitical uncertainties, is likely to prolong heightened volatility in the gold market. Given this elevated risk environment, traders should exercise caution and recalibrate risk management strategies to navigate potential price fluctuations effectively.
Additionally, gold pricing remains sensitive to broader macroeconomic developments, including policy decisions under President Trump. Shifts in geopolitical strategy and economic directives could further amplify uncertainty, contributing to market repricing dynamics.
H4 Chart:
M15 Analysis:
-> Swing: Bullish.
-> Internal: Bullish.
H4 Timeframe - Price has failed to target weak internal high, therefore, it would not be unrealistic if price printed a bearish iBOS.
The remainder of my analysis shall remain the same as analysis dated 13 June 2025, apart from target price.
As per my analysis dated 22 May 2025 whereby I mentioned price can be seen to be reacting at discount of 50% EQ on H4 timeframe, therefore, it is a viable alternative that price could potentially print a bullish iBOS on M15 timeframe despite internal structure being bearish.
Price has printed a bullish iBOS followed by a bearish CHoCH, which indicates, but does not confirm, bearish pullback phase initiation. I will however continue to monitor, with respect to depth of pullback.
Intraday Expectation:
Price to continue bearish, react at either M15 supply zone, or discount of 50% internal EQ before targeting weak internal high priced at 3,451.375.
Note:
Gold remains highly volatile amid the Federal Reserve's continued dovish stance, persistent and escalating geopolitical uncertainties. Traders should implement robust risk management strategies and remain vigilant, as price swings may become more pronounced in this elevated volatility environment.
Additionally, President Trump’s recent tariff announcements are expected to further amplify market turbulence, potentially triggering sharp price fluctuations and whipsaws.
M15 Chart:

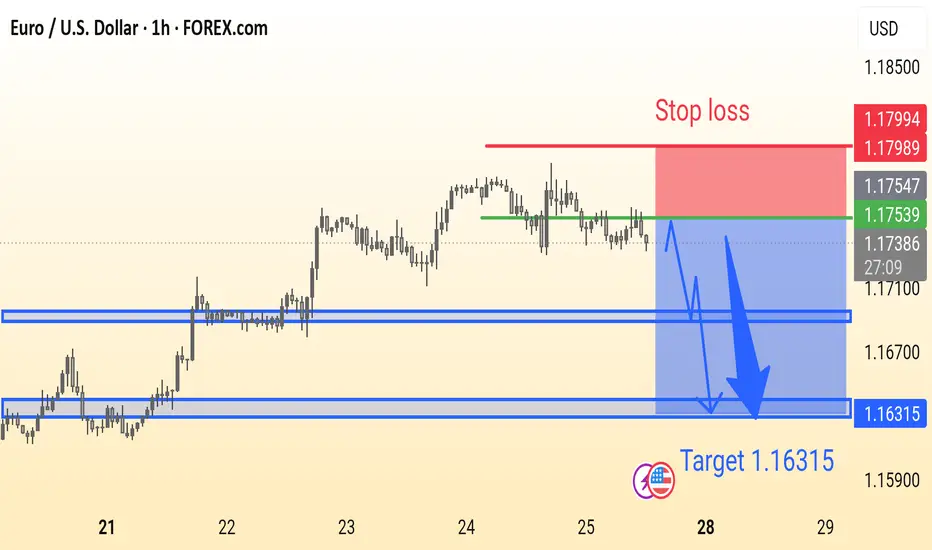
EURUSD Analysis is ReadyEUR/USD Trade Idea (1H Chart):
Price is ranging below resistance with a potential bearish breakout. Suggested Sell near 1.1753 with Stop Loss at 1.1799 and Target at 1.16315. Strong support zones marked for possible reaction.
XAU/USD: Golden Breakout to $3400?XAU/USD: Golden Opportunity Ahead XAU/USD is testing a key support at $3345, with a bullish setup forming on the 1-hour chart. Entry at $3345 offers a high-probability trade, targeting $3400 where the next resistance aligns. Set a stop loss at $3320 to manage risk below the recent support. A break above $3350 with strong volume could confirm the move. Watch for US dollar weakness as a catalyst. Trade smart!
#XAUUSD #GoldTrading #ForexSignals #TechnicalAnalysis #MarketAnalysis #DayTrading

BankNifty levels - Jul 28, 2025Utilizing the support and resistance levels of BankNifty, along with the 5-minute timeframe candlesticks and VWAP, can enhance the precision of trade entries and exits on or near these levels. It is crucial to recognize that these levels are not static, and they undergo alterations as market dynamics evolve.
The dashed lines on the chart indicate the reaction levels, serving as additional points of significance. Furthermore, take note of the response at the levels of the High, Low, and Close values from the day prior.
We trust that this information proves valuable to you.
* If you found the idea appealing, kindly tap the Boost icon located below the chart. We encourage you to share your thoughts and comments regarding it.
Wishing you successful trading endeavors!

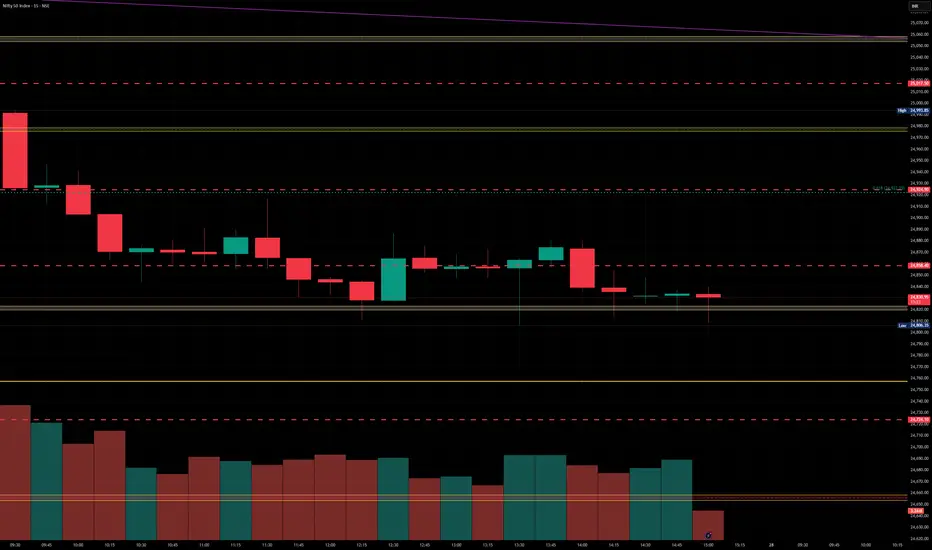
Nifty levels - Jul 28, 2025Nifty support and resistance levels are valuable tools for making informed trading decisions, specifically when combined with the analysis of 5-minute timeframe candlesticks and VWAP. By closely monitoring these levels and observing the price movements within this timeframe, traders can enhance the accuracy of their entry and exit points. It is important to bear in mind that support and resistance levels are not fixed, and they can change over time as market conditions evolve.
The dashed lines on the chart indicate the reaction levels, serving as additional points of significance to consider. Furthermore, take note of the response at the levels of the High, Low, and Close values from the day prior.
We hope you find this information beneficial in your trading endeavors.
* If you found the idea appealing, kindly tap the Boost icon located below the chart. We encourage you to share your thoughts and comments regarding it.
Wishing you success in your trading activities!
Will gold fall to $3200?What’s the next possible move on XAUUSD as we saw a slight drop above the all time high this week? We a break below $3200. I anticipate a further decline due to high selling pressure.

a bit short then a great long!Hello all. as you see market need a new low and after that it will fly. be happy and earn money right here. I try to fix my bugs and tell what it is better.(wink)

TOTALCRYPTO MARKET CAPAs we can see the curve support has been broken but this can be a fake move ( manipulation zone ) and we can be manipulated further more till the next rectangle box as mentioned on the chart. Or you can say its a retracement as per previous market action we are the 50% of the previous downfall and exactly from 50% we got some bullish momentum but still the retest of the 50% has not been done so we cannot trust this zone. Let the price retest the zone and than we will have a clear path to upside.
My analysis is till the level i marked for now.
We are Bullish until we have some serious break down with strong red candles.
