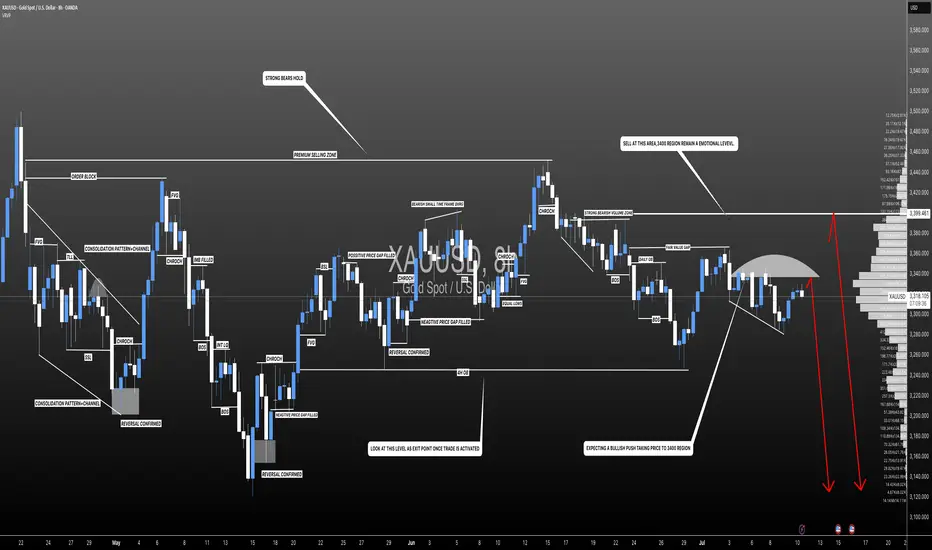
XAUUSD:Swing Sell Is Highly Likely! Get ReadyWe expect a smooth drop in gold prices, with prices potentially dropping around the 3250 area. Use Accurate Risk Management.
Please like and comment!
Team Setupsfx_
Community ideas
MDTUSDT Forming Bullish WaveMDTUSDT is currently forming a bullish wave pattern, indicating a strong potential for continued upward momentum. This wave structure reflects healthy market cycles, with higher highs and higher lows suggesting that bulls are steadily gaining control. As this wave pattern matures, the current market setup hints at a possible breakout, which could push prices significantly higher in the near term.
The volume backing MDTUSDT is robust, which provides a solid confirmation for the ongoing trend. Good volume during the accumulation and breakout phases is essential for sustaining a bullish wave. If the pair maintains its current buying pressure, traders could expect a strong rally, with a projected gain between 90% to 100% based on historical wave completions and resistance breakouts.
Investors and traders have started showing increasing interest in MDT, further validating its bullish potential. This growing attention not only boosts market confidence but also contributes to stronger liquidity, which is critical for smooth and sustained upward movement. Technical traders watching for confirmation of the next wave will likely key in on breakout zones and RSI/volume confluences.
In summary, MDTUSDT is showing signs of entering a powerful bullish continuation phase, supported by strong volume and increasing market interest. As the wave structure plays out, this pair could offer an excellent opportunity for swing traders aiming for mid-to-high double-digit returns.
✅ Show your support by hitting the like button and
✅ Leaving a comment below! (What is You opinion about this Coin)
Your feedback and engagement keep me inspired to share more insightful market analysis with you!

SUSHI LONG TERM POSITIONGoing to be entering at the .618 Fib level (Golden Pocket) for a long position.
ETH has been pumping, this money will start rotating soon enough and i'm betting sushi swap will get a nice pump in the upcoming weeks...

OP Long Position Hi traders,
Turning our attention to OceanPal Inc. (OP), we can observe an Inverted Head and Shoulders pattern forming over the past few weeks, signaling a potential bullish reversal.
OceanPal Inc. is a maritime transportation company, specializing in the transportation of dry bulk cargoes worldwide. The company operates a modern fleet
and has a strong presence in the global shipping industry. Despite recent market fluctuations, OceanPal's operational efficiency and strategic positioning suggest robust fundamentals.
The Inverted Head and Shoulders pattern is characterized by three troughs, with the middle trough being the lowest, and the two outer troughs being higher and approximately equal in depth. This pattern often indicates a reversal from a downtrend to an uptrend.
As the stock approaches the neckline of this pattern, a breakout above this level could confirm the bullish reversal. Traders should consider entering a long position
upon confirmation of a break above the neckline, anticipating further upward movement in the stock.
Take Profit: 3.82
Final Target: 4.31

The End of BTC correction? BTC analysis 2/8/2025In my point of view, BTC has completed its correction and is now ready for a strong upward move, potentially targeting the $137,000–$139,000 range, based on the following factors:
1. Confirmation of the Butterfly Harmonic Pattern
The recent reversal occurred within the expected range of the Butterfly harmonic pattern. Typically, the XD leg in a Butterfly harmonic extends to 1.27, but in practice, this can stretch up to 1.414, which is commonly used as a flexible stop-loss zone. After testing the 1.27–1.414 range, a clear 5-wave impulse followed—testing a key trendline and making an attempt to break above the recent high. This sequence, followed by a corrective move, suggests that the broader correction may be complete.
2. Complex WXYXZ Correction Structure
In my previous analysis, I underestimated the duration and depth of the correction. The wave (4) (blue), which is part of the wave (iii), has taken considerable time—likely to allow wave (5) to extend sufficiently to break above the $130,000 level. This would support the assumption that wave (5) (purple) is the extended wave. The overall corrective structure appears highly complex, and can be counted as a W–X–Y–X–Z pattern, supported by the presence of multiple internal corrections within the wave components.
3. 0.618 Fibonacci Retracement of Wave (3)
Wave (4) has now reached the 0.618 Fibonacci retracement level of wave (3), which is significant. Historically, BTC’s corrections rarely retrace beyond the 0.87 level. This deep retracement suggests wave (4) is likely complete—unless price were to fall below that threshold, which would invalidate this assumption.


BTCUSD looking to SellI'm expecting BTC USD to enter into the break of structure and retest zone that is in f4HRS and and then push down from there with a 1:4RR hitting the next point of interest / area of interest

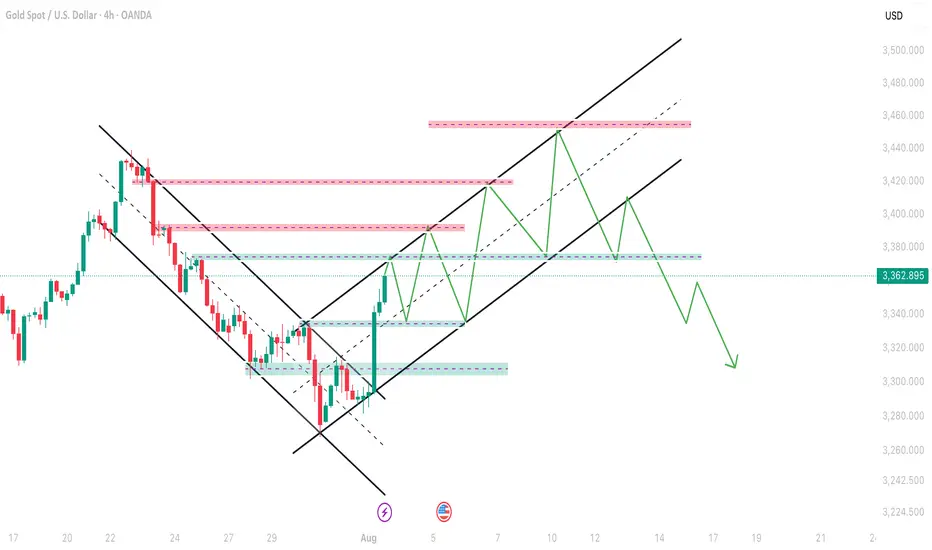
Gold Plan B For 4 Aug onwardsAs you can see that gold is moving good in channel of Bullish so next hurdle can be 3374-3380 and then it can retest the support of Non-Farm 3336-3340 and then continue this channel till further 3452-3458 and then we can expect a big fall in gold and this time support point will be 3290-3300 which will hold gold to go up again.
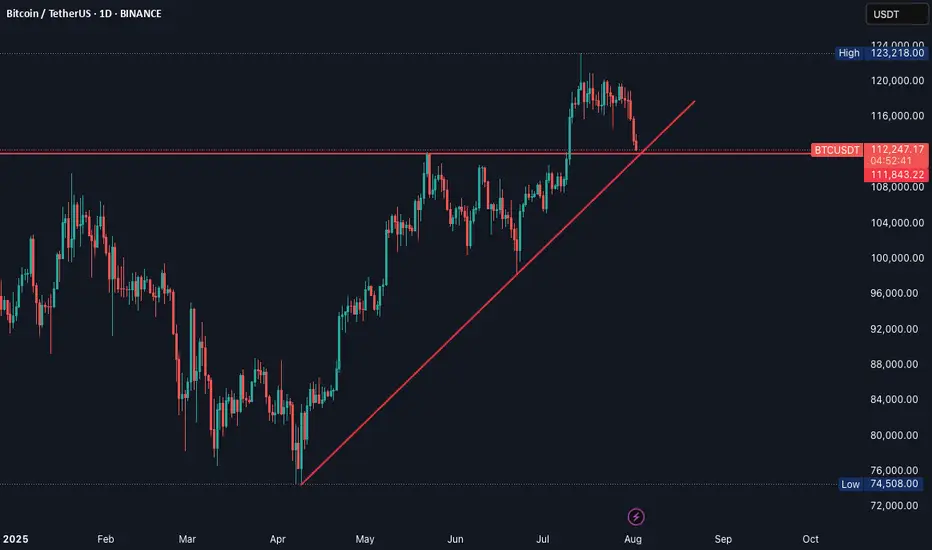
BTC- On a Crucial Testing PointBTC Seems to be testing a strong support point, if it bounce back , it's good opportunity to buy, otherwise sell.
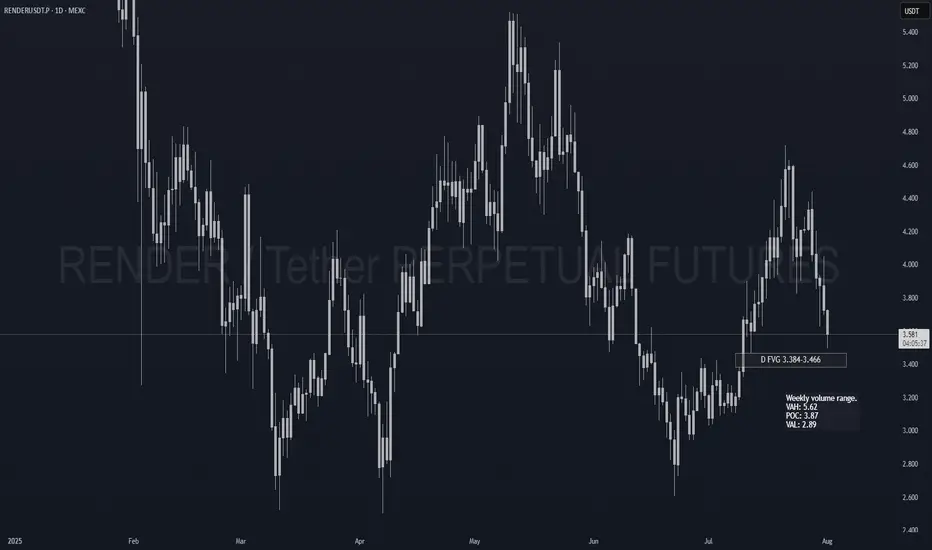
RENDER Spot Re-add PlanAlready holding Render as my biggest spot bag. Just setting clean limit orders to compound on weakness.
📍 Limit Orders (laddered):
• 3.45 → Daily FVG top (40%)
• 2.95 → Weekly VAL zone (40%)
• 2.55 → Deep HTF discount (20%)
Long term hold. Pure add-on entries.
DISCLAIMER:
I am not providing financial advice or investment signals. This post reflects my personal accumulation strategy and is shared solely for documentation purposes. I'm adding to an existing long-term position based on my own analysis and conviction. Sharing this openly helps me stay accountable and focused on my goals. If you choose to act on any of this, it's entirely at your own risk. Always do your own research and make informed decisions based on your situation.
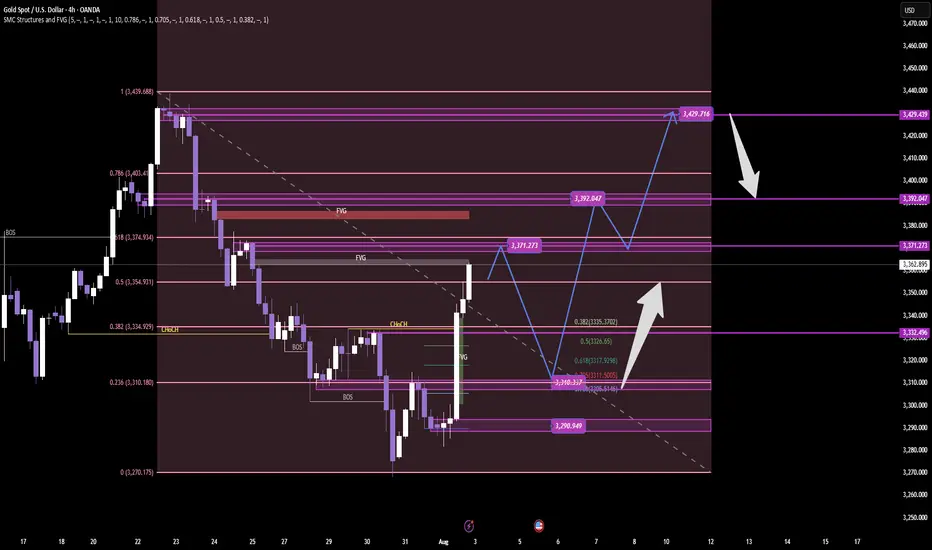
GOLD – SMC ProTrading Breakdown Plan Next WEEK GOLD – SMC ProTrading Breakdown | Clinton Scalper | 4H Timeframe
XAUUSD is currently displaying clear institutional order flow behavior after a deep liquidity sweep at the end of July. Here’s a full breakdown using advanced SMC (Smart Money Concepts) methodology:
🔍 1. Liquidity Sweep at the Low
Price maintained a series of lower highs and bearish structure until it executed a classic liquidity grab between 3,270 – 3,290. This is a textbook move by Smart Money: sweep retail stop orders before initiating a reversal.
This zone aligned with:
✅ Untapped Fair Value Gap (FVG)
✅ Reversal Order Block (OB)
✅ Fibo 0.236 of the mid-term bullish leg
After the sweep, the market printed a micro CHoCH, indicating early signs of smart money accumulation.
🧠 2. CHoCH → BOS → Reaccumulation Structure
CHoCH (Change of Character) marks the first break in the bearish microstructure – suggesting a possible shift.
Then, price delivered a BOS (Break of Structure) around the 3,334 zone, confirming bullish intent.
Buy-side is now:
Positioned from a deep discount zone
Mitigating key inefficiencies
Targeting higher liquidity zones above current price
Price is currently reacting to a previous supply OB around 3,362.
📐 3. Institutional Order Flow & Target Zones
Now that price is in a key reaction zone, we prepare for two high-probability scenarios:
🅰️ Continuation Scenario (Reaccumulation)
A retracement to the 3,317–3,311 zone (Fibo 0.5–0.618) could offer a premium re-entry
This area is stacked with:
FVG
Order Block
Equal lows liquidity
🔼 From there, potential targets include:
🎯 TP1: 3,371 – previous imbalance zone
🎯 TP2: 3,392 – minor liquidity cluster
🎯 TP3: 3,429 – premium OB and high-liquidity zone
🅱️ Distribution Scenario (Bearish Rejection)
If price fails to hold bullish structure and forms a bearish CHoCH around 3,392–3,429
This would signal a distribution zone, and potential reversal back toward 3,290 support
🔂 4. Smart Money Flow Logic
“Smart Money doesn’t follow price. They lead price to liquidity.”
This chart reflects the complete Sweep → CHoCH → BOS → Mitigation → Expansion sequence. A classic SMC Pro model where:
Liquidity is engineered and swept
Structure is shifted
Price returns to mitigate institutional entries
Price expands into external liquidity
📌 Clinton Scalper Outlook:
We don’t chase reversals – we track the footprints of capital. The real edge is understanding where smart money is positioned, and aligning with their narrative.
🔔 Stay tuned for continued updates using this precise and probability-driven Pro SMC framework.
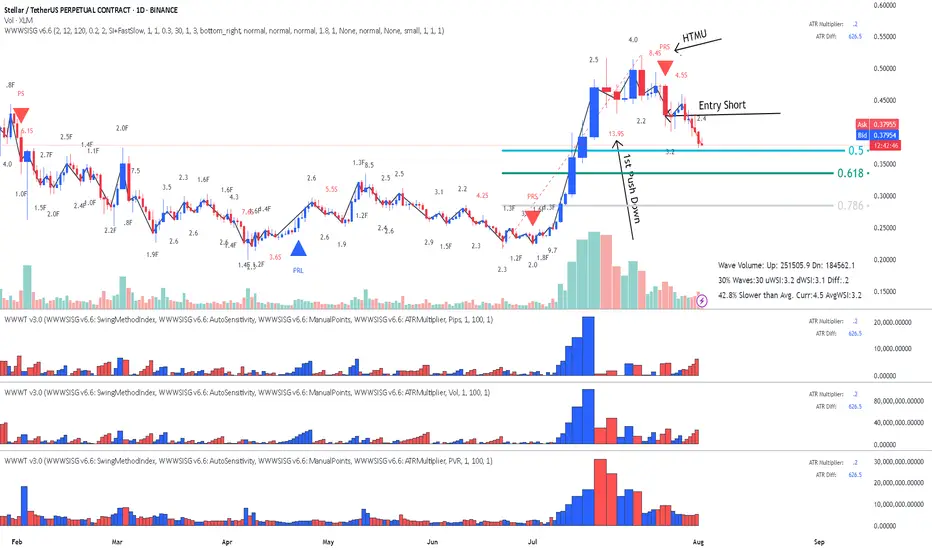
XLM Stellar - Previous video continuation, as forecasted.Not much to say. Just watch the forecast on previous video a few days back. Close to Fib now - no entries.
Video:
Enjoy!
XAUUSD Live Trade Last Night (Killed it with 11,641 USD Profits)I managed to ride the momentum last night on XAUUSD and made over 11,641 usd profit on a live trading account. Gold usually create a range. It will create a top and a bottom then it will spend most of its time inside that range. That is pretty much how XAUUSD moves. If you can identify the top and the bottom then you can short it from the top and do a long trade on the bottom. The price will just travel from bottom to top and top to bottom. You can scalp your way to profits on this move if you can time it properly. Once in a while, a break from the top or the bottom happens. This is where you switch from trading the range to trading breakouts.

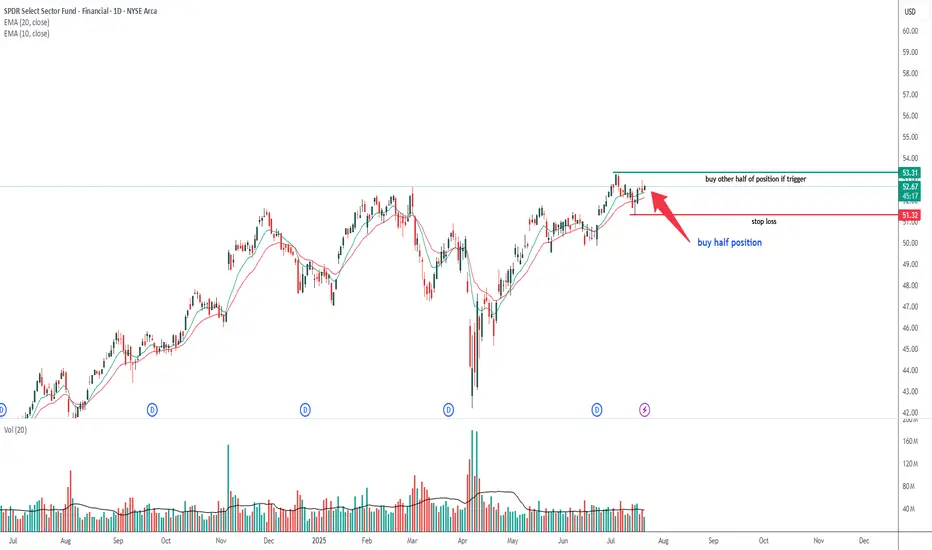
XLF -- Possible trade opportunityXLF -- Possible trade opportunity based of price, volume and chart pattern
BITCOIN - Price can turn around and start to move upHi guys, this is my overview for BTCUSD, feel free to check it and write your feedback in comments👊
The price reversed its prior downtrend with a decisive breakout from a falling channel.
This breakout triggered a strong upward impulse, which then began to consolidate into a large symmetrical pennant.
However, the price recently failed to hold the lower support trendline of this pennant and broke to the downside.
The asset is currently trading just below this broken trendline, in what appears to be a liquidity grab.
To continue upwards, buyers must now overcome the immediate resistance located at the $116300 level.
I expect that this breakdown was a fakeout, and the price will soon reverse, break through the $116300 resistance, and continue its rally toward the $121000 target.

daily BTC analysis Bitcoin breaks the $115,000 level and approaches $112,000. Personally, I expect this level to be unsustainable and the next level is $110,000. This analysis is not financial advice in any way.Crypto Futures Trading Could Destroy All Your Money

GOLD WILL BOUNCEHappy new week Families, Gold is expected to bounce back to the up side from my indicated buy zone. All the best of the week.

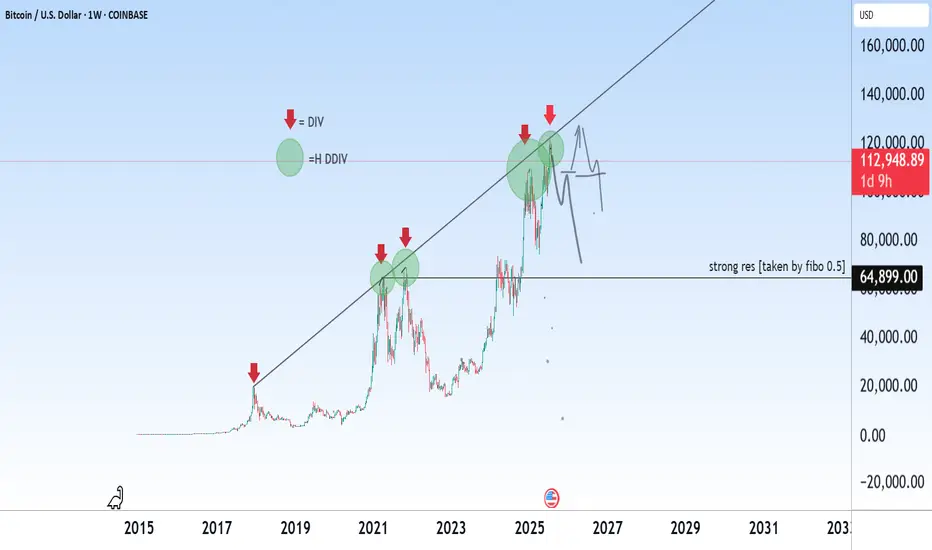
Bitcoin is experiencing a major collapse!BTC/USD – Historical Cycle Analysis & Mid-Term Outlook (1W)
Exchange: Coinbase
Timeframe: Weekly (1W)
Key Observations:
Long-Term Trendline Resistance
The black ascending trendline has historically acted as a major resistance zone since 2017.
Every touch of this line in the past has been followed by a significant correction.
Bearish Divergences (DIV / HDIV)
Red arrows indicate historical bearish divergences on RSI/MACD.
Each divergence marked a local or macro top before a sharp retracement.
Major Historical Resistance – $64,899
Derived from 0.5 Fibonacci retracement of the primary cycle.
Served as a key ceiling during previous cycles before new all-time highs.
Bitcoin Cycle Behavior
BTC historically forms parabolic tops followed by deep corrections.
The current cycle (2024–2025) mirrors 2017 and 2021 structures, suggesting we may be approaching a macro inflection point.
Mid-Term Scenario
Price near the trendline (~$120K) implies high risk of volatility and correction.
Primary support zone: ~$65K (historical + Fibonacci confluence).
Likely scenario: range-bound movement between $65K–$120K before any sustainable breakout or new parabolic leg.
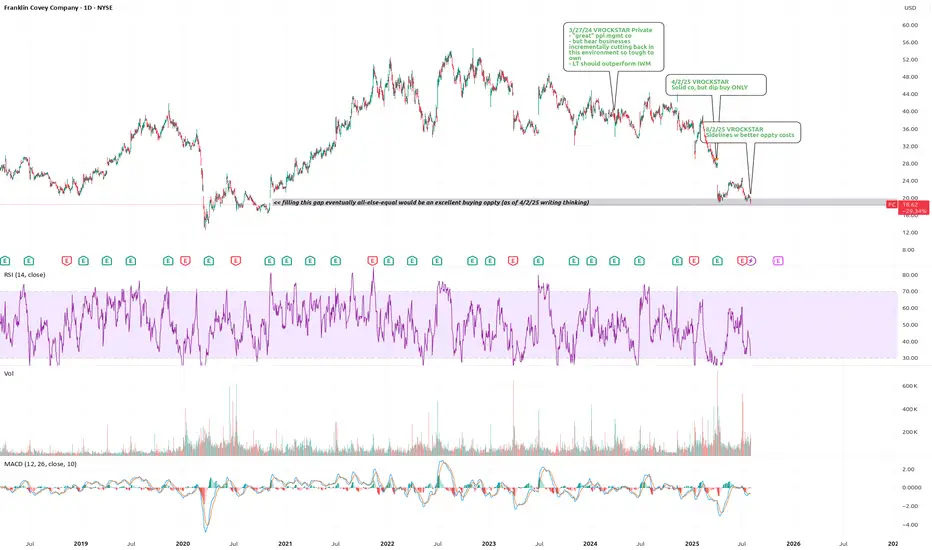
8/2/25 - $fc - Sidelines w better oppty costs8/2/25 :: VROCKSTAR :: NYSE:FC
Sidelines w better oppty costs
- came to this company over a yr ago bc it's a well managed business, throws off cash and still does
- the issue are maybe 3 things in this current environment, all of which are likely transient but nevertheless relevant to my sidelines and not interested at the moment thinking.
- so this hit my "alert" on Fri (as did a lot of stuff), so i'll be reviewing those this weekend and this is simply the top of that list. TradingView also limits my posts... or else i'd review all 20 of them ha.
1/ stock just missed expectations and in an environment were businesses are likely cutting these "nice to have but not right now" type coaching, improvement services. and/or where pricing discussions are probably weaker on the mgn. so it's hard to even consider names rn in this tape that just had a negative reaction to their prints, nevermind those that are already re-testing their mar/apr lows. so it goes into a secondary bucket right away
2/ at $200 mm cap, it's small and factor matters right now. the opportunity set of so many things means that in order for this type of name to get recognized it *needs* to have a positive catalyst or reason to own it or step in "now". with #1 above, that's not the case, and if small caps continue to bleed to large caps, even the quality names suffer a lemons problem. NASDAQ:GAMB is probably my favorite small cap name rn, and i can only justify having it at 4% size and on 2.5x leverage so about 10%. it's growing double digits, isn't missing results, the industry is growing, it's fcf generation is 15% (for NYSE:FC for comparison it's 10% on possibly numbers that need to come down). point is, even in small cap land, my alternative is something that scores higher on nearly all metrics and i'm already finding that hard to own
3/ and this point is similar in a way to 2, as this venn diagram has a lot of circles. but on valuation mid teens PE with no "E" growth and "only 10% fcf yield" is just not good enough w better valuations and pictures, elsewhere, even in much higher caps that i think will get bid first, posted good results etc. etc. and can buyback stock.
so while i will probably keep this on my watchlist, and even though my gap fill from the April 2 comment happened (and i'll leave it on my chart for my notes), the tape has changed. this is important to put into your process. people often ask "at what price i'm a buyer or seller". realistically this changes day by day, week by week and depends on a lot of things. in a vacuum and at any given day, i can give you an answer to this question. but if we zoom forward now nearly 4 months from this point, that gap fill price (where we are today) is not good enough. and i'd probably need PE closer to 10-12x minimally and FCF yield in the mid teens. this means minimally 20% and ideally 30% lower, i'll be bothered to look again.
now, will it get there? idk. again, this is the beauty of trading view alerts and notes. i'll post this comment, set my alert at $15.55 (which is only 16% lower - not this 20% - because maybe things have changed, who knows - and if/when we get there i pull up this note, saves me another 10 mins of work - and either reset the bogey or update). that's my target and alert-setting process, fwiw.
V
KIMLUN - DMI and RSI shows BULLISH SIGNAL KIMLUN - CURRENT PRICE : RM1.31
KIMLUN is in an uptrend for medium term as the price is making higher high and higher low. Supported by positive readings in technical oscillators such as DMI (+DI is above -DI) and RSI (above 50), it increases the bullish scenario. At current price trading near SMA 20, there is possibility for price reach upper band in bollinger bands indicator. Nearest support will be RM1.24 (-5.34%) and 1st target will be RM1.41 (+7.63%).
ENTRY PRICE : RM1.30 - RM1.31
TARGET : RM1.41 and RM1.47
SUPPORT : RM1.24
Notes : On the fundamental side, KIMLUN shows a strong recovery in earnings. For FY2022, company was loss RM7.2 million. Then the company rebounded with a profit of RM7.1 million in FY2023. For FY2024, company registered strong performance of profit RM50.3 million.

NZD-JPY Local Long! Buy!
Hello,Traders!
NZD-JPY is retsting a
Strong horizontal support
Level around 87.044 and
As the pair is locally
Oversold we will be expecting
A local rebound and a move
Up on Monday!
Buy!
Comment and subscribe to help us grow!
Check out other forecasts below too!
Disclosure: I am part of Trade Nation's Influencer program and receive a monthly fee for using their TradingView charts in my analysis.

#MAGIC/USDT#MAGIC
The price is moving within a descending channel on the 1-hour frame, adhering well to it, and is on its way to breaking strongly upwards and retesting it.
We have support from the lower boundary of the descending channel, at 0.1474.
We have a downtrend on the RSI indicator that is about to break and retest, supporting the upside.
There is a major support area in green at 0.1700, which represents a strong basis for the upside.
Don't forget a simple thing: ease and capital.
When you reach the first target, save some money and then change your stop-loss order to an entry order.
For inquiries, please leave a comment.
We have a trend to hold above the 100 Moving Average.
Entry price: 0.1800.
First target: 0.1837.
Second target: 0.1900.
Third target: 0.1958.
Don't forget a simple thing: ease and capital.
When you reach your first target, save some money and then change your stop-loss order to an entry order.
For inquiries, please leave a comment.
Thank you.

#MAGIC/USDT#MAGIC
The price is moving within a descending channel on the 1-hour frame, adhering well to it, and is on its way to breaking strongly upwards and retesting it.
We have support from the lower boundary of the descending channel, at 0.1560.
We have a downtrend on the RSI indicator that is about to break and retest, supporting the upside.
There is a major support area in green at 0.1555, which represents a strong basis for the upside.
Don't forget a simple thing: ease and capital.
When you reach the first target, save some money and then change your stop-loss order to an entry order.
For inquiries, please leave a comment.
We have a trend to hold above the 100 Moving Average.
Entry price: 0.1600.
First target: 0.1640.
Second target: 0.1677.
Third target: 0.1719.
Don't forget a simple thing: ease and capital.
When you reach your first target, save some money and then change your stop-loss order to an entry order.
For inquiries, please leave a comment.
Thank you.
