You Are NOT Your P<here was once a tree that stood alone at the edge of a cliff, overlooking the vast sea.
Some days, the sun shone bright, the winds gentle, the water below calm and peaceful. Other days brought heavy storms, fierce winds, crashing waves, rain so relentless it seemed the skies might never clear again. The seasons came and went. The skies changed again and again. But the tree never thought of itself differently because of the weather.
It did not feel more valuable on a sunny day. It did not feel broken or weak when storms battered its branches. The tree simply stayed rooted. It understood something quietly powerful - “ the weather was never personal. It wasn’t about the tree.”
The tree remained, growing slowly over years, not because the conditions were always perfect, but because it had learned to stand through all of it.
This is something most traders forget.
We step into the market with good intentions, hungry to learn, eager to succeed. But somewhere along the way, we make a mistake. We let our self-worth become tied to the numbers on the screen.
A green day makes us feel smart, in control, like we’ve cracked the code. A red day, on the other hand, shakes us to the core, makes us question our place, our skill, even our worth, like we never belonged here at all.
The danger isn’t just in the financial losses. It’s in how we let the market shape how we see ourselves.
But here’s the truth the market won’t tell you upfront: the market doesn’t know who you are, and it doesn’t care . It doesn’t remember what you did yesterday, how many hours you’ve spent learning, or how desperately you want this to work.
The market moves how it moves. Sometimes it moves with you, sometimes it moves against you. It’s neither a punishment, nor a reward. It’s just movement.
Your wins don’t make you superior. Your losses don’t make you dumb. Both are part of the same cycle, and part of the environment you’ve chosen to work in. If you build your self-image on the outcome of your last trade, you’ll forever live on a fragile edge. Every swing will shake you. Every drawdown will feel like a verdict on who you are.
But trading isn’t about who you are today. It’s about who you become over time.
Your job isn’t to seek approval from a system built on randomness and probability. Your job is to build yourself on steadier ground. To stay rooted, like a tree. To let your process define you, not your P&L.
The storms will come. They always do. Volatility, uncertainty, periods where nothing seems to work - these are all part of the environment. The traders who survive are NOT the ones who try to outmuscle the market. They are the ones who protect their capital, their energy, and their mindset through it all.
They understand that being steady is more important than being brilliant - that surviving is more valuable than being right.
Detach your self-worth from the swings. Build your identity on discipline, patience, humility - the quiet habits you control. These are your roots. And when the storm rolls in, they’re what keep you grounded.
When you stop tying your self-image to your short-term results, you begin to see the market more clearly. You stop forcing trades to make yourself feel better. You stop chasing moves to prove something. You start letting your process do its work, even when it feels slow.
You start to realise that progress in trading is quiet and unfolds slowly, almost invisibly, much like a tree growing through the seasons. Small shifts accumulate over time, often going unnoticed, until one day you look back and truly see how far you’ve come.
When you understand this, red days lose their sting. Green days lose their arrogance. Both just become part of the weather. You adapt, endure, and move forward.
You don’t measure yourself by how much you made this week, this month, or even this year. You measure yourself by how well you followed your process , how calmly you handled the volatility, and how patient you remained when there was nothing to do.
The market doesn’t ask for perfection - only consistency. And consistency comes from within, not from chasing highs or avoiding lows, but from standing firm through both.
Like the tree on the cliff, your strength is not in avoiding the weather. Your strength is in understanding that the weather will pass. It always does. Your roots - your process, your discipline, your patience, are what keep you standing until it does.
⦿ Learn to protect your energy.
⦿ Learn to lose without self-doubt.
⦿ Learn to win without ego.
⦿ Learn to wait without fear.
⦿ Learn to wait patiently
Your worth is not in your wins or losses. It’s in how you carry yourself through both.
Stay rooted.
The seasons will change.
And when they do, you’ll still be here, stronger than you were before.
Community ideas
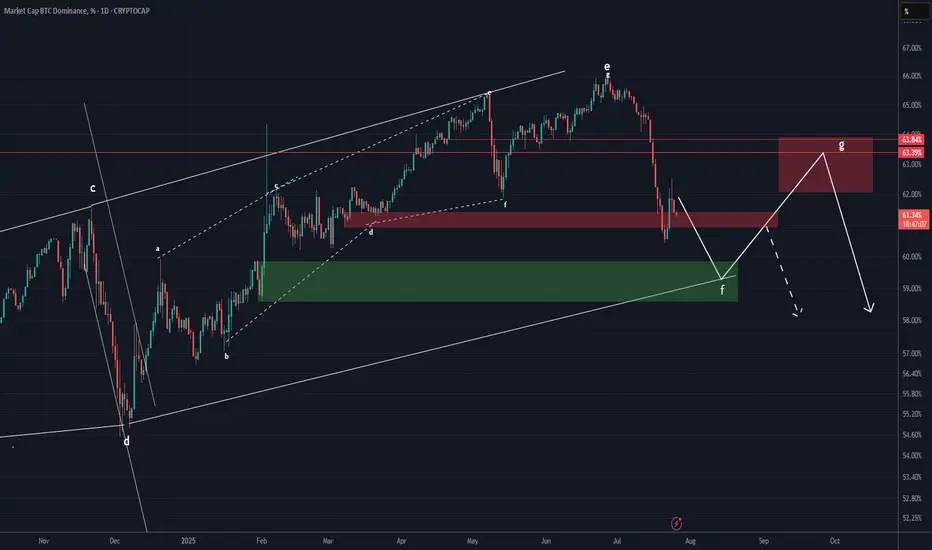
BTC DOMINANCE Update (1D)It seems that Bitcoin dominance may soon experience upward corrections, as it has broken through several support zones to the downside without any reaction and is now close to another support area. Usually, when the market maker pushes the price through multiple supports without a reaction, the price can retrace from a nearby support.
The price may soon move to complete wave G.
We have considered two different scenarios for the fluctuations of this index. However, note that this chart is a derivative chart, and the fluctuations may not follow the schematic exactly, but this analysis gives us a good view of the support and resistance zones and the probable path.
For risk management, please don't forget stop loss and capital management
Comment if you have any questions
Thank You
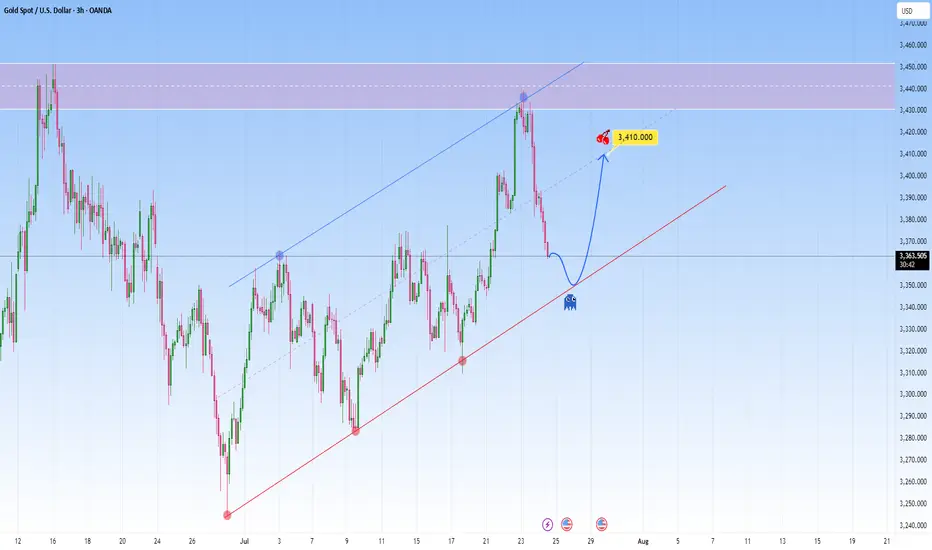
GOLD Reawakened: Corrects firmly but conditions remain bullishFrom a technical perspective Gold is climbing in a parallel channel, clearly bullish with a rhythm that’s hard to ignore. Price just bounced off the resistance with force, a classic overextension flush.
And the market is now approaching the lower boundary of this projected channel. This confluence of technical support is likely to attract renewed buying interest.
I expect it to bounce back toward 3,410, somewhere around the middle of the channel. The move up may not be determined right away. It could be consolitaing, fake dips first, or sudden acceleration.
XAUUSDHello Traders! 👋
What are your thoughts on GOLD?
Gold entered a corrective phase after reaching the top of its ascending channel. Price is now approaching the channel bottom, which coincides with a key support zone.
As long as the channel support holds, we expect a bullish reaction from this area, potentially driving price back toward the next target level.
The uptrend remains valid as long as price does not break and close below the lower boundary of the channel.
A rebound from channel support may signal the start of the next upward leg.
Invalidation occurs only if price breaks and holds below the channel.
💡 Will gold bounce from channel support and resume its rally? Share your view in the comments! 🤔👇
Don’t forget to like and share your thoughts in the comments! ❤️

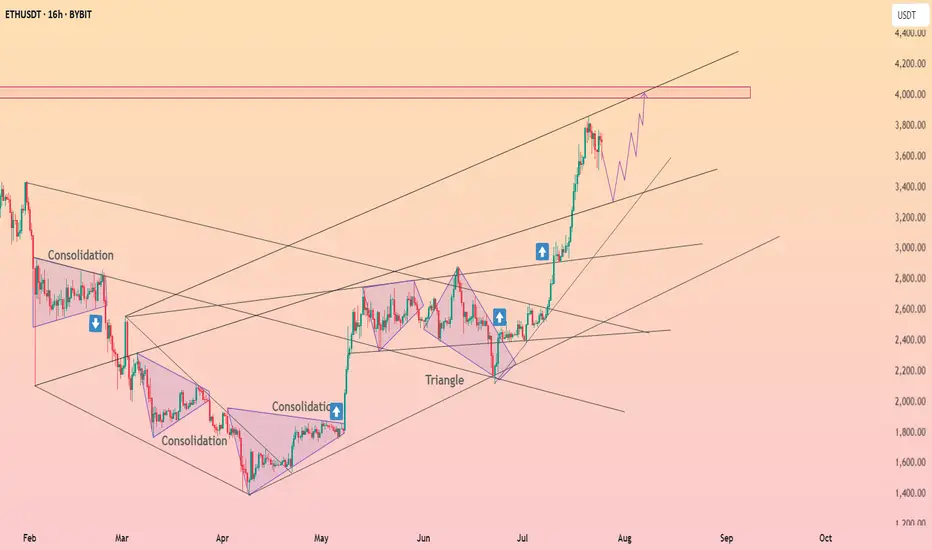
Ethereum will retest the $3,500 level ┆ HolderStatOKX:ETHUSDT is trending upward with $3,100 as the next resistance. Breakout aims for $3,250. $2,875 remains critical support. Bullish momentum intact.
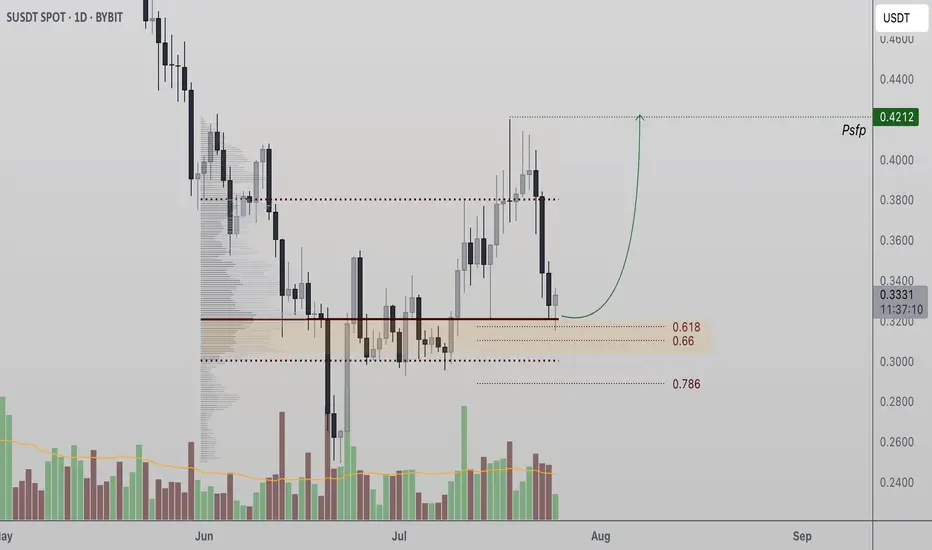
Sonic Token Tests Critical Support at Point of Control Sonic Token (S) is holding a major confluence support zone that could act as the foundation for a bullish reversal. A strong bounce here may lead to a retest of the $0.42 swing high.
Sonic Token (S) has corrected into a significant support region, aligning with both the Point of Control (POC) and the 0.618 Fibonacci retracement level. This confluence of technical factors marks a decisive zone where the current bullish structure could either confirm or break down. For bulls to remain in control, price must continue closing daily candles above this support in the coming sessions.
Key Technical Points:
- Key Support Zone: POC and 0.618 Fibonacci retracement form a strong support base
- Market Structure at Risk: Losing support would invalidate the current bullish structure
- Upside Target at $0.42: A reclaim of the swing high confirms continuation with a higher high
This level has become a make-or-break point for Sonic Token’s trend. From a structural perspective, holding this zone would confirm a higher low, preserving the uptrend and increasing the likelihood of a rotation toward the swing high at $0.42. Multiple high time frame indicators now intersect at this support region, making it a vital area for bulls to defend.
The volume profile supports this level’s importance, as historical price action shows significant accumulation and trade density in this range. So far, there are signs that support is holding — but what’s missing is a consistent pattern of daily candle closes above this level. Until that happens, any bounce should be viewed with cautious optimism rather than full confirmation.
If Sonic Token fails to maintain this level, the market risks entering a deeper corrective phase, potentially breaking below the bullish structure that’s been in place since the last major swing low. This would delay any retest of $0.42 and could invite further selling pressure.
On the other hand, if the token manages to hold the confluence zone and reclaim momentum, a move back toward $0.42 would not only retest the previous high but potentially trigger a breakout and continuation of the larger bullish trend. What’s needed now is clear evidence of strength, both in candle structure and volume support.
What to Expect in the Coming Price Action
Sonic Token needs to hold its current support zone on a daily close basis to maintain bullish structure. If it does, a rotation toward $0.42 is likely. A breakdown risks a deeper correction.
USDJPY BullishAfter exiting a correction, the first impulse (Wave 1) appears. I expect a retracement of at least 50% of the Fibonacci.

BTCUSD--SHORT--26_07_25--breaking orange trendline
--pullback and retest trendline between levels 119597,117411
--move down towards descending channel through 111658

The Pullback Panic? Your Whole Plan Dies?!!!!!One red candle is all it takes to destroy your entire plan.
Why do we panic so fast? Why do we exit too early before a rally?
And worse: why do we FOMO back in at the worst possible time?
Hello✌️
Spend 3 minutes ⏰ reading this educational material.
🎯 Analytical Insight on Dogecoin:
BINANCE:DOGEUSDT is approaching the key psychological level of 0.20, which also aligns with a strong daily support and the final Fibonacci retracement zone 🧭. Despite recent volatility, it continues to hold its mid-range Fib level, suggesting potential accumulation. If this support holds, a rebound toward the 0.30 resistance — a move of around 27% remains on the table 🎯.
Now , let's dive into the educational section,
🧠 The Victim Mindset in Crypto Markets
Here’s the uncomfortable truth.
Most traders believe they’re making rational decisions but in reality, they’re reacting emotionally to past pain.
One bad experience during a correction makes us fear all pullbacks.
Missing one big rally creates constant FOMO.
We can’t handle drawdowns but we accept buying tops again and again.
It’s not just you. This is how most retail traders operate and whales know it.
🐳 How Whales Profit From Our Fear
Whales never buy during hype. They buy during fear.
Mini pullbacks, shakeouts and false breakdowns are designed for one thing.
To make you exit so they can enter.
A red candle, a small wick, maybe a fake support break.
We sell out of fear, they buy the dip.
We FOMO back in too late.
Pullbacks are not just price moves. They are psychological traps.
📈 How to Break This Cycle
You don’t need to predict the future. You need to understand yourself.
Ask if this correction is technical or emotional.
Use confirmation from volume, OI and divergence.
Enter after traps, not inside them.
Question your feelings before every move.
You are not trading the chart. You’re trading your mind reacting to the chart.
📊 TradingView Tools to Escape the Fear Greed Cycle
TradingView gives you access to several practical indicators that can help protect your capital from emotional decision-making.
🔹 Fear and Greed Index (Crypto)
Simple but powerful. When the index drops below 30, most traders are in panic mode. That is exactly where whales accumulate, while we run away.
🔹 Open Interest Heatmaps
When open interest rises but price stays flat, it often signals an upcoming shakeout. One scary-looking red candle and the weak hands are gone.
🔹 Volume Profile and VPVR
Perfect for distinguishing between healthy corrections and manipulative dumps. If price pulls back but buying volume remains strong, it's not a real sell-off. It’s a trap.
🔹 Divergence Indicators like MACD or RSI
If RSI rises during a pullback, there’s a hidden bullish divergence. Exiting may be the worst thing to do.
🔹 Liquidity Maps
These show where stop losses and liquidation clusters are located. Often before any major move up, the market takes a detour to liquidate these levels.
Use these tools to stop reacting emotionally and start trading rationally.
📍 Final Thoughts
Small corrections are not the enemy.
Your emotional reaction to them is the real threat.
Before you panic-exit, ask yourself if this fear is justified or just mental conditioning.
The market always gives second chances but we rarely wait for them.
✨ Need a little love!
We pour love into every post your support keeps us inspired! 💛 Don’t be shy, we’d love to hear from you on comments. Big thanks , Mad Whale 🐋
📜Please make sure to do your own research before investing, and review the disclaimer provided at the end of each post.

Gold Showing Signs of Reversal After Hitting Key ResistanceHello Guys.
Gold has reached a major resistance zone around 3439–3425, which has already acted as a strong ceiling in the past. The price tapped into this area again, forming a clear divergence, and failed to break higher.
Here’s what stands out:
Divergence signals a weakening bullish momentum at the top.
The price rejected the resistance and is now breaking structure to the downside.
A minor pullback may occur before continuation, as shown in the projected moves.
First target: 3259.792
Second target (if support breaks): 3136.869, a deeper zone for potential bounce or further drop.
This setup hints at a bearish trend building up. Stay cautious on longs unless the price structure changes again.

BTC - Trap, Tap, and Blast Off!BTC has been overall bullish, trading within the rising blue channel (1). After reaching a local high, it entered a short-term correction, forming a falling red channel (2).
👀All eyes are now on the key demand zone (3), which aligns with the lower bound of both the red channel and the rising blue structure.
🔎As long as this confluence holds, we anticipate a potential bullish impulse in August.
A retest of the $111,500–$112,000 zone could serve as the trigger for the next leg toward $128,000. Let’s see if BTC is gearing up for another breakout or if a deeper correction is in play.
🔔 Disclaimer: This analysis is for educational and informational purposes only. It does not constitute financial advice or a recommendation to buy or sell any asset. Always do your own research and manage your risk accordingly.
📚 Always follow your trading plan => including entry, risk management, and trade execution.
Good luck!
All strategies are good, if managed properly.
~ Richard Nasr

American Exceptionalism - The End of an Era "The Eagle and the Fall"
O say can you see, from the towers so high,
A gleam in the steel and a spark in the sky?
The factories roared and the railways sang,
And liberty’s bell through the cities rang.
We rose from the soil, rough-handed and proud,
With faith forged in steel and heads unbowed.
The eagle soared on ambition's flame,
Each man in his dream, each street with a name.
From sea unto sea, we built and we bought,
In ticker tape winds, prosperity caught.
The market climbed like a hymn on the air—
A temple of glass, reflecting a prayer.
But greed wore a mask and danced in disguise,
A siren’s whisper in financier’s eyes.
And credit, like wine, flowed too freely at last,
While whispers of worry were buried in glass.
October arrived like a thief in the mist,
And struck with a silence too brutal to miss.
A breath, then a cry, then a plunge in the floor—
The numbers all bleeding, the dream no more.
Yet still in the ruins, beneath ash and flame,
Burned a stubborn belief in America’s name.
For even when mountains of fortune did crash,
The stars and the stripes held fast through the ash.
O nation of daring, of promise and pain,
You rise not once, but again and again.
Through boom and through bust, your story is spun—
A land still unfinished, still chasing the sun.

BITCOIN (BTCUSD): Recovery Starts
Bitcoin is going to rise from a key daily support.
After a liquidity grab, the market shows a clear strength,
forming a double bottom on an hourly time frame.
I expect a bullish movement at least to 117100
❤️Please, support my work with like, thank you!❤️
I am part of Trade Nation's Influencer program and receive a monthly fee for using their TradingView charts in my analysis.

$LPTUSDT Ready for 100% Move?The UPCOM:LPT chart looks pretty solid right now.
It’s holding strong above a rising trendline and key support zone around $6.20–$6.80.
After a healthy pullback, the price is bouncing again, and if this momentum continues, we could see a move toward $14.40, which is over 100% from here.
As long as the trendline holds, this setup looks bullish.

BTCUSDT: Trend in daily time frameThe color levels are very accurate levels of support and resistance in different time frames.
A strong move requires a correction to major support and we have to wait for their reaction in these areas.
So, Please pay special attention to the very accurate trend, colored levels, and you must know that SETUP is very sensitive.
BEST,
MT

GBPJPY Potential UpsidesHey Traders, in the coming week we are monitoring GBPJPY for a buying opportunity around 197.900 zone, GBPJPY is trading in an uptrend and currently is in a correction phase in which it is approaching the trend at 197.900 support and resistance area.
Trade safe, Joe.

Sell setup if the sell trigger gets activated.Due to a weak trend and a rejection from the all-time high, we’ve seen a strong rejection, suggesting that the price may drop further. If the sell trigger gets activated, it could be a good opportunity to open a sell position.

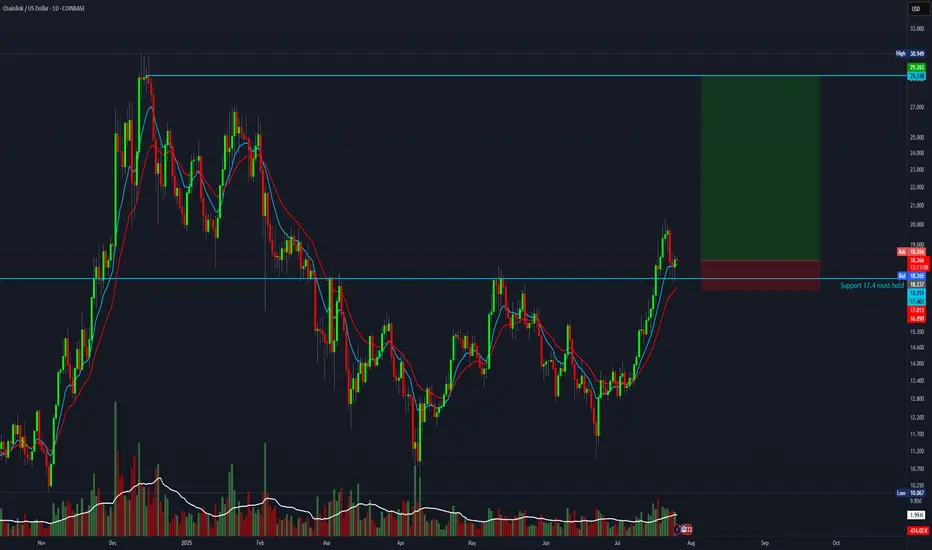
8 R setup for ChainlinkBTC is about to flip upwards. This is the chance to take a high-reward trade with an 8:1 risk-to-reward ratio.
Entry: 18.23
Stop-loss: 16.8
Target: 29
XAU/USD) bullish the support Read The captionSMC Trading point update
Technical analysis of (XAU/USD) on the 4-hour timeframe, indicating a potential bounce from a key trendline support within a rising channel.
---
Analysis Summary
Pair: XAU/USD (Gold Spot vs. USD)
Timeframe: 4H
Current Price: 3,338.715
Bias: Bullish rebound within ascending channel
---
Key Technical Elements
1. Ascending Channel:
Price has been respecting a well-defined rising channel, bouncing between support and resistance levels.
2. Key Support Zone:
The yellow highlighted area marks a critical support level and lower boundary of the channel.
Also intersects with the trendline, strengthening the potential for a bounce.
3. 200 EMA (Dynamic Support):
The 200 EMA at 3,343.616 lies just below current price, acting as a dynamic support level.
4. RSI (14):
RSI is around 34.93, nearing the oversold zone, suggesting a buying opportunity may be near.
---
Target Points
First Target: 3,402.099
Second Target: 3,446.661
---
Trade Idea
Direction Entry Zone Stop-Loss Target Zones
Buy 3,330–3,345 Below 3,320 3,402 / 3,446
Mr SMC Trading point
---
Summary
Gold is currently testing a key support level and ascending trendline. If price holds above this area, we can expect a bullish rebound toward 3,400–3,446 levels, aligning with the upper channel resistance.
Please support boost 🚀 this analysis)

XAUUSD: Bearish Bias SetupI am watching for a possible reversal in XAUUSD, predicting a rejection with a downside target around 3.300.
This downside target is reasonable based on this setup, as it is based on a previous bullish move, from which price could find support and bounce, or break below, and the downside momentum could start to continue down.
I am just sharing my thoughts on the chart, this is not financial advice. Always confirm your setup and manage your risk accordingly.

Losing over and over again? Losing over and over again? The problem isn’t your strategy – it’s your mind.
Let’s be honest:
Are you repeating the same old mistakes… even though you know they’re wrong?
You know you shouldn’t enter a trade without confirmation – but you still do.
You know you should stick to your stop-loss – but you move it.
You know your mindset is unstable today – but you still open the chart and… click.
So stop blaming the market.
You’re not losing because the market is cruel.
You’re losing because you can’t control yourself.
💣 The most dangerous psychological trap: Knowing it's wrong – but doing it anyway
It’s not because you lack knowledge.
It’s not because your system doesn’t work.
It’s because your emotions are running the show.
Ask yourself:
Have you ever traded just to escape boredom, helplessness, or emotional emptiness?
Have you ever used the chart to hide from real-life pressure?
Have you ever placed a trade just to relieve stress?
If your answer is yes... then the problem isn’t technical.
It’s psychological – and deeper still, it’s emotional.
👹 The 3 emotional demons controlling your trading – and you don’t even realise it
1. FOMO – You fear being left behind more than you desire to win
You see price running → you see others making money → you feel the pressure.
You think: “I can’t miss this move!”
→ You jump in impulsively, without analysis.
FOMO reflects a lack of trust in yourself.
You don’t believe more opportunities will come.
You’re not trading with clarity – you’re reacting from fear.
2. Revenge Trading – You can’t accept the feeling of being “wrong”
Every loss feels like humiliation.
You can’t handle being “mistaken.”
So you fight the market back – like someone who’s lost all reason.
But the market doesn’t care if you’re hurt.
You’re projecting your frustration onto a system that has no emotion.
→ In that moment, you’re no longer a trader – you’re a gambler trying to ease emotional pain.
3. Overtrading – You measure your worth by how many trades you win
You only feel valuable when you’re making money.
You hate “doing nothing” – it makes you feel useless.
So you keep trading – endlessly, irrationally.
Overtrading reflects a deep fear of stillness and lack of control.
You seek validation… from your trading account.
🔍 Painful truth: You’re not losing because of the market – you’re losing because of unrealistic expectations
You expect to always be right.
You expect to get rich quickly.
You expect to prove something – to others and to yourself.
You pressure yourself to perform – and when results don’t come, your psychology collapses.
You’re not trading to beat the market.
You’re trading to fix something inside yourself.
✅ The solution? It’s not more knowledge – it’s emotional honesty
Stop trading the moment you feel out of control – whether you're winning or losing.
Keep an emotional journal daily – even on days you don’t trade. Be raw. Be real. No excuses.
Ask the right questions:
Am I trading to make money – or to soothe an emotional void?
Am I entering because of a setup – or because I’m afraid of missing out?
Do inner work outside of trading: meditate, exercise, heal emotionally, take breaks, talk to someone who gets it.
💬 Final thought:
Losing isn’t scary – what’s scary is never facing the real reason behind your losses.
Stop searching for the next shiny indicator.
Stop chasing strategies with a “90% win rate.”
You just need a decent system – and a strong mind to execute it.
True success comes when you no longer use trading to prove yourself –
but treat it like a calm, patient profession.
#TradingPsychology #EmotionalDiscipline #FOMOTrading #RevengeTrading #Overtrading
#MindsetMatters #TraderGrowth #SelfAwareness #TradingUK #ForexEducation #InnerGameOfTrading #ConsistencyIsKey #MentalEdge

BTC 125k - $130KHello Traders,
Using Fibs and Elliot Waves I show possible BTC targets coming soon in the next leg up. Lets see how this plays out.

CADJPY TRADE RECAPLooking Into This Trade That I shared To You Yesterday. I Just Want To Explain The Reason Behind This Trade And I Hope It Is Going To Add Something In Your Trading
