GOLD The Target Is UP! BUY!
My dear followers,
I analysed this chart on GOLD and concluded the following:
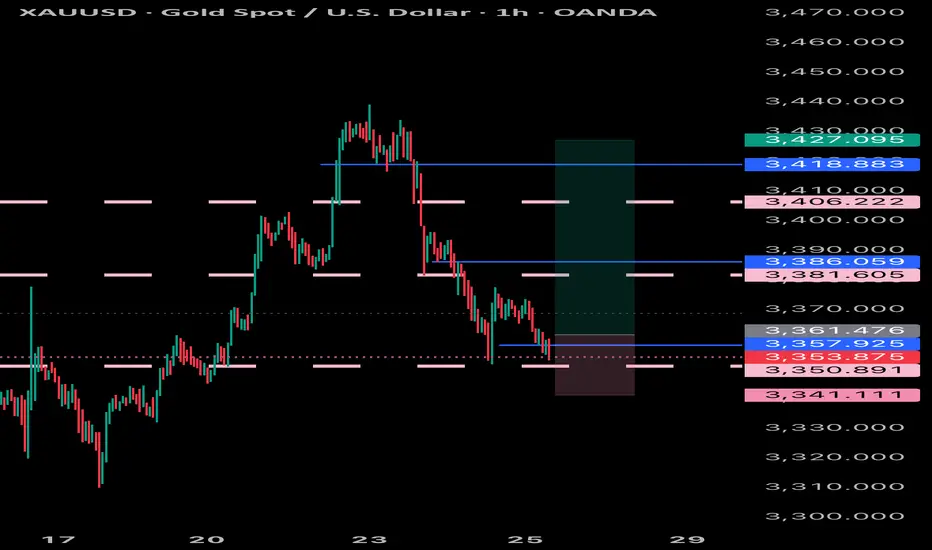
The market is trading on 3354.1 pivot level.
Bias - Bullish
Technical Indicators: Both Super Trend & Pivot HL indicate a highly probable Bullish continuation.
Target - 3361.01
Safe Stop Loss - 3350.5
About Used Indicators:
A super-trend indicator is plotted on either above or below the closing price to signal a buy or sell. The indicator changes color, based on whether or not you should be buying. If the super-trend indicator moves below the closing price, the indicator turns green, and it signals an entry point or points to buy.
Disclosure: I am part of Trade Nation's Influencer program and receive a monthly fee for using their TradingView charts in my analysis.
———————————
WISH YOU ALL LUCK
Community ideas

GOLD XAUUSD BUY We shall be looking to scalp a bit on the gold as it has been selling for a while now and can expect a reversal as nothing sells forever in the market, so can buy a dip and expect it to push a fair amount
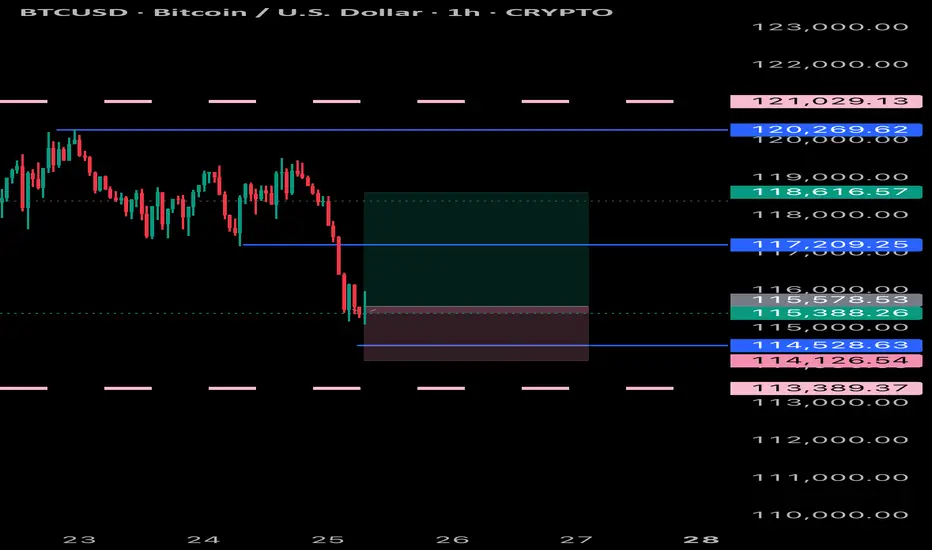
BTCUSD BUYING can expect a bullish move from bitcoin as it has dropped a fair amount and can extract a reversal to the up side due to being oversold
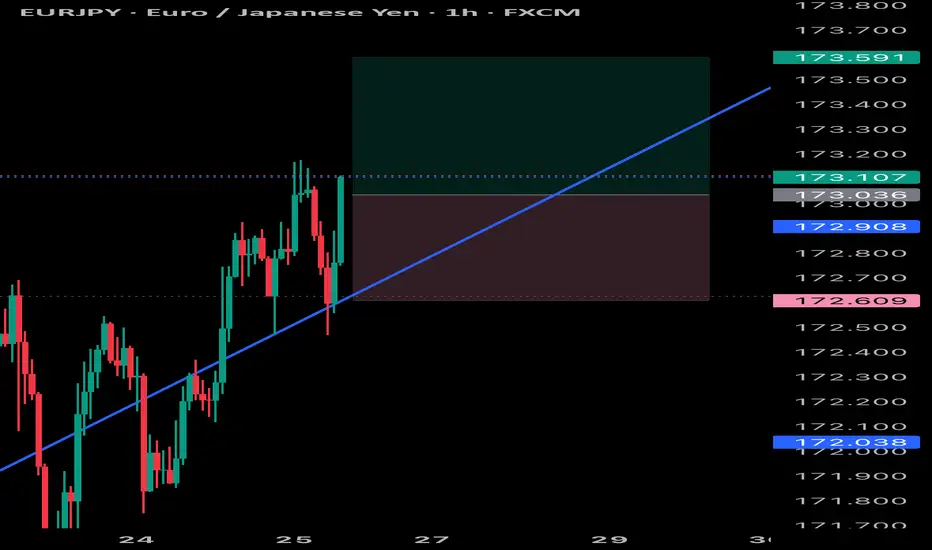
EURJPY BULLS Bullish move from Eurjpy and will keep following it, to its very top with small pullbacks coming but stay prepared can put buy stops
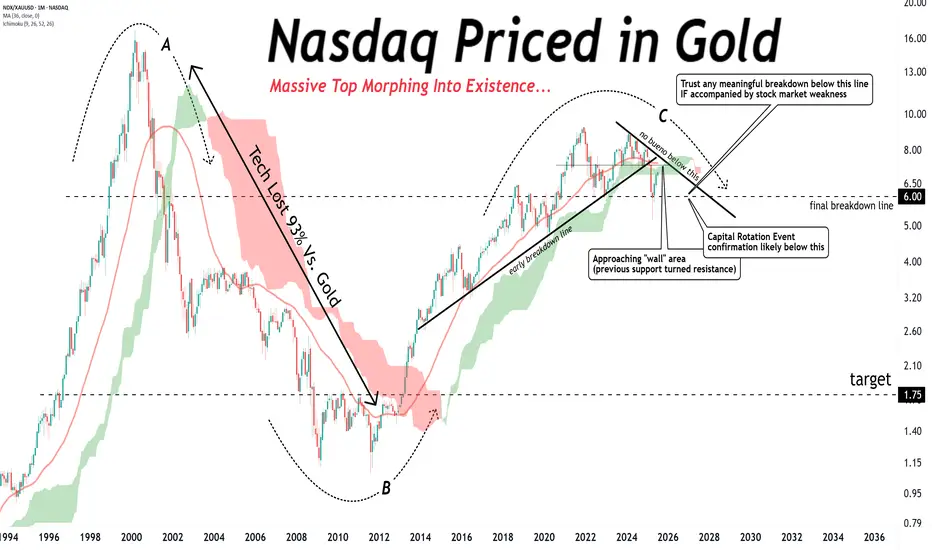
Tech stocks are still not out of the woods, priced in gold.Tech stocks are still not out of the woods, priced in gold.
Right now, it looks like a BIG TOPPING pattern morphing into existence.
No man's land.
BTC.d strong move down ahead die to find 0,382Altcoin season is coming 🚀
If the 38.2% Fib level will not be broken a next strong move will come. It indicates a next strong move down and it will go much lower.

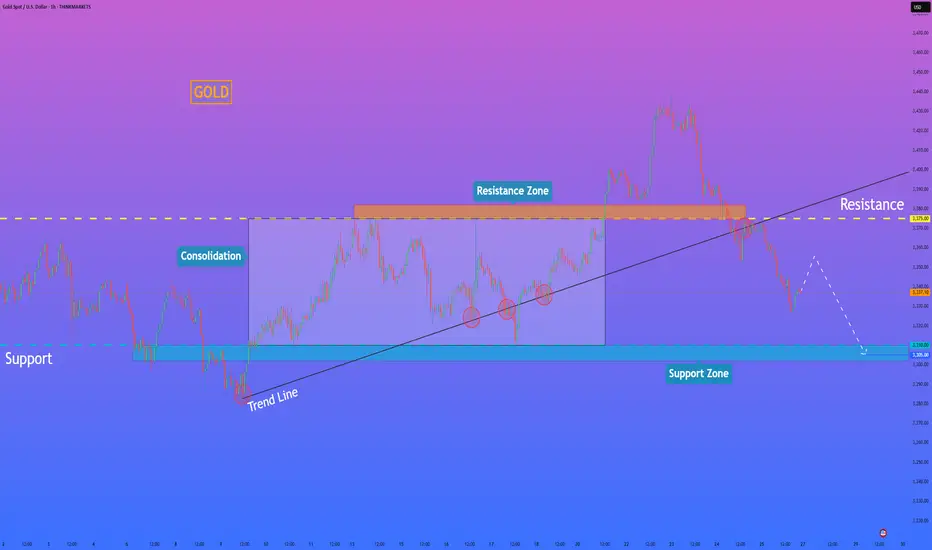
HelenP. I Gold can continue to decline to support zoneHi folks today I'm prepared for you Gold analytics. If we look at the price chart, we can observe a significant shift in the market structure, highlighted by the recent decisive break of a long-standing ascending trend line. This event suggests that the previous bullish momentum has been exhausted and that sellers are now taking control. The bearish case is further strengthened by the price trading below the key horizontal zone around 3375, which previously acted as support during the consolidation phase and is now poised to act as strong resistance. My analysis for a short position is built on this structural change. I believe that any attempt by the price to rally back towards the broken trend line or the 3375 resistance zone will likely be met with significant selling pressure, confirming the new downward trend. A rejection from this area would be the key condition validating the bearish bias. Therefore, the primary goal for this developing downward impulse is set at the 3305 level, as this aligns with the next major support zone where the price is likely to find its next pause. If you like my analytics you may support me with your like/comment.❤️
Disclaimer: As part of ThinkMarkets’ Influencer Program, I am sponsored to share and publish their charts in my analysis.
Long Position on Dow Jones Industrial Average
Initiating a long position at 44,456, supported by robust economic data and stronger-than-expected corporate earnings. These indicators point to continued resilience in the U.S. economy, potentially allowing the Federal Reserve to consider rate cuts sooner than previously anticipated — a positive catalyst for equities.
📌 Entry: 44,456
🛑 Stop Loss: 44,207
🎯 Take Profit: 44,900
Monitoring price action closely as market sentiment continues to shift in response to macroeconomic developments.

Potential Long on WTI
Crude oil is showing potential for a bullish move due to increasing speculation about a possible agreement between China and the United States.
As we approach August 1st – the date associated with Trump's proposed tariff actions – the chances of a diplomatic breakthrough are growing.
If the two economic giants reach any form of understanding, it could trigger a wave of optimism in the oil market, potentially leading to a strong upward move.
Market participants should closely watch developments related to the US-China negotiations over the coming days.

AGTUSDT.P LONGLets see some strong bullish moments at our entries level and most important we need to retest it with bullish candles. If not spotted than BOTTOM level is our point.
Let me give you guys the brief why i have chosen these two entries level as we can all see its forming a W pattern at this level. If price shows bullish momentum at these level than probably we are forming W.
Rest DYOR.
Follow me and support me to post more analysis.
Thank you.

USDJPY: Breaking Out With Macro Backing 🟢 USDJPY | Breakout Opportunity Above Resistance
Timeframe: 1H
Bias: Bullish
Type: Break and Retest
📊 Technical Setup
USDJPY is currently consolidating at a key 4H resistance zone (147.75–147.90). A clean breakout and retest of this area will confirm bullish continuation.
• Entry: Above 147.90 (after confirmed candle close + retest)
• SL: Below 147.30
• TP: 148.90 / 149.60
• RR: ~1:2.5
• Indicators: RSI showing strong upside momentum, holding above 50
🧠 Fundamentals + Macro Confluence
• USD Strength: Strong macro & delayed rate cuts support USD upside
• JPY Weakness: BOJ remains dovish; risk-on sentiment weighing on JPY
• COT + Conditional Score: USD score increased to 17, JPY dropped to 8
• Risk Sentiment: VIX at 14.2 = RISK ON → bearish JPY bias
🧭 Gameplan
“Wait for confirmation above resistance before entering”
🔔 Set alerts around 147.90 and monitor lower timeframes for retest and bullish candle structure.

The move is up to the buyersHi traders and investors!
The price has already played out the upper boundary of the scenario, rising above 120,500. Then it also reached the lower boundary by dropping below 115,222.
Now we are at an interest moment: will the price continue to move upward or not?
This situation is clearly visible on the 8-hour timeframe.
On the 8H chart, we see a sideways range, similar to the 1D timeframe. The lower boundary is 115,736 and the upper boundary is 123,218. The active initiative is currently with the buyers, and their target is 120,998 и 123,218.
There is a notable bar attacking the lower boundary (115,736) with very high volume. The high of that bar is 118,451. We’re watching to see whether buyers absorb this bar — that will determine how the next move plays out.
There are three key levels where buyers may step in: 116,782, 116,128, and 115,736. If the price drops to any of these, we can look for a long setup.
Above, we also have three resistance levels from the sellers: 118,451, 119,676, and 120,247. We’ll be watching how sellers react if the price tests these zones.
This analysis is based on the Initiative Analysis concept (IA).
Wishing you profitable trades!

Weekly Trade Outlook | Lessons in Discipline, Risk & PerspectiveGreetings Traders,
In today’s video, I’ll be walking you through my end-of-week trade outlook, breaking down every setup I took throughout the week. This session is designed to offer insight into how I apply risk management, trading rules, and maintain psychological discipline in real-time market conditions.
Whether you're struggling with emotional trading, inconsistency, or overtrading, this video will give you a fresh perspective on how structure, faith, and discipline can shape a sustainable trading approach.
Remember: respect your trading rules, pray over them daily, and ask God for the strength to remain disciplined—so you don’t become your own worst enemy in the market.
Let’s grow together,
The Architect 🏛️📈

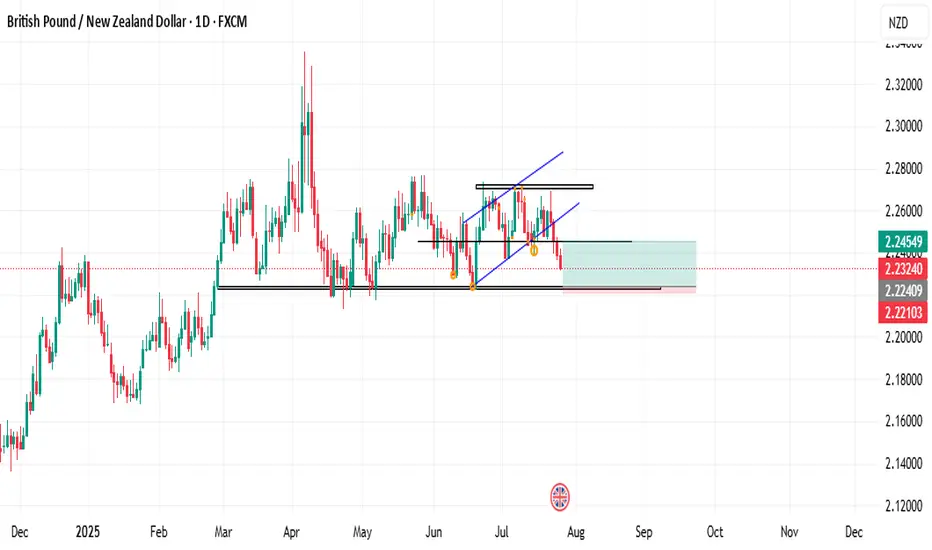
GBPNZD BUY IDEAWe're currently in a downtrend, but the price is approaching a key reversal support zone. Based on previous price patterns in that support zone, the price has consistently reversed upon reaching it.
We'll be on the lookout for signals the market sends at the zone
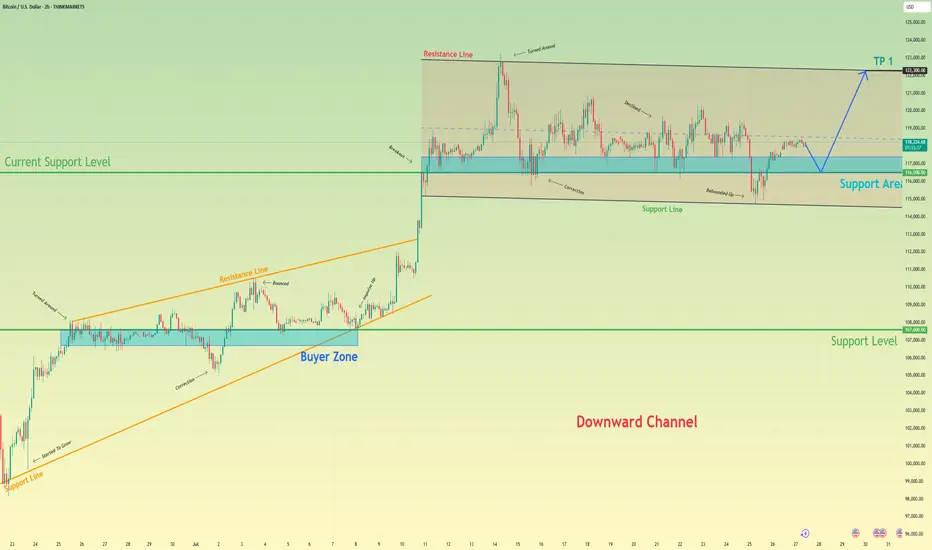
Bitcoin will rebound up from support area to resistance lineHello traders, I want share with you my opinion about Bitcoin. After a strong upward trend that originated from the buyer zone and evolved through an upward wedge, bitcoin executed a decisive breakout, shifting the market into a new, higher-value market phase. This powerful move has since led to an extended period of wide consolidation within a well-defined horizontal channel, a classic sign of the market pausing to absorb the prior impulse and build cause for its next major leg. Currently, the asset's price action is rotating within this structure, defined by a key support area around 116500 and an upper resistance line. Having been rejected from the top, the price is now completing another downward correction and is approaching the channel's foundational support for a crucial test. The primary working hypothesis is a long scenario, predicated on the proven resilience of this support level. A confirmed upward rebound from this 116500 zone would signal that the accumulation within the channel is continuing and likely to resolve upwards. Therefore, the tp is logically and strategically placed at 122300, as this level not only coincides perfectly with the channel's upper resistance line but also represents the completion of the internal rotation, setting the stage for a potential continuation of the larger uptrend. Please share this idea with your friends and click Boost 🚀
Disclaimer: As part of ThinkMarkets’ Influencer Program, I am sponsored to share and publish their charts in my analysis.
Bearish potential detected for SDFEntry conditions:
(i) lower share price for ASX:SDF along with swing of DMI indicator towards bearishness and RSI downwards, and
(ii) observing market reaction around the share price of $5.89 (open of 20th June).
Stop loss for the trade would be:
(i) above the potential prior resistance of $6.08 from the open of 4th December 2024, or
(i) above the potential prior resistance of $6.19 from the open of 3rd July 2024, depending on risk tolerance.

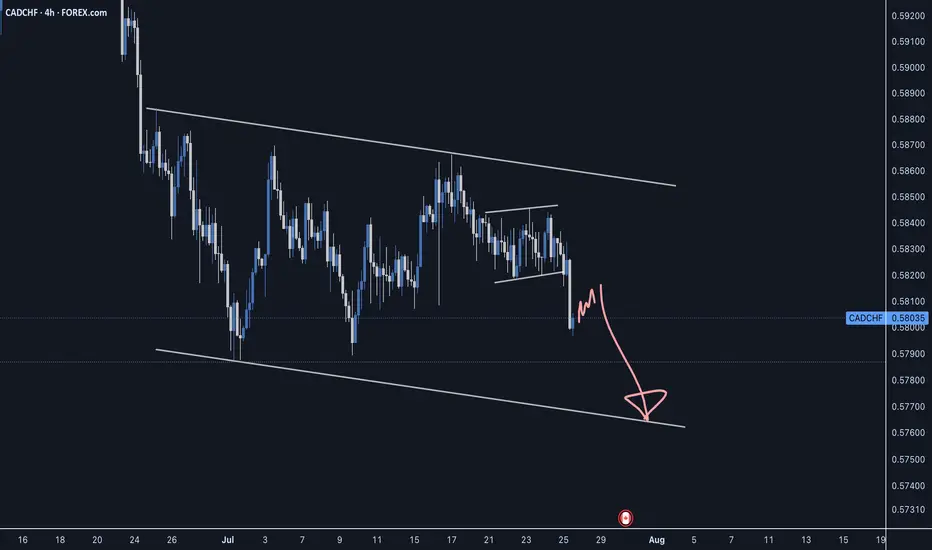
CADCHF - Sellers still in controlCADCHF has been moving within a reversal structure which could make another swing low to complete this pattern before the next move up.
Good Luck
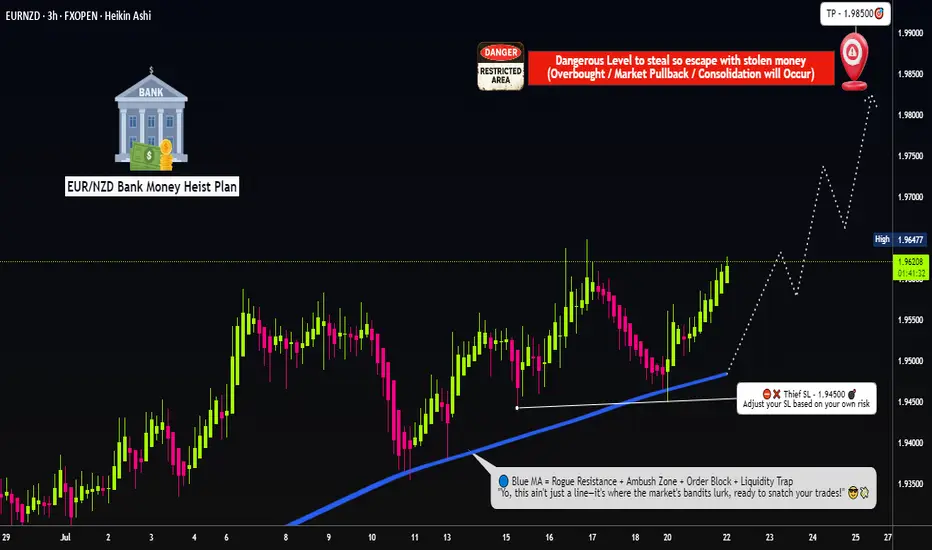
Euro vs Kiwi Bull Raid: High Reward Target Strategy🏴☠️EUR/NZD Heist Plan: "Robbing the Kiwi Vault with Thief Trading Style" 💰🔥
🌍 Hi! Hola! Ola! Bonjour! Hallo! Marhaba! 🌍
Dear Money Makers, Chart Bandits & Market Strategists! 🤑💸✈️
Here’s the EUR/NZD (Euro vs Kiwi) blueprint crafted using the signature 🔥Thief Trading Style🔥 — a blend of bold technicals, insightful fundamentals, and pure tactical precision. We’re setting our sights on a potential bullish breakout — targeting the high-security resistance zone where big money hides.
💡The Robbery Plan (Thief Entry Setup):
🟢 Entry Point:
"The vault is wide open — time to extract the bullish loot!"
⚔️ Entry can be taken at market price, but the smarter thieves use a layered Buy Limit strategy at pullback zones (near swing lows/highs on the 15-30 min TF) to snipe the best entries with reduced exposure.
🔁 Scaling in = DCA-style Thief Method: split entries for efficiency, just like robbing in waves.
🔻 Stop Loss Plan (Escape Route):
🔒 Place SL below the recent swing low using 3H timeframe (1.94500 for scalpers/day traders).
🛡️ Adjust based on risk appetite, lot size, and number of entries in play.
🎯 Take Profit Target:
🏁 Exit the heist near 1.98500, where strong resistance awaits. That’s the Danger Zone — the edge of our mission.
🔍EUR/NZD Outlook Snapshot:
This pair is flashing bullish vibes due to:
🏛️ Macro & Fundamental tailwinds
📊 COT positioning & Sentiment readings
🔗 Intermarket influences
📈 Price structure & liquidity zones
For more depth: dive into external analysis tools, COT reports, and sentiment dashboards to fine-tune your view. The direction is clear — the bulls are assembling.
⚠️ Trading Alerts & Risk Management Reminders:
🚨 News releases = volatility mines.
Before entering, make sure to:
Avoid new positions near red-flag economic events
Protect your open trades with trailing SLs or partial exits
Stay alert — the market shifts fast, adapt faster
💬 Final Word from the Vault Boss:
📢 Smashing likes = boosting the crew. 💥
Support the Thief Trading Style by hitting the BOOST button and keep the robbery crew rolling strong 💪💸
We're here to outsmart the market — one clean chart raid at a time.
Stay tuned for the next master plan. Until then, rob smart, rob safe. 🧠🔐💥
SPX500 NEARING AN IMPORTANT FIB. EXTENSION RESISTANCEIn this weekend's analysis I find the SPX500 to remain BULLISH for next few days as we have strong closings outside the upper KC band and also touching the upper Bollinger band on the higher time frames from Daily to Monthly charts. It's also important to note that declining volume bars is NOT supporting the monthly rally, while MACD, RSI divergences are also sounding warning sirens that it's near a major correction territory which I have measure as the fib extension 0.618 from the October, 2022 base or support on the monthly chart. As signaled last week that we could be getting a capitulation candle soon to the fib target. Once we get a reversal candle on the 4 Hours it will confirm that the intermediate tops is achieved on the SPX500 and a correction is highly probable. So our trade thesis is Bullish until we get a confirmed bearish signal on either the 4H or 1D timeframe with Stop loss at 6377 level. Thanks for visiting my publication and trade idea on the SPX500. Cheers and happy trading to everyone.

"NASDAQ 100 Heist – Scalp, Swing, or Hold? (Full Plan)🔥 NASDAQ 100 HEIST PLAN – BULLISH LOOT AWAITS! 🔥
🚨 Attention Market Robbers & Money Makers! 🚨
(Swing/Day Trade Strategy – High-Risk, High-Reward Play)
🎯 Mission Objective: Loot the NDX100/US100 (NASDAQ 100) Like a Pro!
Based on Thief Trading’s ruthless technical & fundamental analysis, we’re executing a bullish heist—targeting the Red Zone (high-risk, high-reward area).
⚠️ WARNING: Overbought market, consolidation zone, potential bear traps—weak bears may get slaughtered! Strong hands only!
🔐 ENTRY: The Vault is OPEN!
"SWIPE THE BULLISH LOOT!" – Any price is a steal, but smart thieves use:
Buy Limit Orders (15m-30m TF) near recent swing lows/highs.
DCA/Layering Strategy – Multiple limit orders for max loot.
Breakout Confirmation – Don’t jump in early; wait for the real move!
🛑 STOP LOSS: Protect Your Stash!
Thief’s SL Rule: Nearest 4H swing low (22,600) – WICK LEVEL ONLY!
DO NOT place SL before breakout! (Patience = Profit.)
Adjust SL based on risk, lot size, and number of orders.
🎯 TARGETS: Escape Before the Cops Arrive!
Main Take-Profit: 24,400 (or exit early if momentum fades).
Scalpers: Longs ONLY! Use trailing SL to lock in profits.
Swing Traders: Ride the wave like a true market pirate!
📰 FUNDAMENTAL BACKUP: Why This Heist Will Work
Bullish momentum in NDX100 driven by:
Macro trends (Fed, inflation, tech earnings).
COT Report & Institutional positioning.
Geopolitical & Sentiment Shifts.
Intermarket correlations (USD, Bonds, Tech Sector).
(Stay updated—markets change FAST!)
⚠️ TRADING ALERT: News = Danger Zone!
Avoid new trades during high-impact news.
Trailing SL = Your best friend.
Lock profits early if volatility spikes!
💥 BOOST THIS HEIST! 💥
👉 Hit LIKE & FOLLOW to strengthen our robbery crew!
🚀 More heists coming soon—stay tuned, thieves! 🚀

Golden Opportunity Ahead: Wave 5 Bullish Breakout Incoming!After perfectly completing the **bearish Gartley pattern**, gold dropped precisely to the **target zone at 3,323**, just as predicted. This move confirmed the formation of **Wave 5**, signaling the end of the corrective phase.
Now, all signs point to a **strong bullish reversal**—and the next step is a powerful rally toward the predefined targets. This is a **prime buying opportunity** for traders looking to ride the wave!
### 🎯 **Buy Zone:**
- **Entry:** Around **3,323 USD**
### 📈 **Profit Targets:**
| Target | Fibonacci Level | Price (USD) |
|--------|------------------|-------------|
| TP1 | 1.0 | 13,447.875 |
| TP2 | 1.27 | 13,536.025 |
| TP3 | 1.618 | 13,649.640 |

Bitcoin Daily shows us that a HUGE Hurdle has been crossed
The question I will answer in this post is "What is the significance of that Blue line that BTC PA is now sitting on"
On the Daily chart, we can see it has been tested as support and Held.
Previously, it was resistance..
So what ? This has happened many times before.
Lets zoom out and look at the weekly.
So, we see that the Blue line was also the rejection zone in 2021.
Infact, if you look, it has rejected BTC PA 5 times since March 2021 and we have finaly managed to get over it and seem to be comfortable using ot as support now.
This leaves the door open to move higher once PA is ready
But there is WAY MORE to this
Lets look at the monthly chart
So now we see that that same Blue Arc has also been rejecting BTC PA since 2011.
That is nearly the entire life span of Bitcoin and it is certainly the entire life span of its current Bullish momentum since we entered the current channel we are in..
So, in many way, this could be seen as a new beginning, a New cycle.
We do need to remain cautious for now though. As we can see, we did get over this line in 2013 but fell back below......and of course, the possibility for this to happen again exists BUT we now have massive Corporate investment. This could stop that fall.
PA needed to get over this line or fall.
Should this fail to hold for now, we will return to lower lines of support, around 70K- 80K but I would anticipate a massive buying spree should that happen.
The next few months in Bitcoin are absolutely CRUCIAL.
We need to remain above this Arc.
And as I have shown months ago, this Arc is not just a line drawn freehand.
It is actually calculated and is part of a Fibonacci Arc.
The Monthly chart also shows us we are near the ATH Zone on a time span shown under PA on this chart.
We may not see the steep rise we have previously...but the Major Victory is remaining ABOVE this Blue Arc
Fingers Crossed
