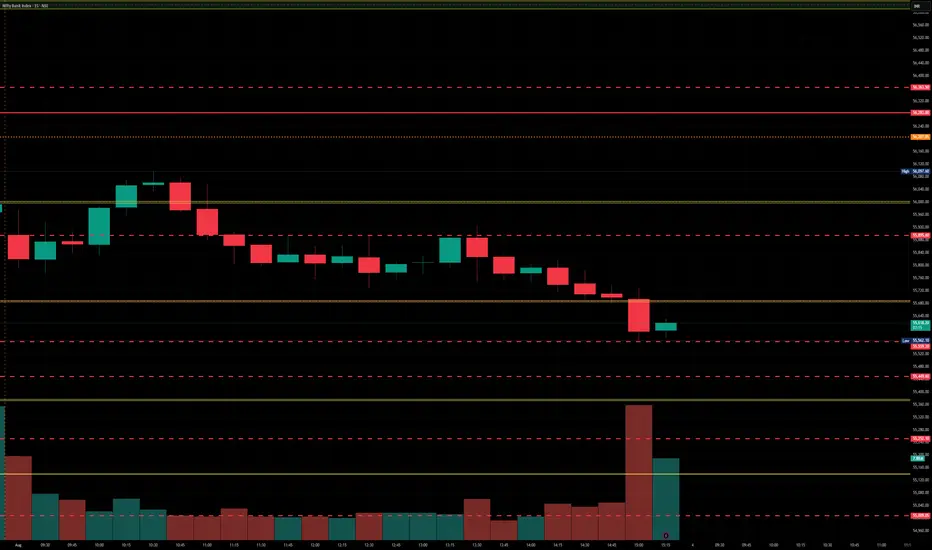
BankNifty levels - Jul 04, 2025Utilizing the support and resistance levels of BankNifty, along with the 5-minute timeframe candlesticks and VWAP, can enhance the precision of trade entries and exits on or near these levels. It is crucial to recognize that these levels are not static, and they undergo alterations as market dynamics evolve.
The dashed lines on the chart indicate the reaction levels, serving as additional points of significance. Furthermore, take note of the response at the levels of the High, Low, and Close values from the day prior.
We trust that this information proves valuable to you.
* If you found the idea appealing, kindly tap the Boost icon located below the chart. We encourage you to share your thoughts and comments regarding it.
Wishing you successful trading endeavors!
Community ideas
APT - HUGE POTENTIAL (130+% SPOT) You probably forgot about this altcoin but it is justified. Downtrend since 2023 and lower highs, lower lows but....
If we look more close and use tool fixed price volume we can see that price is above VAL (Value area low), we had break through but price returns..Also good reaction of FVG (Fair value gap).
Now, we can try buy this coin and have some stop lose. Price is in range 172 days and all people forget abut this coin. Analysis is right only if we close daily candlestick about 6$.
Stop lose can be below 4.4$ which is 6-7% of losing.
Second entry is monthly level at 3.3 and stop lose should be below the lowest low 3$.
For me is great opportunity because risk reward is excellent.
Ivan

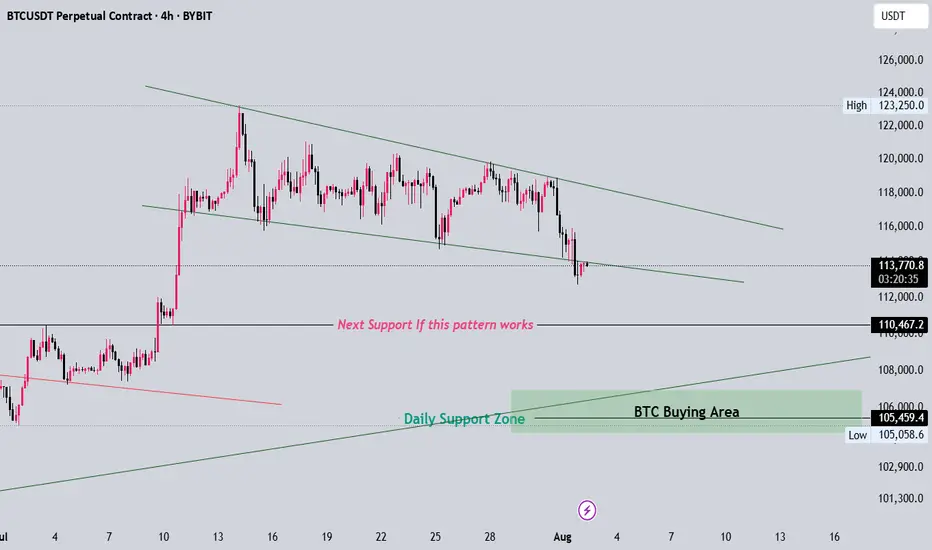
BTC Clear Idea if this pattern worksFor now please observe some time if btc breaks down to next target which is arround 110k then btc will definetly move towards 105k becuase that is its daily trendline support
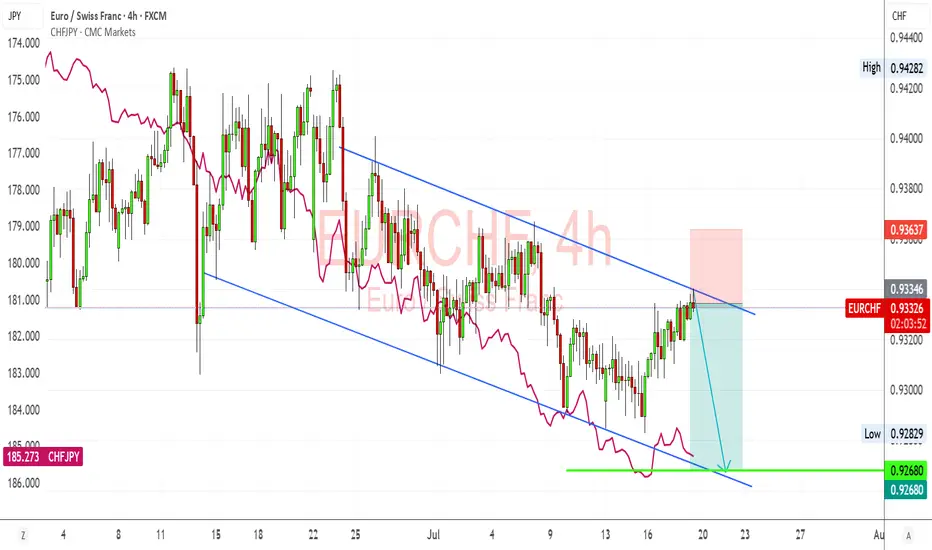
EURCHF – Bearish Channel Holds Firm, CHF Strength Set to ResumeEURCHF just tapped into the descending channel resistance again and is showing signs of rejecting. I'm expecting a bearish continuation here, especially given the strong CHF momentum recently, supported by safe-haven flows and Swiss inflation stability. If the pair fails to break above 0.9340, I’m watching for a downside push back toward 0.9270–0.9265, completing another leg within the structure.
🔍 Technical Setup (4H):
Channel Structure: EURCHF remains firmly within a downward-sloping parallel channel since mid-June.
Resistance Rejection: Price recently tested upper channel resistance (~0.9335–0.9340 zone), aligning with trendline rejection.
Target Support: 0.9270–0.9265 (channel base and key horizontal level).
Confluence: CHFJPY overlay (pink line) is rising again, suggesting renewed CHF strength—this usually weighs on EURCHF.
💡 Fundamental Insight:
EUR Side:
ECB officials remain cautious, but with recent EU data showing weaker growth (especially PMIs and sentiment), euro upside is capped.
The ECB is likely to pause further tightening, while other central banks like SNB remain firm on inflation risks.
CHF Strength:
The Swiss National Bank (SNB) still leans hawkish, with stable inflation giving room to hold rates steady or tighten if needed.
CHF benefits from risk-off flows amid global tariff headlines, China slowdown, and Middle East tensions.
Rising CHFJPY = clear CHF strength across the board.
⚠️ Risks:
If eurozone data surprises to the upside (e.g., inflation rebounds), EURCHF could break out of the channel.
A sudden drop in geopolitical tension or strong risk-on rally could weaken CHF as safe-haven demand falls.
SNB jawboning or FX intervention is always a wildcard.
🧭 Summary:
I’m bearish on EURCHF while it respects this well-defined descending channel. The technicals show consistent lower highs and lower lows, while the fundamentals continue to support CHF strength due to risk aversion, stable inflation, and a resilient SNB. My short bias is valid as long as price remains below 0.9340, with downside targets at 0.9270–0.9265. CHFJPY rising confirms franc leadership across FX markets, and EURCHF is likely a lagger following broader CHF strength.
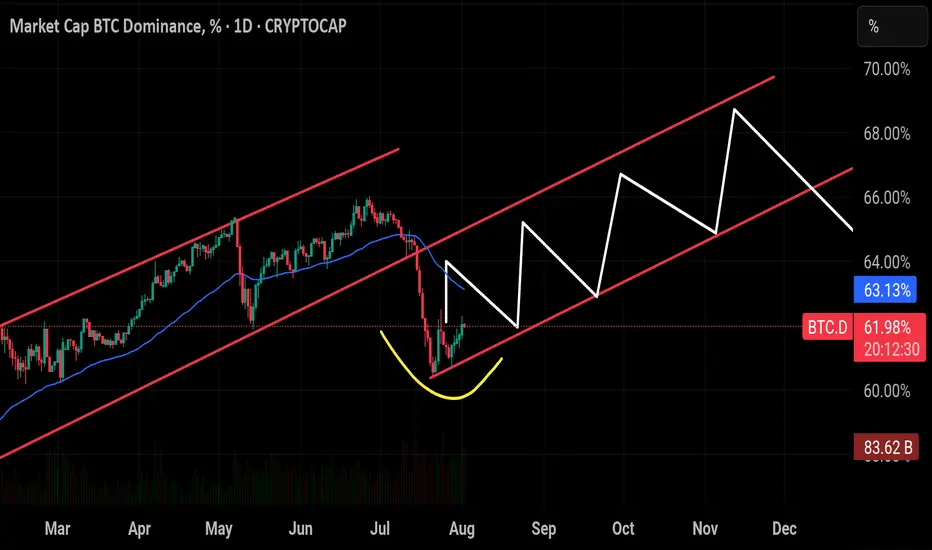
$BTC Dominance seems to be replaying its historical pattern —CRYPTOCAP:BTC Dominance seems to be replaying its historical pattern — after peaking around 66%, it’s now pulling back toward the critical 60% support zone. If the breaks below this level have triggered sharp drops toward 54%, often marking the start of strong altcoin seasons. Unless BTC.D closes back above 65%–66%, history suggests we could see another wave of altcoin outperformance in the weeks ahead. And looking at the chart structure, a breakout in BTC’s price action could align with this cycle, potentially driving Bitcoin toward a new all-time high soon.
Btcusd We are expecting a retracment back to the zone then a reversal candle stick on de zone then we sell

If level breaks, the buyers last line of defense will be lost The red-marked zone, which acts as both dynamic and static resistance, is the only hope and the only scenario that could trigger an altseason.

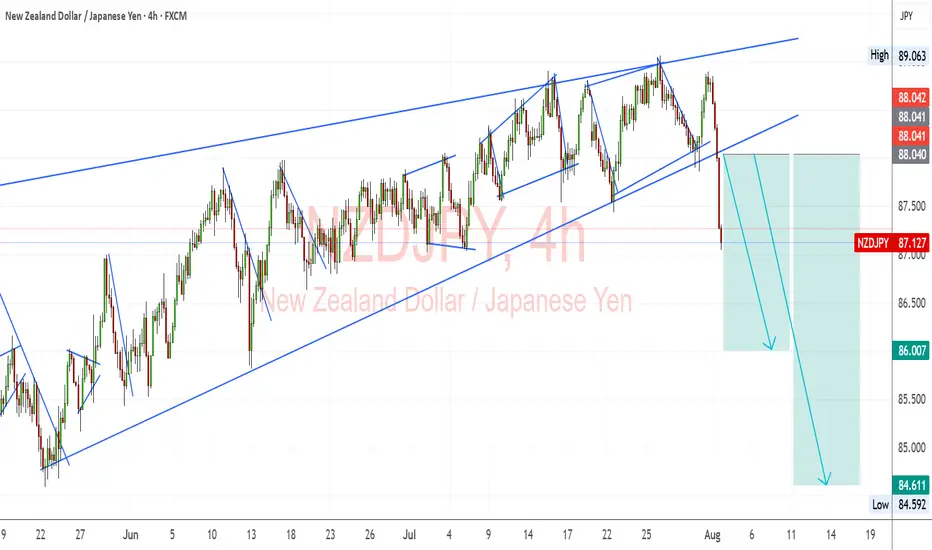
NZD/JPY: Bearish Breakdown from Ascending ChannelNZD/JPY has decisively broken below its ascending channel, signaling a shift from bullish structure to bearish momentum. This move aligns with fundamental headwinds for NZD and the potential for JPY strength amid intervention risks and global risk-off sentiment.
Technical Analysis (4H Chart)
Pattern: Breakout from ascending channel support confirms a bearish reversal.
Current Level: 87.12, trading below the broken trendline with strong selling pressure.
Key Support Levels:
86.00 – first bearish target and immediate support zone.
84.60 – extended bearish target if momentum continues.
Resistance Levels:
88.04 – previous support turned resistance.
89.06 – upper boundary and invalidation zone for bearish bias.
Projection: Price is expected to retest 86.00, and if broken, further decline toward 84.60 is likely.
Fundamental Analysis
Bias: Bearish.
Key Fundamentals:
NZD: Pressured by global tariffs and risk-off sentiment.
JPY: Supported by potential FX intervention from Japan’s Ministry of Finance and safe-haven demand.
US Data Impact: Weak NFP boosted Fed cut bets, but risk-off flows strengthen JPY against risk currencies like NZD.
Risks:
China stimulus or a risk-on shift could lift NZD.
Lack of BOJ action may weaken JPY temporarily.
Key Events:
RBNZ policy outlook.
BOJ comments or intervention signals.
US CPI influencing global risk sentiment.
Leader/Lagger Dynamics
NZD/JPY is a lagger, reacting to risk sentiment and JPY moves, with JPY strength leading the pair lower.
Summary: Bias and Watchpoints
NZD/JPY is bearish, with a clear technical break from its ascending channel. The pair targets 86.00 initially and 84.60 on extended downside. Key watchpoints include BOJ FX policy, RBNZ stance, and global risk sentiment, especially if markets move deeper into risk-off mode.
SOL 1H – Bounce From Demand, Can It Reclaim the Breakdown Zone?SOL tapped into the key demand zone near $157 and is now showing signs of a reaction bounce. Price is approaching the former support-turned-resistance zone around $184 — a critical level that marked the start of the previous breakdown.
A reclaim of that zone would suggest bulls are regaining control, opening up room toward the $190–$200 region. Until then, it remains a lower high attempt inside a bearish structure.
📌 Demand bounce
📌 Bearish market structure
📌 Key resistance at ~$184
No confirmed reversal yet — just a bounce until proven otherwise. Keep watching the structure evolve.

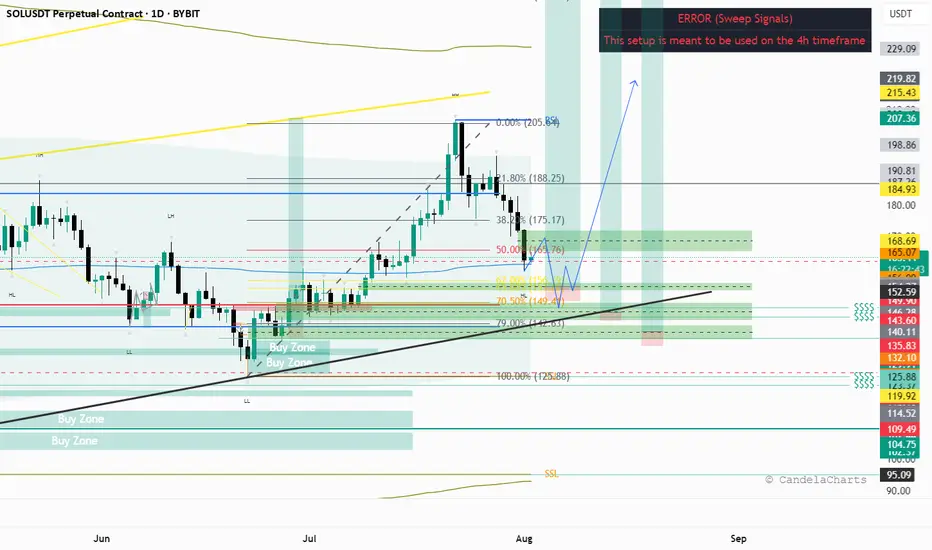
SOL Sol next move idea.
Sol's final leg down before the final leg up for this bullrun. Fill the daily imbalances come to 70 % fib retracement level also a volume POC on a discount area below 50% of the dealing range and the daily trendline.
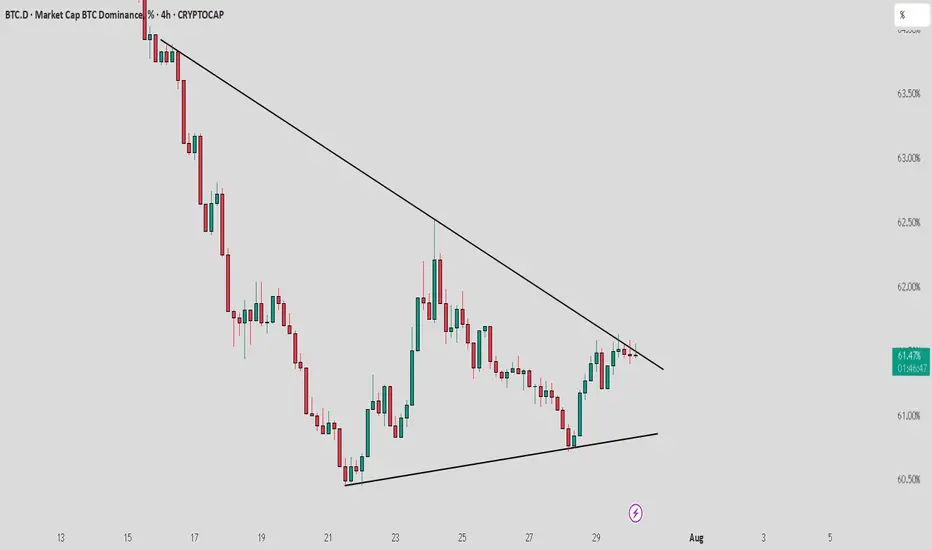
BTCDOM : Near to breakout from trendline resistanceBitcoin dominance is nearing a breakout from trend line resistance. Keep a close watch as a breakout from here could lead to a short-term market correction, negatively affecting altcoins. Stay cautious with your long positions and use proper stop loss strategies.
KEEP A CLOSE WATCH ON IT
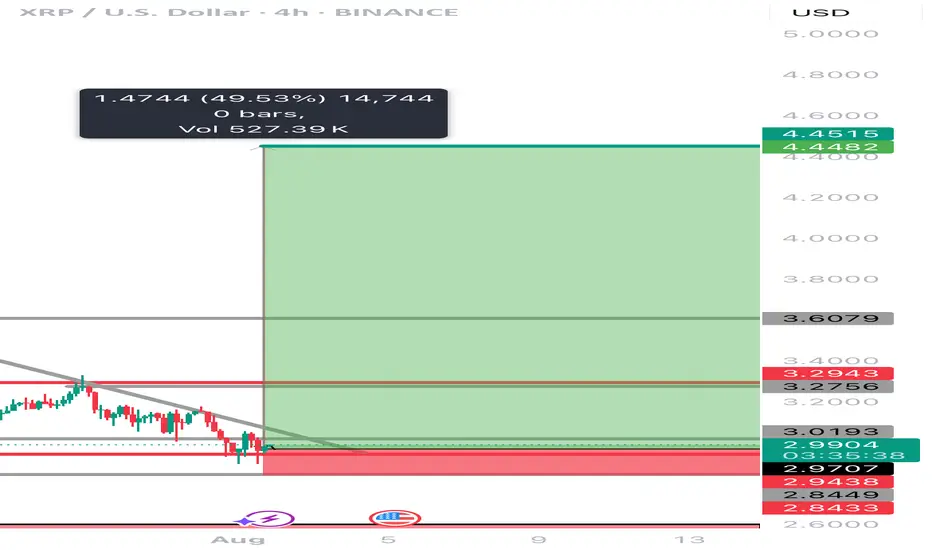
Can XRP obtain a 50% increase in the next few weeks XRP has recently been under a lot of manipulation lately! Is it time for the bulls to finally step in and move the price point on this digital asset to a 50 percent increase to another ATH at $4.45………? The world will see with the next few weeks! And why is #Bradgarlinghouse X account always following 589………..? It’s it a signal or is he just trolling
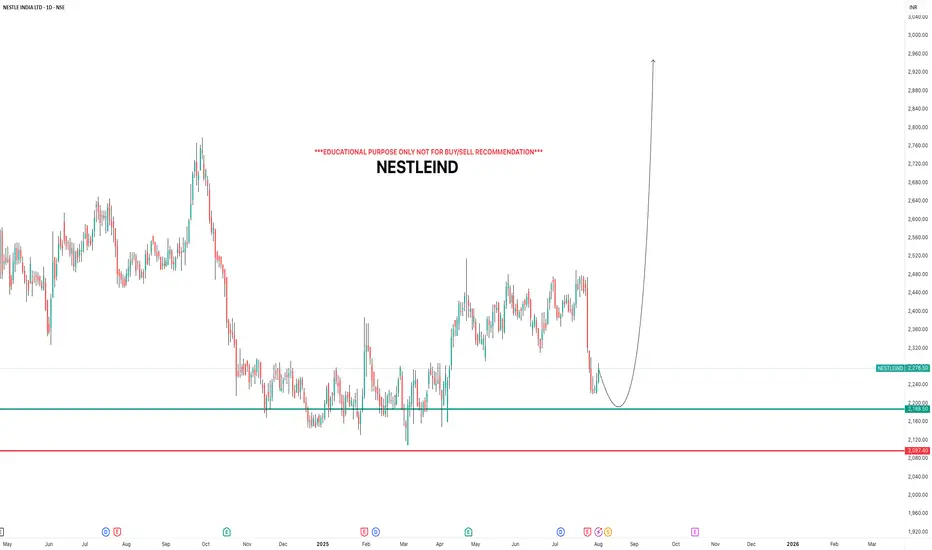
NESTLEINDIAi Observed these Levels based on Price Action and Demand & Supply which is my own Concept "PENDAM CONCEPTS"... Please don't take any trades based on this chart/post... Because this chart is for educational purpose only not for Buy or Sell Recommendation... Thank Q
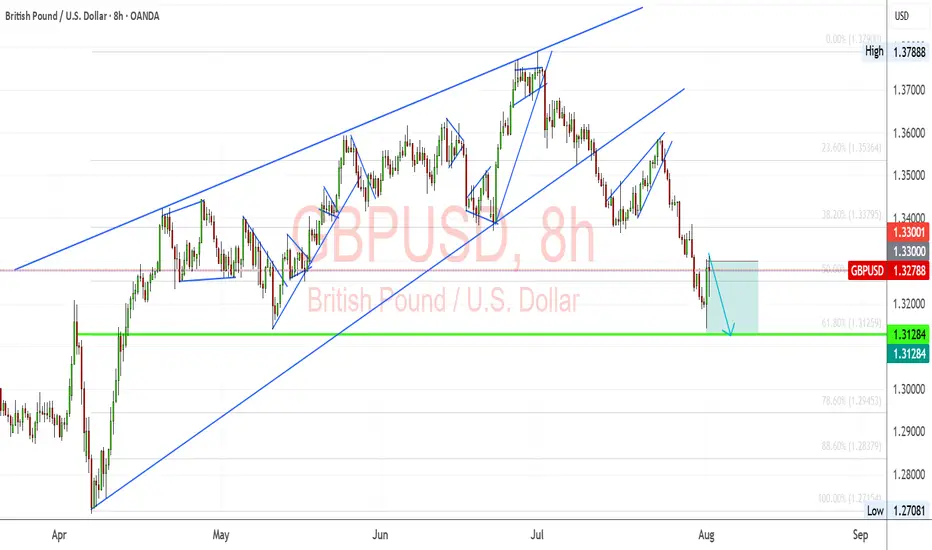
GBPUSD: Bearish Momentum vs. Fundamental Repricing – Key LevelsGBPUSD is at a critical juncture, balancing a clear technical breakdown with a fundamental backdrop favoring near-term volatility. The pair has slipped from its rising wedge structure and is now testing key retracement zones while markets reprice expectations for Fed rate cuts after weak US jobs data. Traders are closely watching whether this bearish momentum will extend toward the 1.3128 support or if a rebound from oversold conditions could trigger a corrective bounce.
Technical Analysis (8H Chart)
Pattern: Clear breakdown from a rising wedge, confirming bearish bias.
Current Level: Price sits near 1.3278, struggling to reclaim the 1.3300 resistance zone.
Key Support Zones:
1.3128 (61.8% Fibonacci retracement) – main bearish target.
1.2945 (78.6% retracement) – extended downside target if selling pressure deepens.
Resistance Levels:
1.3300 (immediate resistance, prior support now flipped).
1.3380 (secondary resistance if a retracement rally occurs).
Projection: Likely bearish continuation toward 1.3128, with a potential retest of 1.3300 before continuation.
Fundamental Analysis
Bias: Bearish in the short term, but Fed policy and risk sentiment remain key drivers.
Key Fundamentals:
USD: Weak NFP (73K), higher unemployment (4.2%), and downward revisions boost Fed cut bets (~75% for September), typically a USD-negative factor.
GBP: BOE maintains a cautious stance due to sticky inflation but lacks clear hawkish conviction as growth slows.
Tariffs: US tariffs add a mild negative weight on GBP trade sentiment.
Risks:
Hot US CPI could slow Fed cut bets, supporting USD.
Hawkish BOE comments could limit GBP downside.
Global risk sentiment shifts could either favor USD (risk-off) or weaken it further (risk-on).
Key Events:
US CPI and PPI for USD direction.
BOE policy updates and UK CPI.
US jobless claims and Fed commentary.
Leader/Lagger Dynamics
GBP/USD is a lagger, mainly reacting to USD shifts. However, its moves directly influence GBP crosses such as GBP/JPY and GBP/CHF.
Summary: Bias and Watchpoints
GBP/USD remains in a bearish phase, targeting 1.3128 with a potential corrective bounce toward 1.3300 first. The primary driver is the technical breakdown, while fundamentals add volatility around US CPI and BOE policy. If CPI surprises lower, the bearish outlook could reverse into a short-term rebound; if CPI is hot, downside momentum could extend. You should monitor USD-driven events closely as GBP/USD sets the tone for broader GBP movements.
ETHUSD - CURRENT OUTLOOK ON ETHEREUMI am currently expecting the dollar to slowly regain strength, and while this is happen, I expect institutions/large funds to begin profit taking from these price ranges.
"May fortune attend thee, and thy trade prosper." .......L2Earned

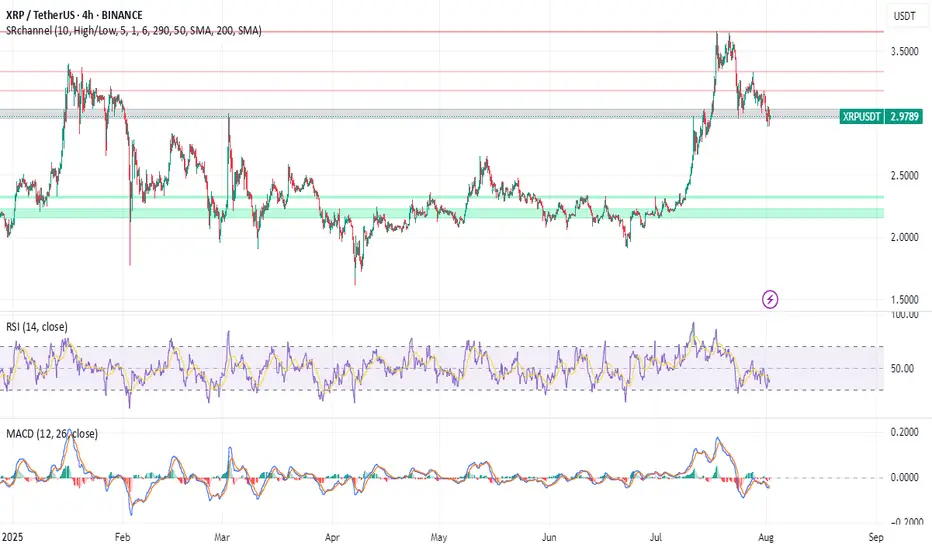
XRP Price Prediction: Is a Breakout to $15 Imminent? XRP Breakout Targets $15 — Analyst Says 'This Is Just The Start': Is XRP Set to Explode?
The cryptocurrency world is once again turning its attention to XRP, the token developed by Ripple Labs, as bullish analysts predict an imminent and explosive rally. After a strong run-up earlier in 2025, XRP has pulled back slightly and is now approaching a critical support zone. Some analysts are now calling for a $15 breakout target, even as the token hovers near $2.80, a level many see as a pivotal point for the next leg of the bull market.
Let's dive into the latest developments, technical analysis, and market sentiment surrounding XRP — and why some believe "this is just the start."
XRP Price Overview: Current Positioning
As of early August 2025, XRP is trading around the $2.85 mark, down from its recent high near $3.70. While this pullback may concern short-term traders, technical analysts argue that this retracement is healthy and necessary for the formation of a higher low, a common pattern in bullish market structures.
The key price levels to watch include a support zone between $2.80 and $2.95, resistance at $3.70, downside risk to $2.20 if $2.80 fails, and upside targets of $5 in the short term and $15 in the mid-term.
Why $2.80 Is So Important
The $2.80 support level is emerging as a make-or-break price zone. It aligns with multiple technical indicators including the 0.618 Fibonacci retracement from the previous rally, the Value Area High (VAH) from recent price accumulation zones, and Higher Time Frame (HTF) structure showing consistent support around this level in recent months.
If XRP manages to hold this level and establish a higher low, it could kick off a new bullish wave, potentially targeting $5 in the short term and beyond in the medium term.
Analysts Call for $15 XRP — Is It Possible?
Several key factors support the bull case. Institutional interest continues to grow as Ripple's partnerships with banks and financial institutions support long-term utility. Legal clarity has improved significantly after years of regulatory uncertainty, with the SEC lawsuit largely resolved, removing a major overhang. Technical indicators including bullish divergence on the RSI, MACD bullish crossover, and increasing volume all support upward momentum. Additionally, as Bitcoin stabilizes, funds are flowing into major altcoins, including XRP, as part of the typical altcoin rotation cycle.
August Rally Incoming? Bullish Divergence Signals 20% Upside
Technical analysts have identified a bullish divergence forming on the daily and 4-hour charts — a classic signal that often precedes a strong move upward. This divergence appears as the price makes lower lows while the RSI makes higher lows, suggesting momentum is shifting in favor of the bulls.
If confirmed, this divergence could catalyze a 20% rally in August, potentially pushing XRP back above $3.40 and testing the critical $3.70 resistance. A clean break above this level would likely open the floodgates for further gains.
$3.70: The Gatekeeper to Higher Highs
While there's excitement around the potential for XRP to hit $5 or even $15, the path forward must first go through $3.70. This resistance level has stalled price action multiple times in 2025 and will likely serve as a psychological and technical barrier.
Two scenarios are possible: a break above $3.70 would open the door to $5 and $7 targets quickly, while a rejection at $3.70 could lead to a pullback toward $2.20, especially if $2.80 fails.
Traders Hedge With New XRP Rival: Remittix
As XRP consolidates, some traders are diversifying their holdings into Remittix (RTX), a new cross-border payments token that promises enhanced scalability and compliance tools. RTX has gained traction recently, especially among DeFi-native traders seeking alternatives to XRP's centralized development model.
Remittix highlights include strong tokenomics with a deflationary model and staking rewards, a real-world use case targeting remittance markets in Asia and Africa, and a PayFi Wallet with beta slated for launch in Q3 2025, offering seamless integration with fiat on/off ramps.
While Remittix is gaining momentum, XRP's brand recognition, liquidity, and institutional partnerships still give it a significant edge in the payments space.
XRP Price Forecast: Short-Term and Long-Term Outlook
In the short term over the next 30 days, the bullish scenario involves holding $2.80 support, breaking $3.70, and rallying to $5. The bearish scenario would see XRP lose $2.80, drop to $2.20, and consolidate.
For the mid-term outlook in Q4 2025, if the bullish trend continues and macro conditions remain favorable, XRP could target $7 to $10 by the end of the year. In a full altseason scenario, $15 is not out of reach, according to some analysts.
Key Catalysts That Could Drive XRP Higher
Several catalysts could propel XRP higher. Institutional adoption continues to expand as Ripple's partnerships, especially in the Middle East and Asia-Pacific, lay the groundwork for long-term utility. CBDC integration presents another opportunity as Ripple works with multiple central banks on developing Central Bank Digital Currencies. Any progress here could significantly boost XRP's real-world use.
ETP listings could bring new inflows as XRP may benefit from exchange-traded products in Europe and Asia, especially if more crypto-based ETFs gain traction globally. The macro environment also favors growth, with a dovish Fed, weakening USD, and rising crypto adoption all creating a fertile environment for altcoins like XRP to thrive.
Community Sentiment: Is the XRP Army Ready?
The XRP community, also known as the XRP Army, remains one of the most passionate and active in the crypto space. Social media sentiment has turned increasingly bullish, with hashtags like #XRPToTheMoon and #XRP15 trending on X (formerly Twitter).
However, analysts caution against overexuberance, noting that market cycles can be volatile and unpredictable.
Risks to Watch
While the bullish case is compelling, it's important to consider the risks. Macro-economic shocks from a sudden shift in interest rates or recession fears could impact crypto markets broadly. Regulatory setbacks remain possible — although Ripple has gained legal clarity in the U.S., future regulations in Europe or Asia could cause volatility.
Network risks from any technical issues or security breaches could erode trust and trigger selloffs. Competition from new projects like Remittix, Stellar (XLM), and other payment-focused tokens could eat into XRP's market share.
Final Thoughts: Is XRP Set to Explode?
With XRP hovering near a critical support zone at $2.80, all eyes are on whether bulls can defend this level and push the token back into an uptrend. If successful, the next moves could be explosive, with analysts forecasting $5 in the short term and potentially $15 or higher before the end of 2025.
While risks remain, the technical setup, improving fundamentals, and renewed community optimism all point toward a bullish continuation — if key levels hold.
As always, investors should stay informed, manage risk, and avoid emotional decisions in this fast-moving market.
Summary
XRP currently trades around $2.85 with key support at $2.80 and major resistance at $3.70. Short-term targets point to $5 while mid-term projections suggest $10 to $15 is possible. Downside risk exists to $2.20 if support fails. Bullish catalysts include legal clarity, growing utility, and increasing adoption, while bearish risks encompass macro shocks, competition, and potential regulation.
Disclaimer
This article is for informational purposes only and is not financial advice. Cryptocurrency investments are highly volatile and involve significant risk. Always do your own research (DYOR) and consult with a financial advisor before making investment decisions.
BTC 108K - 112K ZONE Why 108k to 112k zone is important?
Bitcoin recently made a new all-time high and is now undergoing a healthy correction — nothing to worry about.
The $108,000 to $112,000 zone is a key support area due to three major factors:
1. Strong previous support level
2. A daily trendline aligning with this zone
3. 50% Fibonacci retracement of the recent impulse move
If this support holds, there's a strong possibility Bitcoin will form a new ATH around $130,000 to $140,000.
DON'T PANIC wait for confirmation and see the magic 🚀 🚀

GBP/USD: Post-Impulse Sell Setup from Ending DiagonalThe chart depicts a completed 5-wave impulsive structure, culminating at the top of wave (5). The internal wave structure of the final fifth wave forms a classic ending diagonal pattern, typically signaling a trend reversal or deep correction.
After this extended fifth wave, the price has started rolling over, confirming the start of a corrective decline. The wave count now expects an ABC correction targeting the previous wave 4/2 demand zone, highlighted in red.
Target 1 (T1): 1.33608
Target 2 (T2): 1.32436
Stop Loss (SL): 1.35988
Ending diagonal at the top of wave (5) signals exhaustion of bullish momentum.
Clear bearish divergence (not shown here) is commonly seen with this pattern.
The price has broken the short-term structure and is now forming lower highs.
Target zone aligns with previous wave 2 consolidation – a typical retracement zone for post-impulse corrections.

0721 Impact of Japanese Senate Elections on Yen Exchange Rate Hello traders,
1. I spent the entire weekend following the Japanese Senate elections, as they will determine the fluctuations of the world's largest financing currency—the yen exchange rate.
★ The results are out, and we are currently in scenario two— the ruling coalition suffered a crushing defeat + Shigeru Ishiba refuses to resign. However, senior figures within the Liberal Democratic Party, such as Taro Aso, have publicly stated that they intend to demand Prime Minister Ishiba's resignation for accountability, increasing the pressure on Ishiba to step down. This means we might see "scenario three"—the USD/JPY exchange rate could potentially break through the 151-155 range.
★ Is this the worst-case scenario? Of course not. The worst-case scenario would be if the "far-right party" that campaigned on the slogan "Japan First" achieved a landslide victory in this election. The most notable winner is a marginal far-right party known as the "Reform Party."
The Reform Party originated from a YouTube channel during the pandemic, which spread conspiracy theories about vaccines and "global elite conspiracies." NHK estimates that the Reform Party will win up to 22 seats, whereas three years ago, they had only 1 seat in the Senate and currently have only 3 seats in the House of Representatives.
✔ Let's take a look at this big winner's political proposals—stricter immigration restrictions + opposition to globalism + opposition to radical gender policies + reassessment of decarbonization and vaccine policies + massive tax cuts + increased social welfare spending. This means Japan may implement more "radical tax cuts" combined with aggressive economic stimulus through quantitative easing, leading to a more severe depreciation of the yen, increasing the likelihood of the USD/JPY exchange rate rising to the 160 range.
★ What are the risks of a sharp depreciation of the yen?
For Asia, the depreciation of the yen typically drags down other Asian currencies collectively, especially under U.S. tariff pressures, where Asian currencies are already under devaluation pressure. A strong depreciation of the yen would mean Japan is taking other Asian countries along with it off a cliff. We need to pay attention to the "passive" depreciation of the renminbi.
Asia will feel the pain, but Europe and the U.S. will also suffer. Theoretically, if the USD/JPY exchange rate surges (indicating a sharp depreciation of the yen), it is very advantageous for arbitrage trading with leverage (because the yen becomes cheaper). However, when the yen experiences a severe depreciation, the situation changes.
Let me give you a classic example: After Shinzo Abe returned to power at the end of 2012, he launched the "three arrows" economic policy: unlimited quantitative easing monetary policy + fiscal stimulus + structural reform = artificially lowering the yen exchange rate to stimulate exports (the clear goal was to increase the USD/JPY exchange rate) = rapid depreciation of the yen (from 80 in 2012 to 125 in 2015).
So what happened then? — A large number of Japanese institutions sold off U.S. bonds, European bonds, and REITs to cash out. The reason is simple:
✔ Japanese financial institutions (such as GPIF, insurance companies, and banks) hold a large amount of dollar/euro assets. When the yen depreciates, the yen-denominated market value of these foreign currency assets skyrockets. Selling off overseas assets is equivalent to cashing out foreign exchange gains in advance.
✔ The proportion of foreign currency assets is too high → must rebalance. Due to the yen depreciation, a large institution that originally allocated 20% of its total assets to foreign currency assets might see that proportion swell to 30% or 40%. This triggers asset allocation restrictions within pension and insurance funds (ALM principles), necessitating the sale of overseas assets and reallocation to yen-denominated assets.
✔ The yen depreciation phase is usually accompanied by an expansion of the U.S.-Japan interest rate differential. If Japanese institutions hedge their dollar assets, the hedging costs become very high (the costs of hedging through FX swaps and forwards rise), so they must also sell off some assets to reduce exposure. Therefore, in 2013, there was a collective sell-off of U.S. and European bonds.
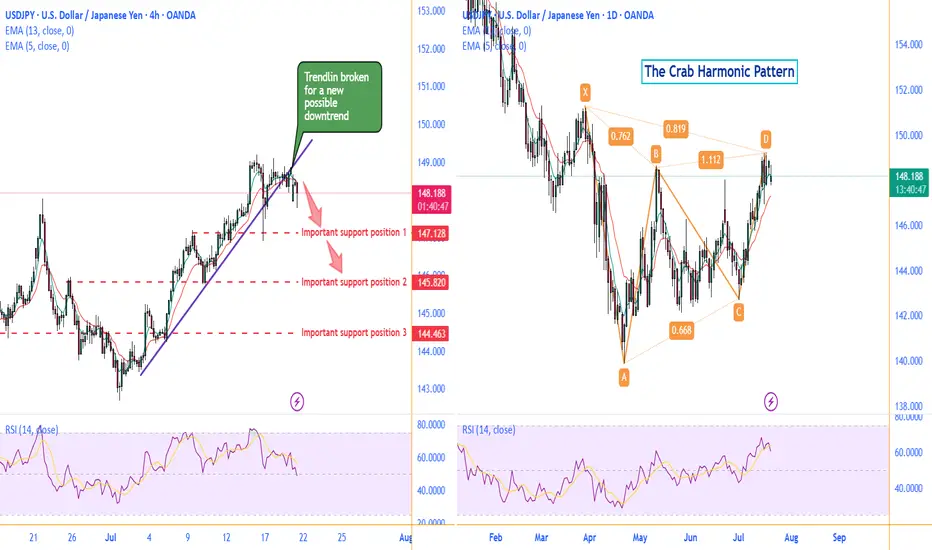
Technically:
Daily chart, there is a possible Crab Harmonic Pattern.
The Crab Harmonic Pattern
From the chart, we can see:
The upward move from A to B is labeled as 0.762, which falls within the Fibonacci ratio range of 0.618-0.786 for the A-B leg of the Crab pattern.
The downward move from B to C is labeled as 0.668, which also falls within the Fibonacci ratio range of 0.382-0.886 for the B-C leg of the Crab pattern.
The upward move from C to D is labeled as 1.112, which corresponds to the Fibonacci ratio range of 1.13-1.272 for the C-D leg of the Crab pattern.
Based on these Fibonacci ratio relationships, we can identify this price action pattern as a typical Crab harmonic pattern. This type of pattern often suggests that the price may be about to reverse.
On the left 4H chart, the broken trendline is suggesting a new possible downtrend to begin .
Make a good use of those support positions, sellers of UJ could find a great trade deal.
Follow me to get more update on UJ.
GOOD LUCK!
LESS IS MORE!
BTCUSD has boken Support and falling to 110KBTCUSD has boken Support and falling to 110K. This decline is due to General fall in equity market due to Tariff war.

ETHUSDTPossible short on ETH, as we know this might be a news dump that caused this blood in the market and might recover very soon, but we broke a key support level, this is the 4HR chart and we will have a better idea what's on the table when weekly close.

Btcusd techinical analysis.Btcusd techinical analysis next move posibale at h1 time frame not finchinal advice.

EURUSD has broken & hovering near resistance.EURUSD has broken & hovering near resistance. US dollar has started weaking again due to Tariff war.
