XAUUSD BearishGold, Price have been moving side-ways taking out internal highs & lows inside PREMIUM, now we have clean lows that are still intact with equal lows near equilibrium. I would like to see price dropping low to take out liquidity resting below those previous lows and drop into DISCOUNT.
Community ideas

Sell gbpoudA clear reversal pattern in weekly time frame we patiently wait for breakout before selling

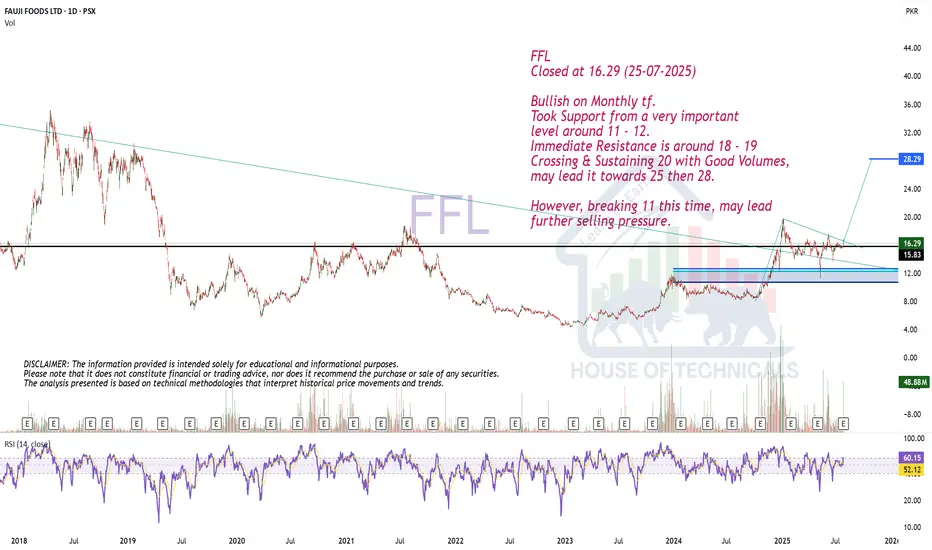
Bullish on Monthly tf.FFL
Closed at 16.29 (25-07-2025)
Bullish on Monthly tf.
Took Support from a very important
level around 11 - 12.
Immediate Resistance is around 18 - 19
Crossing & Sustaining 20 with Good Volumes,
may lead it towards 25 then 28.
However, breaking 11 this time, may lead
further selling pressure.
Why Your Chart Might Be Lying to You And (How to Fix It) !Hello Traders 🐺
Ever clicked the “Log” button on your chart and suddenly everything looked different?
Yeah, you’re not alone...
Most traders ignore it.
But understanding the difference between a Linear and Logarithmic chart can literally change how you see price action — especially if you’re into long-term moves or trading volatile markets like crypto.
Let’s break it down real simple 👇
🔹 Linear Chart (a.k.a. the default)
This is what most charts use by default.
It measures price change in absolute terms.
Meaning: the distance from $10 to $20 is exactly the same as from $20 to $30 — because in both cases, price moved $10.
🧠 Sounds fair, right?
Not always. Here's why...
Let’s say a stock goes from $1 to $2 — that’s a 100% gain.
But if it goes from $100 to $101 — that’s just 1%.
✅ Linear Chart – Pros
Simple and easy to read
Good for short-term price action
Better for assets with small price ranges
Familiar to most beginners
❌ Linear Chart – Cons
Misleading in long-term charts
Distorts large percentage moves
Trendlines become unreliable over time
Doesn’t reflect real growth in % terms
🔹 Logarithmic Chart (Log Scale)
This one shows percentage-based price movement.
Now, going from $10 to $20 (100% gain)
and going from $100 to $200 (also 100% gain)
look exactly the same on the chart — which actually makes more sense when analyzing growth.
It’s super useful when:
✅ You’re analyzing big moves over time
✅ You want to draw accurate trendlines in long-term charts
✅ You're dealing with assets that grew 5x, 10x or more
✅ You care about % gains instead of raw price
❌ Log Chart – Cons
Less intuitive for beginners
Not useful for low-volatility assets
Small price moves may look insignificant
here is an example of the same chart but in the Log Scale :
As you can see on the chart above there is huge difference in accuracy when you use Log scale
for the high volatile asset such as BTC specially in the long term movements .
🆚 So, When Should You Use Each One?
Situation Use Linear Use Log
Small price changes ✅ ❌
Day trading / scalping ✅ ❌
Long-term analysis ❌ ✅
Parabolic or exponential moves ❌ ✅
Drawing long trendlines ❌ ✅
Final Thoughts
If your chart looks weird when you zoom out…
If your trendlines don’t quite fit anymore…
Or if you’re analyzing something that went 10x…
🔁 Try switching to Log scale — it might just clean up the noise.
Small toggle. Big difference.
And also remember our golden rule :
🐺 Discipline is rarely enjoyable , but almost always profitable. 🐺
🐺 KIU_COIN 🐺

ACET | BUSDTOP <-> DOWN BREAKDOWN ANLAYSIS
- HTF (Higher time frame) price retested the sweap and rejected on the first break making it as a failed aution (trapping more buyers on top before the price actually break those highs),
- After the sweap we got a retest of the Orderblock +, region which acted as a support for price to regain momentum and pump,
- Type 2 recovery in play after the first structure break trapped buyers, the secound leg would actually anticipate the move up and take Relative highs ($) resting @ 0.08637 sweaping all the liquidity trapped within the range,
SETUP :
- Looking for Limit orders fills @ 0.07060ish region that created the Volume gap making it as our entry region,
- Eyes on a tap of Prl (Prev range lows) resting @ 0.12749 that did act as first take profit region ,
- Once we break Prl (Prev range lows) price can retest all the highs resting above brewing a chad candle for next few months.

XRP prediction🔍 XRP/USDT Weekly Analysis
📊 Technical Overview:
• XRP recently broke out of a long-term descending trendline with strong bullish momentum.
• Key support zone now rests around $2.09 – previous resistance turned support.
• Price is currently consolidating around $3.18 after a strong impulse move.
🎯 Targets:
• First target:
🔸 $4.00 expected around November 2025
• Second target:
🔸 $4.80 expected around March 2026
These targets align with Fibonacci arc projections and historical resistance levels.
📈 Trend Strength:
• Breakout backed by strong volume suggests momentum is sustainable.
• If price holds above $2.94, bullish continuation is likely.
⚠️ Risk Levels:
• Losing support at $2.09 could invalidate the bullish setup and push price back to the lower range.

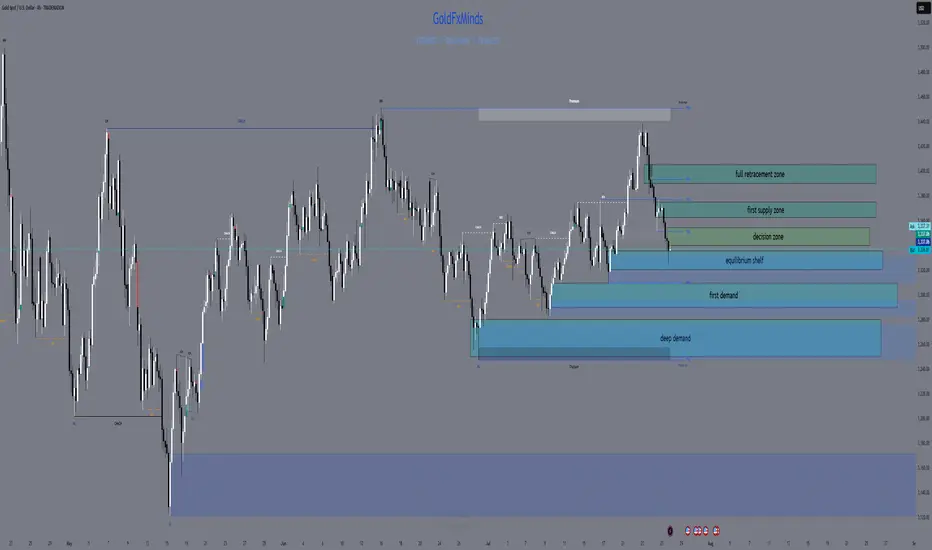
XAUUSD H4 Outlook – “Fed Week: Only the Real Zones”Hello, gold traders!
FOMC week is here, the dollar’s flexing, and gold is stuck under a fortress of supply. No fantasy, no overlaps, just your real, actionable H4 map—zones spaced, logic tight, and all fluff deleted.
⬜Bias:
Neutral to bearish while price is capped under 3,355 and the EMA cluster.
Only flip bullish if price closes and holds above 3,375 with strong confirmation after news.
Current Price: 3,336.81
Summary for your audience:
Neutral–bearish: All the EMAs (21/50/100/200) are overhead, and the primary supply and decision zones are blocking any upside.
No reason to flip bullish unless gold breaks out and holds above both the decision zone and the full supply ceiling after major news.
All bounces into supply are likely to get faded, unless the structure changes dramatically post-FOMC.
🟥 ULTRA SUPPLY ZONE: 3,390 – 3,405
127–161.8% Fib extension—liquidity grab and stop-hunt target for news-driven spikes
Only short if you see a monster upper wick and hard rejection
🟥 PRIMARY SUPPLY: 3,365 – 3,375
All EMAs (21/50/100/200) are stacked overhead; unfilled FVG at 3,370–3,375
Short on a clear rally rejection or bearish engulfing candle—this is where most breakouts get trapped
🔶 DECISION ZONE: 3,340 – 3,355
EMA100/200 straddle this level; small FVG at 3,350–3,352
Market “decides” here—fade unless price closes decisively above 3,355
🔵 EQUILIBRIUM SHELF: 3,320 – 3,335
50% Fib at 3,327; filled FVG at 3,325–3,330; SMA50 just below
Bounce/fake-break zone—wait for a clean H4 reversal, not a guess
🟢 FIRST DEMAND BASE: 3,290 – 3,310
H4 Order Block, hidden FVG (3,300–3,305), Fib 38.2% around 3,295
Longs only with strong pin-bar/engulf and quick EMA50 reclaim
🔵 DEEP PULLBACK BAY: 3,250 – 3,280
Weekly EMA21 and 61.8% Fib (~3,260), strong volume
Only consider a long on a panic flush and a powerful reversal wick
⚡️ MACRO CONTEXT
USD: On fire into ADP and FOMC; gold moves will be explosive, not logical
Events:
Tue: ADP
Wed: FOMC + Powell
Thu: Core PCE
Fri: NFP, ISM
Bias: Neutral-bearish under 3,355; only bullish if we close and hold above 3,375
EMAs: Clustered tightly overhead—bulls get no respect until this ceiling is crushed
🎯 TRADE LOGIC
Shorts:
3,390–3,405 (big wicks and clear rejection only)
3,365–3,375 (news spike or failed breakout with bearish candle)
Longs:
3,340–3,355 (only on a confirmed close above)
3,320–3,335 (strong reversal only—don’t front run)
3,290–3,310 (classic H4 pin-bar/engulf + EMA50 reclaim)
3,250–3,280 (deep panic flush and major reversal only)
NO TRADE: In the gaps—let the gamblers get chewed up, not you.
💬 Which zone will you snipe? Drop a comment and show you’re here for structure, not noise!
👍 Like & Follow for high-value, real-time sniper maps every day.
Disclosure: Chart via Trade Nation’s TradingView feed. Influencer Program participant.
GoldFxMinds 💛
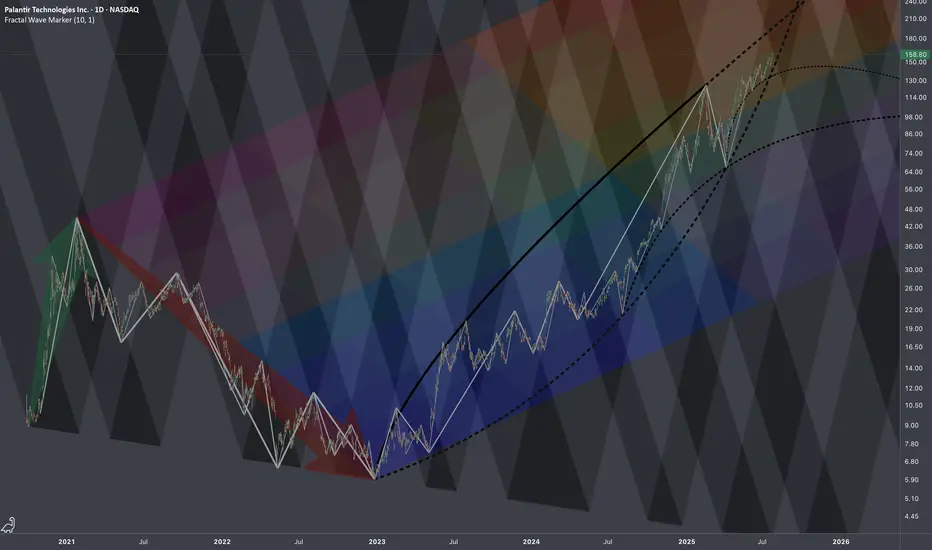
$PLTR: Regressive Heatmap🏛️ Research Notes
Technically this looks overbought, but fundamentally we know that under current administration this company is clear beneficiary (new contracts). Seems to explain why chart's dips were bought off extending bullish phases of cycle. However, there is still always a limit (as price keeps moving up, it alters the chances and magnitude of counter-move). Therefore, I'll test how wide range of 2021-2022yrs drop (prev cycle) can define the bullrun of current cycle. I'd say the very fact of anchoring the structure to actual chart points inherits its texture in next series of fractal based fib ratios.
All observed key coordinates build up into the following cross-cycle interconnections:
Bitcoin Next Leg Incoming? Targets $134K from Bullish WedgeBTCUSDT is consolidating within a descending wedge right above a critical demand zone, following a impulsive breakout from its prior range structure. This current setup suggests another potential bullish continuation, especially as price continues to respect both the wedge support and internal demand.
With the higher timeframe structure favoring bulls and previous demand zones holding firm, the projected breakout targets align with $123,218 and $134,446 respectively.
A clean invalidation would only be confirmed on a sustained break below the wedge and loss of the strong support area near $110K.
All eyes on the wedge apex as BTC prepares for its next major leg.

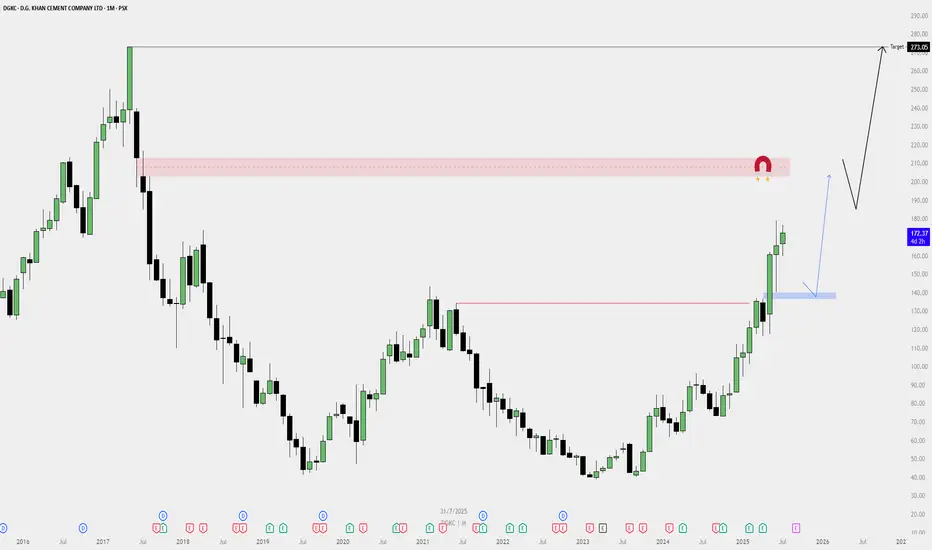
DGKC Monthly Buy Plan — Bullish Outlook📈 DGKC Monthly Buy Plan — Bullish Outlook
✅ Bias: Strongly Bullish
Price has broken major resistance levels with high momentum, forming a big bull trend on the monthly timeframe.
🔍 Key Observations:
Break of Structure:
Price broke past a major resistance zone (previous high).
Strong monthly green candles show institutional interest.
Demand Zone (Blue Box):
A fresh demand zone is formed — a possible area for pullback re-entry.
If price retests this zone, it may offer a high-probability long setup.
Liquidity Magnet Zone (Red Box):
A clear monthly imbalance / supply zone around the 210–220 range.
Could act as a temporary resistance before continuation.
Final Target:
Monthly inefficiency / liquidity target at 273.05, likely the final destination of the move.
Market structure suggests this level can be reached before any major reversal.
🔄 Plan Execution:
🔵 Scenario 1 (Pullback Entry):
Wait for a pullback to the blue demand zone.
Look for lower timeframe confirmation to enter long.
🔵 Scenario 2 (Momentum Continuation):
If price continues without deep pullback, consider smaller timeframes for continuation setups.
Do not chase price; wait for valid structure.
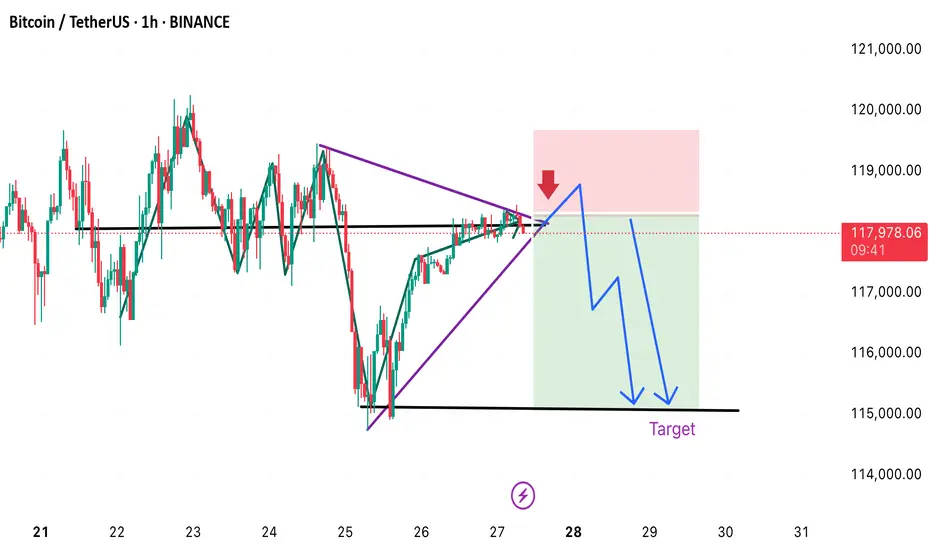
BTC 1H CHART LOOK OUTBitcoin breaks down from the triangle, the expected move is downward toward the $115,000 target. The trade setup reflects a short position, with risk clearly defined by the red stop-loss zone above ~$118,800.
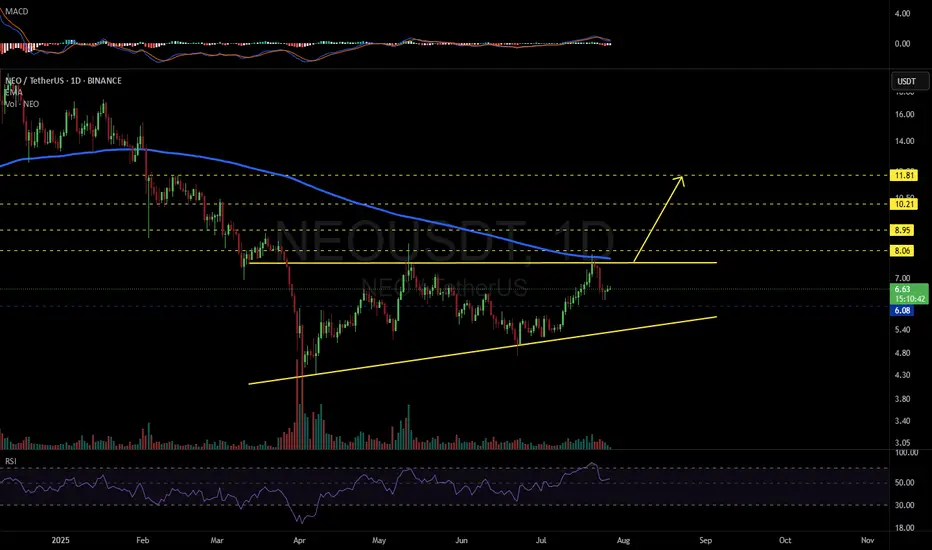
NEOUSDT 1D#NEO is moving inside an ascending triangle on the daily chart. Consider buying at the current price and near the support level at $6.08.
In case of a breakout above the triangle resistance and the daily EMA200, the targets are:
🎯 $8.06
🎯 $8.95
🎯 $10.21
🎯 $11.81
⚠️ As always, use a tight stop-loss and apply proper risk management.

USDJPY Will Fall! Short!
Take a look at our analysis for USDJPY.
Time Frame: 1D
Current Trend: Bearish
Sentiment: Overbought (based on 7-period RSI)
Forecast: Bearish
The price is testing a key resistance 147.661.
Taking into consideration the current market trend & overbought RSI, chances will be high to see a bearish movement to the downside at least to 145.139 level.
P.S
The term oversold refers to a condition where an asset has traded lower in price and has the potential for a price bounce.
Overbought refers to market scenarios where the instrument is traded considerably higher than its fair value. Overvaluation is caused by market sentiments when there is positive news.
Disclosure: I am part of Trade Nation's Influencer program and receive a monthly fee for using their TradingView charts in my analysis.
Like and subscribe and comment my ideas if you enjoy them!
