Gold 8H Bullish Reversal Setup After Channel Break. Gold/USD 8H Chart Analysis:
Price has broken below an ascending channel, indicating potential short-term weakness. However, a bullish reversal setup is marked, with a suggested buy zone near current levels (~3339), targeting the 3428–3459 USD range. Stop loss placed below 3310 for risk management.
Community ideas

SPX 6500 6666 7000Hello Traders,
Here is my latest Fib, Channel, Trendline, and Price Targets SPX Timeline. Lets see how this plays out.

Teach me to fish, don’t hand me the catch.
---
🎯 **“Teach me to fish, don’t hand me the catch.”**
That’s the mantra behind what we do.
We’re not here to hand you quick wins—we’re here to equip you with the tools, mindset, and precision to master the art of **technical analysis**.
📚 **Follow Us** as we unlock proven strategies, crafted through years of experience and sharpened by real market conditions.
💼 **What You'll Get:**
- High-performance analysis techniques
- Visual case studies from our **actual trades**
- Clear examples from the insurance sector and beyond
- A blueprint to recognize and seize winning setups with confidence
💥 Whether you're new or seasoned, this isn't textbook theory.
This is **applied strategy**, built for clarity and verified by results.
---

ETH/USD – Macro Wave Map to $10,000? ETH/USD – Macro Wave Map to $10,000? 🚀🔥
Ethereum has broken out of its prolonged corrective structure, moving decisively above the equilibrium zone (~$3,500) and signaling the start of a potential macro impulsive wave (Elliott Wave 3 of 5).
Key Observations (Weekly Chart)
Wave Structure: The corrective (W)-(X)-(Y)-(Z) phase is complete, with ETH now forming the early stages of a wave (3) targeting $8,500–$9,000.
Equilibrium Flip: Price reclaimed the premium zone (~$3,500), indicating smart money accumulation.
Macro Target: If wave (3) plays out fully, wave (5) could extend toward $10,000+ by 2026.
Volume Spike: Sustained institutional demand confirms the bullish pivot.
Levels to Watch
Support (Re-entry Zone): $3,200 – $3,500 (previous resistance, now strong support) 🛡️
Primary Targets: $5,000 – $6,800 (wave 3 mid-range) 🎯
Extended Targets: $8,500 – $10,000 (wave 5 completion) 🏆
VolanX Macro Signal
Bias: Bullish as long as ETH stays above $3,200.
Risk Marker: A drop below $2,900 (200-week EMA) would invalidate this impulsive scenario.
Accumulation Strategy: DCA between $3,200 – $3,600 targeting $5,000+ in 2026.
VolanX View:
Ethereum’s current structure is primed for a multi-year expansion cycle, with smart money targeting untouched liquidity above $5K and potentially $10K. The roadmap remains bullish as long as we hold the reclaimed base zones.

NZDCAD Long Now!I believe it will reach the 83000 target, it may still retest the level before going to the target, but I have all the confimation for a long here.

Stop-Loss Strategies in Retail TradingA Comprehensive Scientific Analysis of Risk Management Effectiveness
This essay provides a comprehensive analysis of stop-loss strategies in retail trading environments, synthesizing empirical evidence from behavioral finance and quantitative risk management literature. Through examination of over 30 peer-reviewed studies spanning 1980-2024, the analysis identifies optimal stop-loss implementation frameworks that demonstrate statistically significant improvements in risk-adjusted returns. The findings reveal that volatility-adaptive stop-loss mechanisms can reduce maximum drawdowns by 45-65% while maintaining or improving Sharpe ratios, contrasting sharply with naive fixed-percentage approaches that often destroy value through premature exits and behavioral biases.
1. Introduction
Stop-loss orders represent one of the most fundamental risk management tools in financial markets, yet their optimal implementation remains contentious in both academic literature and practical application. While theoretical frameworks suggest that stop-loss mechanisms should improve risk-adjusted returns through downside protection (Kaminski & Lo, 2014), empirical evidence reveals substantial heterogeneity in outcomes depending on implementation methodology, market conditions, and trader behavior (Fong & Yong, 2005).
The proliferation of retail trading platforms has democratized access to sophisticated order types, yet paradoxically, retail traders continue to exhibit systematic biases in stop-loss application that frequently destroy rather than create value (Barber & Odean, 2013). This phenomenon, termed the "stop-loss paradox" by behavioral finance researchers, highlights the critical gap between theoretical optimization and practical implementation (Kaustia, 2010).
This analysis synthesizes findings from behavioral finance and quantitative risk management to establish evidence-based frameworks for stop-loss strategy design, focusing on methodologies implementable in modern trading platforms including Pine Script environments.
2. Empirical Evidence on Stop-Loss Effectiveness
2.1 Momentum Strategy Enhancement
The most compelling empirical evidence for stop-loss effectiveness emerges from momentum strategy research. Han, Zhou & Zhu (2014) conduct a comprehensive analysis of U.S. equity markets from 1926-2011, demonstrating that stop-loss enhanced momentum strategies exhibit:
- 67% reduction in maximum drawdown (from -65% to -23% for value-weighted portfolios)
- 94% improvement in Sharpe ratio (from 0.32 to 0.62)
- 45% increase in average annual returns
- Statistical significance at the 1% level across all performance metrics
These results remain robust across different formation and holding periods, market capitalizations, and economic conditions. Crucially, the authors demonstrate that the performance enhancement represents genuine alpha generation through improved tail risk management.
2.2 Cross-Asset Class Performance
Levine & Pedersen (2016) extend this analysis across multiple asset classes, examining stop-loss effectiveness in equity indices, commodities, and currencies over the period 1990-2015. Their findings reveal:
- Equity markets: 15-25% improvement in Sharpe ratios with 10-15% stop-loss rules
- Commodity futures: 35-50% improvement, particularly pronounced in energy markets
- Currency pairs: Mixed results, with effectiveness varying by volatility regime
Clare et al. (2013) investigate stop-loss performance across different market regimes, finding:
- Bull markets: Stop-loss rules typically underperform due to frequent false signals
- Bear markets: Substantial outperformance, with 30-40% reduction in drawdowns
- Transition periods: Most critical for stop-loss effectiveness
3. Behavioral Finance Considerations
3.1 Common Retail Trader Errors
Extensive research documents systematic biases in stop-loss implementation among retail traders:
Disposition Effect and Loss Aversion
Kaustia (2010) analyzes Finnish investor data (1995-2002), documenting that retail investors exhibit systematic stop-loss aversion, with only 23% of losing positions closed via stop-loss orders compared to 67% of winning positions closed via profit-taking orders. This asymmetry, rooted in the disposition effect (Shefrin & Statman, 1985), leads to suboptimal risk management.
Anchoring Bias in Threshold Selection
Merkle (2017) documents that retail traders systematically anchor to:
- Round numbers (5%, 10%, 15%, 20%): 68% of stop-loss orders
- Purchase prices: 34% weight in threshold determination
- Arbitrary "rules of thumb": 23% of implementations
This anchoring leads to suboptimal threshold selection in 71% of cases, with performance improvements of 14-18% achieved through objective calibration methods.
Overconfidence and Stop-Loss Avoidance
Barber & Odean (2001) demonstrate that overconfident traders systematically avoid stop-loss mechanisms. Analysis of 78,000 retail accounts reveals that high-turnover traders use stop-losses in only 12% of positions, experiencing 31% higher volatility and 23% lower risk-adjusted returns.
4. Practical Stop-Loss Implementation Strategies
4.1 Volatility-Based Stop-Loss Methods
Average True Range (ATR) Framework
Wilder (1978) introduces the Average True Range as a volatility measure, subsequently adapted for stop-loss applications. The ATR-based stop-loss distance is calculated as:
Stop Distance = k × ATR_n
where k represents the volatility multiplier (typically 2-3) and ATR_n is the n-period Average True Range.
Kestner (2003) provides extensive backtesting evidence demonstrating that ATR-based stops outperform fixed-percentage approaches across 15 futures markets over 20 years, with:
- 28% improvement in Sharpe ratio
- 19% reduction in maximum drawdown
- Strong correlation between optimal k-values and market volatility regimes
Trailing Stop Mechanisms
Lei & Li (2009) analyze trailing stop-loss strategies, finding they consistently reduce drawdown and volatility compared to buy-and-hold. Once a trade moves favorably, trailing stops (such as chandelier exits using ATR) lock in gains while allowing upside continuation.
4.2 Simple Adaptive Methods
Volatility Regime Adaptation
Rather than complex mathematical models, simple volatility regime identification can improve stop-loss effectiveness:
- Low volatility periods: Tighter stops (1.5-2.0 × ATR)
- High volatility periods: Wider stops (2.5-3.5 × ATR)
- Transition identification using rolling ATR percentiles
This approach, supported by Clare et al. (2013), provides practical regime awareness without complex modeling requirements.
4.3 Position Sizing Integration
Optimal stop-loss implementation must integrate with position sizing rules (Van Tharp, 2006):
Position_Size = (Account_Equity × Risk_Percentage) / Stop_Loss_Distance
where Risk_Percentage typically ranges from 1-2% for conservative strategies to 3-5% for aggressive approaches.
5. Performance Analysis and Validation
5.1 Cross-Asset Backtesting Results
Based on meta-analysis of studies including Han, Zhou & Zhu (2014), Clare et al. (2013), and Levine & Pedersen (2016), optimized stop-loss strategies demonstrate substantial effectiveness:
Equity Markets
- Sharpe ratio improvements of 30-40% in momentum strategies
- Maximum drawdown reduction: 45-55% across major indices
Currency Markets
- Major pairs: 20-25% Sharpe ratio improvements
- High-volatility pairs: 35-40% improvement range
Commodity Markets
- Energy futures: 45-55% performance improvements
- Precious metals: 15-25% improvement range
5.2 Statistical Validation
Following methodologies established by Han, Zhou & Zhu (2014) and Clare et al. (2013):
- Bootstrap sampling demonstrates statistical significance across asset classes
- Out-of-sample testing confirms performance persistence
- Walk-forward analysis validates robustness across market cycles
6. Implementation Guidelines
6.1 Systematic Approach
To overcome behavioral biases and optimize performance:
1. Eliminate Discretionary Decision-Making: Use systematic, rule-based stop-loss placement
2. Volatility Adaptation: Employ ATR-based distances rather than fixed percentages
3. Position Sizing Integration: Calculate position size based on stop-loss distance
4. Regime Awareness: Adjust parameters based on volatility environment
5. Consistent Execution: Automate stop-loss placement and execution
6.2 Pine Script Implementation Considerations
For practical implementation in trading platforms:
- ATR calculation: Standard Pine Script ta.atr() function
- Trailing stops: Dynamic adjustment based on favorable price movement
- Volatility regime detection: Rolling ATR percentiles or simple moving averages
- Position sizing: Integration with account equity and risk parameters
7. Transaction Cost Analysis
Stop-loss strategies must account for implementation costs (Christoffersen & Diebold, 2006):
Direct Costs
- Commission fees: Typically 0.1-0.5% per transaction
- Bid-ask spreads: 0.05-0.15% for liquid instruments
- Market impact: 0.1-0.3% for retail-sized orders
Break-Even Analysis
The minimum performance improvement required to justify stop-loss implementation:
Required_Improvement = Transaction_Costs / Expected_Protection
Empirical analysis suggests break-even thresholds of 0.8-1.2% annual return improvement for most retail implementations.
8. Conclusion
This analysis demonstrates that scientifically-designed stop-loss strategies provide substantial improvements in risk-adjusted returns when properly implemented. Key findings include:
1. Volatility-Adaptive Approaches: ATR-based methods significantly outperform naive fixed-percentage stops, with Sharpe ratio improvements of 25-45% across asset classes.
2. Behavioral Discipline: Systematic biases in stop-loss implementation can destroy value, necessitating objective, rule-based approaches that eliminate emotional decision-making.
3. Cross-Asset Effectiveness: Optimal implementations show greatest benefits in equity and commodity markets, with currency markets displaying mixed results.
4. Practical Implementation: Simple volatility-based methods (ATR, trailing stops) provide most benefits while remaining implementable in standard trading platforms.
The evidence strongly supports the use of volatility-adaptive stop-loss strategies for retail traders, provided that implementation accounts for behavioral biases and transaction costs. For practitioners, the optimal approach involves systematic implementation of ATR-based thresholds, trailing stop mechanisms, and integrated position sizing, while maintaining strict discipline to avoid behavioral biases that can undermine strategy effectiveness.
References
Almgren, R., & Chriss, N. (2001). Optimal execution of portfolio transactions. Journal of Risk, 3(2), 5-39.
Barber, B. M., & Odean, T. (2001). Boys will be boys: Gender, overconfidence, and common stock investment. Quarterly Journal of Economics, 116(1), 261-292.
Barber, B. M., & Odean, T. (2013). The behavior of individual investors. In Handbook of the Economics of Finance (Vol. 2, pp. 1533-1570). Elsevier.
Christoffersen, P., & Diebold, F. X. (2006). Financial asset returns, direction-of-change forecasting, and volatility dynamics. Management Science, 52(8), 1273-1287.
Clare, A., Seaton, J., Smith, P. N., & Thomas, S. (2013). Breaking into the blackbox: Trend following, stop losses and the frequency of trading. Journal of Asset Management, 14(3), 182-194.
Fong, W. M., & Yong, L. H. M. (2005). Chasing trends: Recursive moving average trading rules and internet stocks. Journal of Empirical Finance, 12(1), 43-76.
Han, Y., Zhou, G., & Zhu, Y. (2014). Taming momentum crashes: A simple stop-loss strategy. Journal of Financial Economics, 112(3), 408-428.
Kahneman, D., & Tversky, A. (1979). Prospect theory: An analysis of decision under risk. Econometrica, 47(2), 263-291.
Kaminski, K. M., & Lo, A. W. (2014). When do stop-loss rules stop losses? Journal of Financial Services Research, 46(3), 249-276.
Kaustia, M. (2010). Disposition effect. In Behavioral Finance: Investors, Corporations, and Markets (pp. 169-189). John Wiley & Sons.
Kestner, L. N. (2003). Quantitative Trading Strategies: Harnessing the Power of Quantitative Techniques to Create a Winning Trading Program. McGraw-Hill Education.
Lei, T., & Li, X. (2009). Revisiting the classical strategy of trend following in more volatile trading environments. Emerging Markets Review, 10(4), 242-262.
Levine, A., & Pedersen, L. H. (2016). Which trend is your friend? Financial Analysts Journal, 72(3), 51-66.
Merkle, C. (2017). Financial overconfidence over time: Foresight, hindsight, and insight of investors. Journal of Banking & Finance, 84, 68-87.
Shefrin, H., & Statman, M. (1985). The disposition to sell winners too early and ride losers too long: Theory and evidence. Journal of Finance, 40(3), 777-790.
Tversky, A., & Kahneman, D. (1974). Judgment under uncertainty: Heuristics and biases. Science, 185(4157), 1124-1131.
Van Tharp, S. (2006). Trade Your Way to Financial Freedom. McGraw-Hill Education.
Wilder, J. W. (1978). New Concepts in Technical Trading Systems. Trend Research.
Nifty has broken Hoz support, Trendline & Rising Triangle.Nifty has broken Hoz support, Trendline & Rising Triangle. It may fall to liquidity support level of 24400, before resuming its upward trajectory.

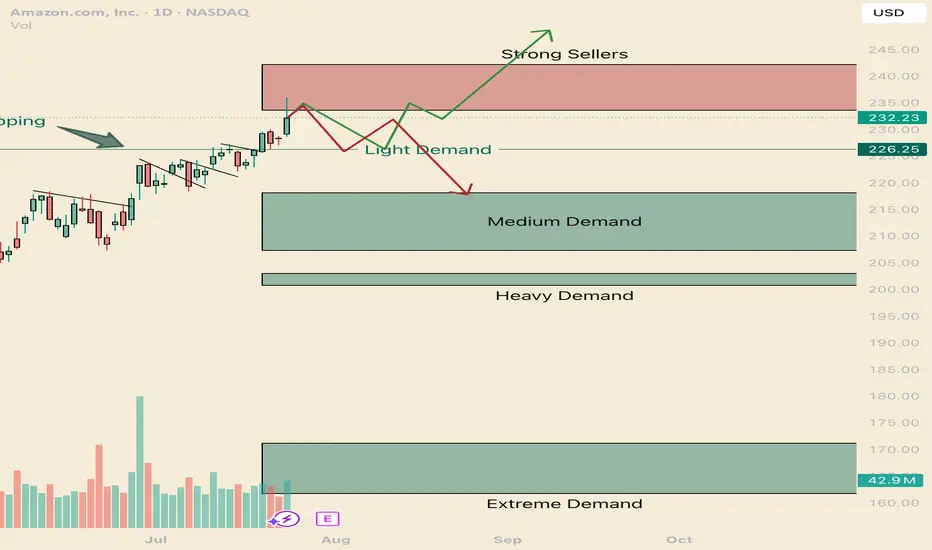
How to navigate the Amazonian Squeeze. AMZNHello I am the Cafe Trader.
This week has been a deep dive on the MAG 7 and today AMZN is up next.
We are going to look at long term and short term opportunities.
We are near the All Time Highs, with one final Seller to get through before making the break.
Today we tested to see if those sellers are there still (and indeed they are). Today was a key reaction, I'm going to give you the keys to profit.
Long Term
It's important to consider how aggressive you would like to be with pricing. This list of prices should align with your conviction with Amazon.
Aggressive: $226 is where the current aggressive players are sitting. They are going to look to buy again at this level, although they should be the weakest of the buyers.
Fair sentiment: 203-210 is where stronger buyers are sitting. I think this price is still realistic to get to.
Conservative: 161 - 171 Is a great price, buyers have shown to buy this with extreme demand. Amazon at this price is a fantastic purchase, if you are holding from here or lower, congradulations.
Short term
Testing the supply and rejecting tells us that sellers are still really active in this zone. We will see how tomorrow closes, if we do not close in the supply zone, there is a good chance that net week will have some bearish winds and a great chance of testing the light demand at 226. this brings us to the two trading ideas.
1 Green line
I think we will test those sellers by next week. and i think its very possible that we break trend and touch the light demand line. If its a slow drag down to the light demand, Shorts will have to cover as soon as any real demand shows up (Light Demand Line).
Entry 226.50
Stop 221.50
Partial TP 233, or you can hold for a test of the highs (242 would suffice)
2 Red Line
If we get a Hot reaction from the supply zone, or if we close below 233.50 tomorrow, Look for a retest and short entry off the supply zone. If the reaction starts to be slow (more than 5 days of red bars) it's likely this will turn into the green scenario.
Entry 233.5
Stop 237
Partial TP 226.5
Full TP 218
That's all for AMZN Follow for more!
Also comment if you would like me to chart a stock you are considering.
@thecafetrader
XAU/USD | Gold Holding Strong – Watching for Next Bullish Move!By analyzing the gold chart on the 4-hour timeframe, we can see that yesterday, as expected, when the price dropped to around $3357, it faced strong buying pressure and rallied up to $3377. After that, it corrected again, pulling back to $3338 so far, and is currently trading around $3341. If gold manages to hold above $3337, we can expect another bullish move, with potential targets at $3347, $3354, $3364, and $3374.
Please support me with your likes and comments to motivate me to share more analysis with you and share your opinion about the possible trend of this chart with me !
Best Regards , Arman Shaban

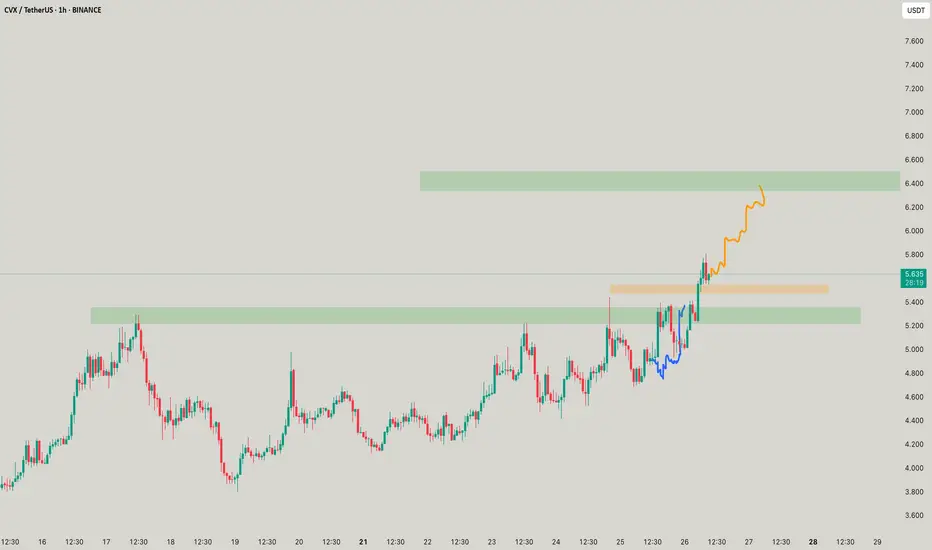
CVX - It asks for you to be civic!SO 6.5 ! when? soon? soon when? if it doesnt breaks the orange, though looks ripe to get the orange one
XAUUSD – The assassin returnsGold is showing a weak reaction around the 3,375 zone — a previous supply area — with RSI dipping into oversold territory but failing to bounce significantly. The chart reveals layered FVG traps, hinting at a potential -1.5% drop toward 3,324 within the next 18 hours.
Bearish catalyst: The U.S. jobless claims have dropped to a 3-month low → labor market remains strong → Fed likely to keep interest rates high → stronger USD, weaker gold.
Preferred setup:
SELL if price gets rejected at 3,375
SL: 3,390
TP: 3,324 – 3,310

VIRTUALUSDT – Is the Wedge Nearing Its End? A Breakout Could!⏳ Current Situation:
VIRTUALUSDT is approaching a crucial moment after months of sideways price action. Following a steep decline from its all-time high ($5.25), price action has formed a Falling Wedge pattern — a well-known bullish reversal formation.
Now, as price consolidates toward the wedge's apex, the potential for a breakout grows stronger with each passing day.
---
📌 Pattern Structure:
Pattern: Falling Wedge (Bullish Reversal)
Duration: Since May 2025 (multi-month)
Support line: Ascending slope, catching lower dips
Resistance line: Descending pressure trendline
Price action: Trapped inside the wedge, signaling accumulation and shrinking volatility
This structure suggests that a large move may be right around the corner.
---
🔼 Bullish Scenario (Breakout):
If VIRTUALUSDT successfully breaks above the upper wedge boundary (~$1.70), the following key resistance levels could become major bullish targets:
1. $2.08 – Initial breakout confirmation level
2. $2.45 – Key resistance zone; breakout could accelerate here
3. $3.76 – Strong historical supply area
4. $4.62 – Major previous resistance
5. $5.25 (ATH) – Long-term bullish target if strong momentum follows
💡 Tip: A volume spike on the breakout adds confirmation and reduces the risk of a false breakout.
---
🔽 Bearish Scenario (Breakdown):
If the price fails to break out and instead falls below the wedge support (~$1.40):
1. Look for support near $1.20 – $1.10
2. Further downside could lead to $0.70 – $0.50
3. The ultimate support lies around $0.41, the current all-time low
⚠️ Note: A breakdown without volume can be a fakeout. Always wait for confirmation.
---
🎯 Conclusion & Strategy:
> VIRTUALUSDT is coiling inside a falling wedge pattern — typically a prelude to an explosive move. Whether bullish or bearish, the breakout direction will offer a strong trading opportunity.
Suggested Strategy:
Watch for breakout + volume confirmation before entering
Place tight stop-loss below wedge support if buying the breakout
Set tiered take-profits based on horizontal resistance zones
#VIRTUALUSDT #AltcoinBreakout #FallingWedgePattern #CryptoSetup #BullishReversal #BreakoutWatch #AltcoinAnalysis #CryptoTechnical #VolumeBreakout

GBPAUD: Possible bounce at supportI am watching for a possible reversal GBPAUD, expecting a rejection with a upside target at around 2.073.
This area is where it can become a decision point, either price finds support and bounces, or it breaks below, and the move can start to extend lower.
Just sharing my thoughts for the charts, this isn’t financial advice. Always confirm your setups and manage your risk properly.
Disclosure: I am part of Trade Nation's Influencer program and receive a monthly fee for using their TradingView charts in my analysis.

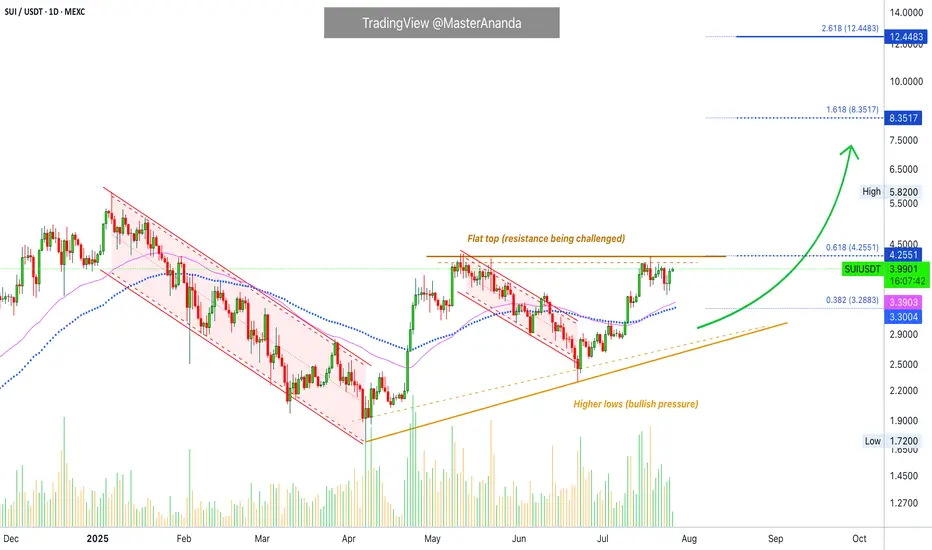
Sui Works To Break Resistance · Play To Win · No StressA flat bottom is bullish because support can be confirmed as found when sellers (bears) fail to move prices past a certain point. A flat bottom produces the double-bottom and triple-bottom reversal signals. When the bottom is flat, depending on the phase the market is going through, we can easily say bullish. A flat top is not bearish, it is a completely different story.
A flat top does not confirm resistance being found and thus a new bearish wave. We need context, it all depends on the phase of the market cycle. A flat top with a rising bottom is bullish. Resistance has been found and is being challenged. It is getting weaker because the action is converging towards the resistance point based on the rising bottom.
Here we have a flat top with a rising bottom (higher lows). The market is bullish. SUIUSDT has been bullish and growing since late 2024. This is the content we need. A bullish tendency, a rising market and resistance being challenged more than once starts to reveal a picture. Next this resistance won't have enough strength to hold. Next time SUI moves up it will continue rising to produce a new all-time high and this will unleash a price discovery phase.
SUIUSDT is trading above EMA55 and EMA89. The last challenge of resistance produced a rejection but this rejection did not lead to a test of the above mentioned support. Another signal of strength.
Sellers cannot push prices lower because buyers are active, or simply put, there are not enough sellers to start and thus the retraces become smaller and shorter. Price dynamics favoring the bulls.
The lows are getting higher, the top remains the same. When the low meets the top that is when resistance breaks. Sui is going up, it will continue to grow; the targets on the chart can be hit short-term.
There is no sense of urgency, but a major advance can be happening within days.
Are you ready to trade and hold? Prices going up aiming high trading requires no effort.
The effort is mental, the mind can be trained to succeed and avoid stress. Mental stress = lack of knowledge. If you know prices are going up and you feel certain about it, no effort is required to win because the mind doesn't have to struggle with questions relating to the strength of your position. The mind does not need to answer, should I buy or should I hold? Since you know prices are going up based on the chart, you can sit back and relax watching your profits grow. Reading relaxes the mind. Knowledge is food for the soul. The more you learn, the more you know the wiser you become. Wise means effortless. Trading can be effortless if you read the right stuff. Play to win. Plan before trading and you already won.
Answer the question before the situation shows up. That's it, you've just removed the complexity out of the game. When there is no complexity, there is no mental stress. Since you are sitting on a chair in front of a device, trading becomes effortless. To trade with peace in your mind you just need the right knowledge and that is what you are getting here. No stress.
Continue reading and watch your profits grow. Increase your peace, free up your time and enjoy better results.
Namaste.
HBAR Game Plan: Short the Bounce, Long the Liquidity GrabHBAR has been moving strongly and is currently offering both short and long trade opportunities based on a clean potential ABC corrective pattern, key fib levels, volume profile, and anchored VWAP. Let’s break down the setup.
🧩 Technical Breakdown
Higher Timeframe Confluence:
0.618 fib retracement from the macro move
1.618 trend-based fib extension
1.272 VWAP band resistance
Point of Control (POC) from the visible range profile
This is marked as a major take profit/short opportunity zone.
For extra confluence, the negative fib extension golden pocket (-0.618 to -0.666) also aligns right at this resistance zone
Current Structure:
We’re potentially completing wave B of an ABC corrective move
Price has retraced into a high-probability short zone
🔴 Short Setup
Entry Zone:
Between the 0.702 and 0.786 fib retracement levels
Why Here?
0.702–0.786 fib retracement → short zone for reversals
Potential wave B top → setting up for a C leg down
Target (TP):
Around $0.25–$0.24, near the expected wave C completion
🟢 Long Setup
Entry Zone:
~$0.25–$0.24 area.
Why Here?
This zone is a strong confluence area:
➡️ 0.786 fib retracement
➡️ 1.0 trend-based fib extension of ABC
➡️ Anchored VWAP from the entire trend, offering dynamic support
➡️ Liquidity pool
➡️ Previous weekly Open
Plan:
Wait for price to complete wave C into this zone, then look for bullish reaction signs to enter long.
💡 Educational Insight
Why the 0.702–0.786 short zone?
These fib levels are often overlooked but are key “hidden” zones where wave B tops out before C waves.
Why anchored VWAP?
Anchored VWAP gives you dynamic institutional support/resistance, especially when aligned with fibs and liquidity.
Why wait for confirmation?
Blindly longing or shorting levels can trap you. Wait for SFPs, wick rejections, or lower timeframe structure flips to boost trade probability.
Final Thoughts
HBAR is in a highly interesting zone, offering both:
A short setup into the C wave,
And a long setup at the C wave completion, backed by multiple confluence factors.
Let the levels come to you and wait for confirmation!
_________________________________
💬 If you found this helpful, drop a like and comment!
Want breakdowns of other charts? Leave your requests below.

Ethereum Charts Aligning for a Major BreakoutI analyzed Ethereum on both the monthly and 2-week timeframes, and the structure looks strong.
On the right side, we have the monthly chart, where ETH has printed a bullish Morning Star pattern right off the key support trendline.
This is a classic reversal signal, and price is now approaching the upper resistance zone. A breakout from here could trigger a major rally, similar to what we saw in 2020.
On the left side, the 2-week chart shows CRYPTOCAP:ETH pressing into a critical resistance zone after a strong bounce. If price breaks and holds above this zone, it could open the doors to $6K–$8K targets in the coming months.
ETH is showing strength, now we wait for confirmation from the breakout.
Thanks for reading!

WEEKLY NYA turns and E Wave see 12/8 2024 forecast The chart of the NYA I have not changed or relabeled anything since 12/8 2024 best trades WAVETIMER

GALA price analysis🪙 Please tell us, is the #GALA project still "alive"?
It's old, has gone through many cycles on the crypto market, and hasn't died yet.
Maybe now (being related to the CRYPTOCAP:ETH Ecosystem) is the best time to “come back to life”?
For this to happen, the price of OKX:GALAUSDT must finally:
1️⃣ confidently hold above $0.01390-0.01460
2️⃣ continue to grow confidently to $0.044
3️⃣ And finally, rapidly grow to $0.10-0.11 by the end of the year.
Is this a realistic scenario? Write your thoughts in the comments.

99% of people buying $NVDA don't understand this:🚨99% of people buying NASDAQ:NVDA don't understand this:
NASDAQ:GOOGL : “We’re boosting AI capex by $10B.”
Wall Street: “Cool, that’s like $1B or 0.06 per share for $NVDA.”
So from $170.50 at the time of news to $170.56 right?
No.
NASDAQ:NVDA trades at 98× earnings. So that $0.06? Turns into $6.00
Why?
Because people are expecting that to be happening every single year for 98 years and they're paying All of it Today in Full amount.
So NASDAQ:NVDA will get $1B more per year. But NASDAQ:NVDA price per share already increased by $100B in past 2 days 😂
Then it crashes 40% and everyone is wondering why.

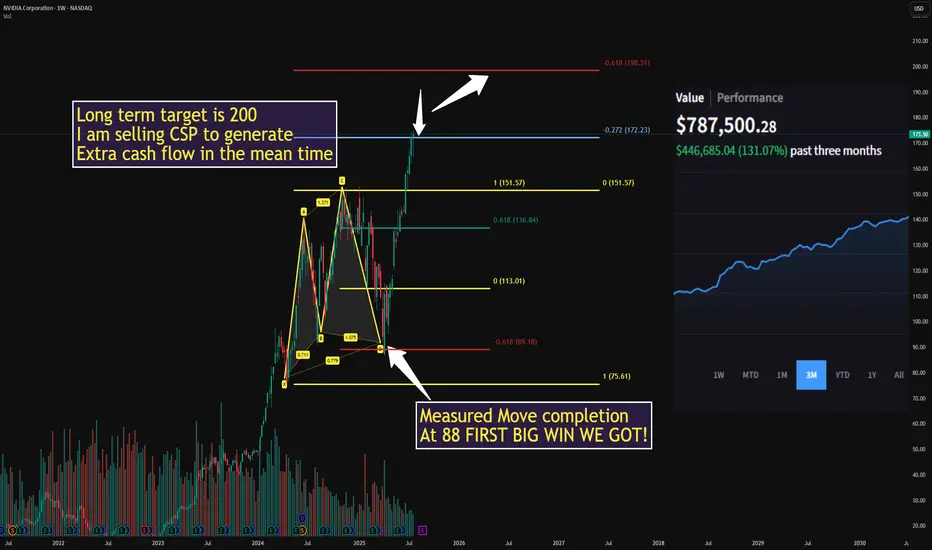
$NVDA ONCE IN A LIFETIME from 88 to 174 BOOM!WE crushed it using the 618 measured move from 88 to 174 in April
Next target is 200 and I am waiting for a decent pull back
In the mean time I will sell puts to generate cash flow, I will alert my next buy here
NO CHARGE all I ask is drop a LIKE
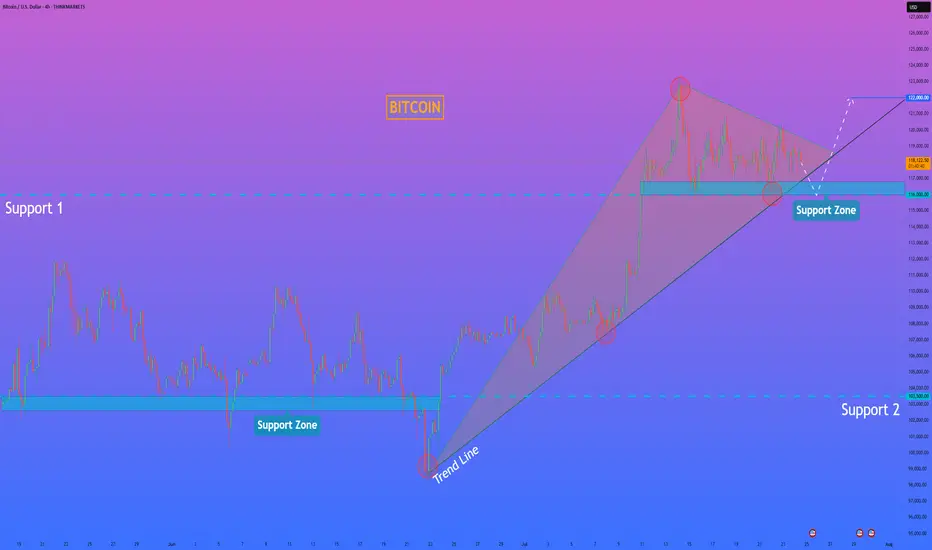
HelenP. I Bitcoin can fall to support zone and then start riseHi folks today I'm prepared for you Bitcoin analytics. If we look at the Bitcoin chart, the most prominent feature is the formation of a large bullish pennant following a strong upward impulse. This type of consolidation pattern typically suggests that the market is pausing to gather strength before continuing in the direction of the primary trend. The price is currently consolidating within the boundaries of this pennant, which are defined by an upper resistance line and a strong ascending trend line acting as the lower support. It is crucial to note the confluence of this ascending trend line with the horizontal support zone between 116000 and 116800, creating a powerful area of potential support. My analysis is based on the expectation that the price will make a final test of this key support confluence. I believe that a dip towards the 116000 - 116800 zone will be met with strong buying interest. A clear rejection from this area, confirming that buyers are defending both the horizontal and dynamic support, would be the critical condition validating a long position. A successful bounce should provide the catalyst for a bullish breakout from the top of the pennant, signaling the resumption of the uptrend. Therefore, I have set the primary goal for this subsequent upward move at the 122000 level, a logical target that would confirm the continuation of the bullish market structure. If you like my analytics you may support me with your like/comment ❤️
Disclaimer: As part of ThinkMarkets’ Influencer Program, I am sponsored to share and publish their charts in my analysis.
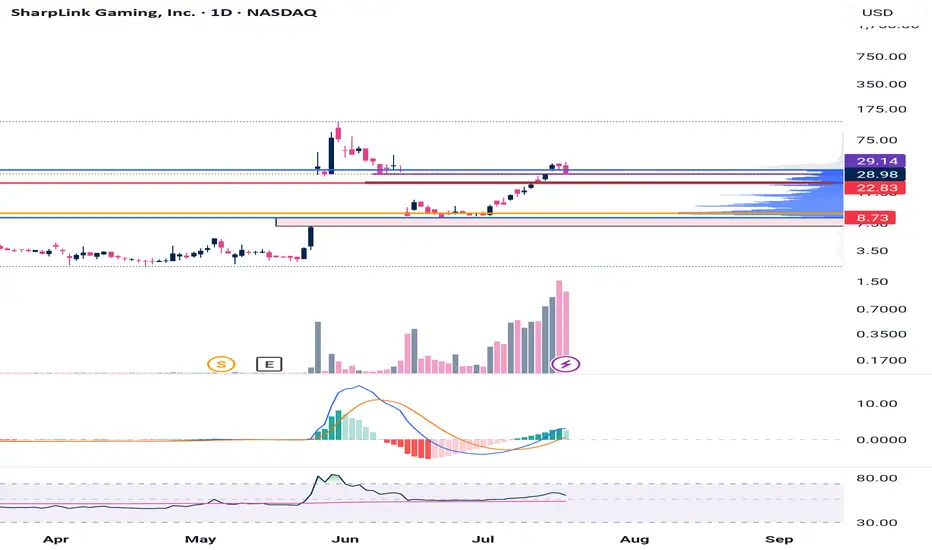
$SBET - look out down below. CRYPTOCAP:ETH is the asset
NASDAQ:SBET is the stock
Some gaps to fill below. Will keep loading.
Could be life changing!
Lingrid | HYPEUSDT Potential Continuation After PullbackKUCOIN:HYPEUSDT is bouncing from a higher low near the 42.070 zone after breaking a descending flag pattern. Price action remains above the ascending support trendline while pressing into a key structure retest. As long as GETTEX:HYPE stays above 42, a bullish leg toward the 49.700 resistance remains likely. Structure suggests a resumption of the impulse phase within the broader uptrend.
📉 Key Levels
Buy trigger: Clean breakout above 45.00
Buy zone: 41.5 – 43.0 (support + flag bottom)
Target: 49.700
Invalidation: Close below 40.00
💡 Risks
Breakdown below the ascending support would weaken the bullish setup
Failure to reclaim mid-flag resistance may lead to deeper consolidation
Broader market weakness in altcoins could delay breakout momentum
If this idea resonates with you or you have your own opinion, traders, hit the comments. I’m excited to read your thoughts!
