Community ideas

Hedera 2025 All-Time High · Simple Analysis Bullish ConfirmedHedera is about to close five weeks green. Five weeks green and we only have a minor advance, relatively speaking. Some 100%. Back in late 2024 five weeks green resulted in more than 800% growth. Huge difference, but after the fifth week growth stopped. This time it will be different.
We already have five weeks of bullish action and this is only portion of the entire bullish period, just a small part. This can continue for months, then a stop and one final jump. Or this can start now and just keep on going until it peaks and that's it, nor more growth until the next bullish phase. So we would see a bear market after the completion of the bull market and the only bullish action would be corrections within the bear market. Right now market conditions are extremely bullish.
We have a long-term lower high. In early 2025 the action peaked below the 2021 all-time high. The wave that is developing now will break this barrier and produce a new all-time high. This is very easy to predict, market conditions are bullish.
The interesting part will be to see how far up Hedera will go. We can use this project, since it is definitely going to be one of the first to peak, to know how the rest of the market will perform. Easy we have between 200% and 400% potential for growth.
I hope you are being entertained and I really hope you enjoy the content. If you do, give me a follow @MasterAnanda
Namaste.

BTC SHORTI've spotted a potential short-term bearish move in Bitcoin. Taking a closer look at the 4-hour chart, it seems like we're on the brink of a short-term reversal that could align perfectly with the higher time frame trend. Let's see how this plays out

Bitcoin is set to experience a decline.After hitting a new all-time high at 123,256.49, Bitcoin, the world’s leading cryptocurrency, pulled back this week, closing on the 4-hour chart below the 115,714 level. This indicates a shift in trend from bullish to bearish and increases the likelihood of a short-to-medium-term decline.
The recent price rise appears to be corrective, and the 121,427 level is considered important and carries downside pressure, as it represents the 78% level of the Fibonacci retracement tool when measured from the recent high to the latest low. Holding below the 123,256 mark and failing to break above it would support the bearish scenario for Bitcoin.

Gold 30Min Engaged ( Bullish & bearish Reversal Entry Detected )————-
➕ Objective: Precision Volume Execution
Time Frame: 30-Minute Warfare
Entry Protocol: Only after volume-verified breakout
🩸 Bullish Reversal : 3354
🩸 Bearish Reversal : 3378
➗ Hanzo Protocol: Volume-Tiered Entry Authority
➕ Zone Activated: Dynamic market pressure detected.
The level isn’t just price — it’s a memory of where they moved size.
Volume is rising beneath the surface — not noise, but preparation.
🔥 Tactical Note:
We wait for the energy signature — when volume betrays intention.
The trap gets set. The weak follow. We execute.
SBET – Holding the Key Zone for a Potential SqueezeSBET – Holding the Key Zone for a Potential Squeeze 🚀🔥
SBET is sitting at a critical support zone (21.0–21.3), right inside the 0.382 Fibonacci retracement. VolanX signals accumulation as volume cools down, setting up for a possible next leg higher.
Key Levels to Watch
Support: 21.0 – 21.3 (Fib 0.382 + structure base) 🛡️
Breakout Zone: 24.8 – 27.8 (Fib 0.5 – 0.618) ⚡
Targets: 33.0 – 36.0 🎯 | Long-term squeeze zone: 51.5 – 64.0 🏆
VolanX Signal
Bullish Bias: As long as 21 holds, liquidity favors upside.
Volume Clue: High spikes suggest prior distribution is cooling, potentially loading for a run.
Momentum Trigger: Close above 24.8 confirms buyers stepping in.
Risk Management
Stop-Loss: 20.4 (below structure) ⛔
Scale Strategy: Add on confirmation above 24.8 and 27.8 to ride the trend.
Profit Zones: 27.8 (TP1) → 33–36 (TP2) → 51+ (runner target).
Question: Are we seeing a base for another SBET explosion or just a pause before deeper discount?
#SBET #Fibonacci #VolanX #TradingView #BreakoutWatch #LiquidityFlow 🚀📊
SBET – VolanX Probabilistic Targets (1–3 week horizon)
For informational/educational purposes only. Not financial advice.
📈 Bullish Paths
P1: Bounce to 24.8–25.5 (Fib 0.5 / structure reclaim) → 58%
Trigger: 21.0–21.3 holds + momentum close above intraday VWAP.
P2: Extension to 27.8 (0.618) / first supply → 38%
Trigger: Clean acceptance >24.8 with rising volume & improving tape.
P3: Squeeze into 33–36 (0.786–0.886 + supply) → 24%
Trigger: Options/flow flip long (OTM calls clustering) + BOS over 27.8.
P4: Parabolic leg to 51.6–64.2 (1.382–1.786) → 10%
Trigger: Narrative + liquidity vacuum (low float + IV expansion).
(Probabilities are conditional—each higher target assumes confirmation of the one before it.)
📉 Bearish Paths
N1: Slip under 21 → 18.2–19.0 (0.309/discount shelf) → 27%
Trigger: Failure to defend 21 with increasing sell volume.
N2: Deeper flush to 16.6 (0.236) zone → 17%
Trigger: Persistent risk-off / liquidity drain, IV spike without demand.
N3: Capitulation toward 13.1 (0.146) / prior demand → 6%
Trigger: Macro shock or failed financing/newsflow, liquidity gap.
🧠 VolanX Read (today)
Bias slightly bullish as long as 21.0–21.3 holds. The engine scores Path P1 > P2 > N1. Expect chop → impulsive move once 24.8 is cleanly reclaimed or 20.4 is lost.
🛡️ Risk Management
Invalidation (swing): Daily close < 20.4.
Sizing: 0.5–1.0% account risk; micro-cap jump risk.
TP ladder: 24.8 ➜ 27.8 ➜ 33–36 ➜ leave runner for 51+.
Adjust: Move to BE after 24.8 reclaim; trail under last 4h HLs.

EURUSD at Make-or-Break Zone: Time to Short?EURUSD – Key Data Out Today, Short Setup Confirmed?
Today, several important economic indexes were released for both the Euro(EUR) and the Dollar(USD) . Let’s break them down in a simple way:
Eurozone PMI Data: Mixed to Weak
France:
Manufacturing PMI: 48.4 (slightly lower than forecast)
Services PMI : 49.7 (flat, but below 50 = contraction)
Germany:
Manufacturing PMI: 49.2 (weaker than expected)
Services PMI : 50.1(slightly expansionary)
Eurozone Overall:
Manufacturing PMI: 49.8 (still below 50)
Services PMI : 51.2 (slightly stronger than forecast)
ECB left the Main Refinancing Rate unchanged at 2.15% , which was widely expected.
U.S. Data( TVC:DXY ): Strong and Surprising
Unemployment Claims: 217K (better than expected 227K)
Manufacturing PMI: 49.5 (below forecast of 52.7 – a negative surprise)
Services PMI: 55.2 (well above forecast and previous – bullish for USD)
Interpretation :
The Eurozone's growth remains sluggish, especially in France and Germany.
Despite a drop in U.S. manufacturing, the services sector remains strong, and unemployment data confirms labor market resilience.
This mixed picture slightly tilts the balance in favor of the U.S. dollar, especially as the ECB remains on hold while the Fed may still consider being restrictive.
Bias: Short EURUSD ( FX:EURUSD )
Fundamentals support a Short position in EURUSD, in line with the current technical setup.
---------------------------------
Now let's take a look at the EURUSD chart on the 4-hour time frame to find the best Short position .
EURUSD is currently trading in an Ascending Channel and at a Heavy Resistance zone($1.1845-$1.1602) .
Also, in terms of Elliott wave theory , it seems that EURUSD is completing a microwave 5 of the main wave 5 .
One of the most important supports ahead for EURUSD could be the 100_SMA(4-hour TF) .
If the currently 4-hour candlestick forms a Shooting Star Candlestick Pattern , it is a better sign for EURUSD to fall .
Also, we can see the Regular Divergence(RD-) between Consecutive Peaks .
I expect EURUSD to decline to at least $1.169 AFTER breaking the lower line of the ascending channel .
Second Target: Support zone($1.1642-$1.158) and Monthly Pivot Point.
Note: Stop Loss(SL)= $1.1850
Please respect each other's ideas and express them politely if you agree or disagree.
Euro/U.S. Dollar Analyze (EURUSD), 4-hour time frame.
Be sure to follow the updated ideas.
Do not forget to put a Stop loss for your positions (For every position you want to open).
Please follow your strategy and updates; this is just my Idea, and I will gladly see your ideas in this post.
Please do not forget the ✅' like '✅ button 🙏😊 & Share it with your friends; thanks, and Trade safe.

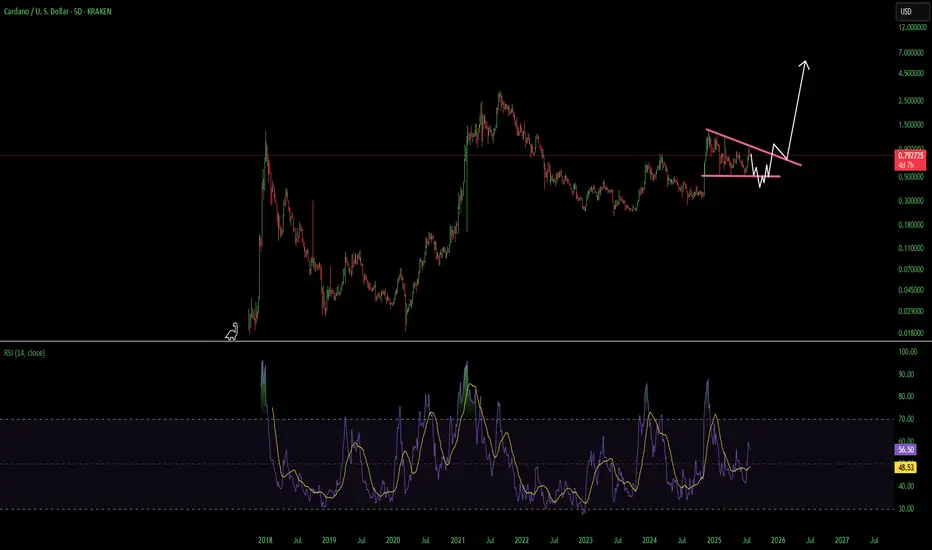
ADA Cardano Decsending Triangle Use Caution HereCardano had a heck of a move but i think its going to erase most if not all of it before it goes on its next leg up. A break over the overhead resistance line and finding support above would invalidate this. Not financial advice just my opinion. Thank you
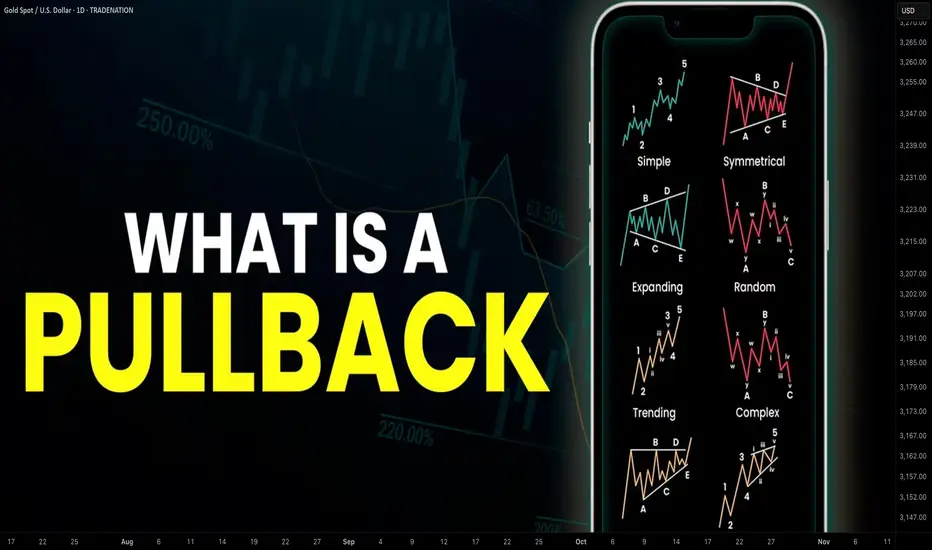
Learn What is PULLBACK and WHY It is Important For TRADING
In the today's post, we will discuss the essential element of price action trading - a pullback.
There are two types of a price action leg of a move: impulse leg and pullback.
Impulse leg is a strong bullish/bearish movement that determines the market sentiment and trend.
A pullback is the movement WITHIN the impulse.
The impulse leg has the level of its high and the level of its low.
If the impulse leg is bearish , a pullback initiates from its low and should complete strictly BELOW its high.
If the impulse leg is bullish , a pullback movement starts from its high and should end ABOVE its low.
Simply put, a pullback is a correctional movement within the impulse.
It occurs when the market becomes overbought/oversold after a strong movement in a bullish/bearish trend.
Here is the example of pullback on EURJPY pair.
The market is trading in a strong bullish trend. After a completion of each bullish impulse, the market retraces and completes the correctional movements strictly within the ranges of the impulses.
Here are 3 main reasons why pullbacks are important:
1. Trend confirmation
If the price keeps forming pullbacks after bullish impulses, it confirms that the market is in a bullish bearish trend.
While, a formation of pullbacks after bearish legs confirms that the market is trading in a downtrend.
Here is the example how bearish impulses and pullbacks confirm a healthy bearish trend on WTI Crude Oil.
2. Entry points
Pullbacks provide safe entry points for perfect trend-following opportunities.
Traders can look for pullbacks to key support/resistances, trend lines, moving averages or Fibonacci levels, etc. for shorting/buying the market.
Take a look how a simple rising trend line could be applied for trend-following trading on EURNZD.
3. Risk management
By waiting for a pullback, traders can get better reward to risk ratio for their trades as they can set tighter stop loss and bigger take profit.
Take a look at these 2 trades on Bitcoin. On the left, a trader took a trade immediately after a breakout, while on the right, one opened a trade on a pullback.
Patience gave a pullback trader much better reward to risk ratio with the same target and take profit level as a breakout trader.
Pullback is a temporary correction that often occurs after a significant movement. Remember that pullbacks do not guarantee the trend continuation and can easily turn into reversal moves. However, a combination of pullback and other technical tools and techniques can provide great trading opportunities.
❤️Please, support my work with like, thank you!❤️
I am part of Trade Nation's Influencer program and receive a monthly fee for using their TradingView charts in my analysis.
Ethena · Millions Overnight? It Can Be DoneEthena is starting its 2025 bullish cycle with three full green candles. The current week has the highest volume since the first week of trading in April 2024. Normally the first week of trading tends to produce the highest volume. ENAUSDT is matching those days now and market conditions are so much better in 2025 compared to 2024.
The entire bullish period last year lasted less than two months. That's it. This wasn't an uptrend nor a bull market, it was more like a bullish jump. A momentary event. ENAUSDT right now is entering the 2025/26 bull market. Growth can be sustained for a period of 6 months or longer. Sometimes a bull market trend can last 8 months, 12 months, or even 16 months or longer. We have many examples across the market.
This week Ethena is trading above EMA55 weekly for the first time ever. The bullish bias is confirmed.
When I saw this pair it was already moving, not the bottom catch that I like and go for and yet, I still went ahead on it because it is still early when you consider the bigger picture; practice what you preach.
We missed the bottom but it is still early, there is plenty of room available for growth. Trading is easy when the market is approached with the right mentality, with a simple working plan. Buy and hold. Watch how the market will take care of the rest.
Just deposit and continue to invest, as much as you can. Continue to add to each position you like and grow; let it grow. Check back every 3 weeks, every 1-2 months; watch your money grow. It is truly that simple. Timing is very important for this strategy and the best timing is now. Right now we are on the verge of a major advance, no need to wait. You can buy today and start earning within days.
A few months back, we had to wait for months. A few weeks back, we had to wait for weeks. Entering the market now, the wait is short but patience is key.
It will go higher than what is shown on the chart. This publication is to alert you of a great timing, be ready to wait. Make sure to do your own planning. The risk is minimum when trading spot. The worst case scenario is a long wait. If things go right; enter green, stay green and profits-capital grow.
Success can be achieved but the hard part is being around now, when prices are low. It is easy to be around when there is hype and everything is 1,000% up. But can you beat the impulse to sell when the right choice is to buy? Can you take action now and go ahead?
If you are reading this now, you are in the right track but for many people it is not that easy, they are allergic to low prices and they won't be reading this until it is too late. 90% of the people will only become aware of these opportunities that I am showing you daily when it is too late.
That's ok. We use the experience to learn. When I first started I went through the same process. The euphoria got my attention and when I became aware of the market everything was already high up. We tend to join at the market top. But then we go through the entire cycle, the market is here to stay. We get to buy the bottom, we gain experience and in the end we can always win if we never give up. Persistence and consistency, be ready to hold.
If you can hold your altcoins when prices are low, you will reap the rewards at the time of the bull run. Millions to be made overnight. Years of preparation, but it can be done.
Namaste.

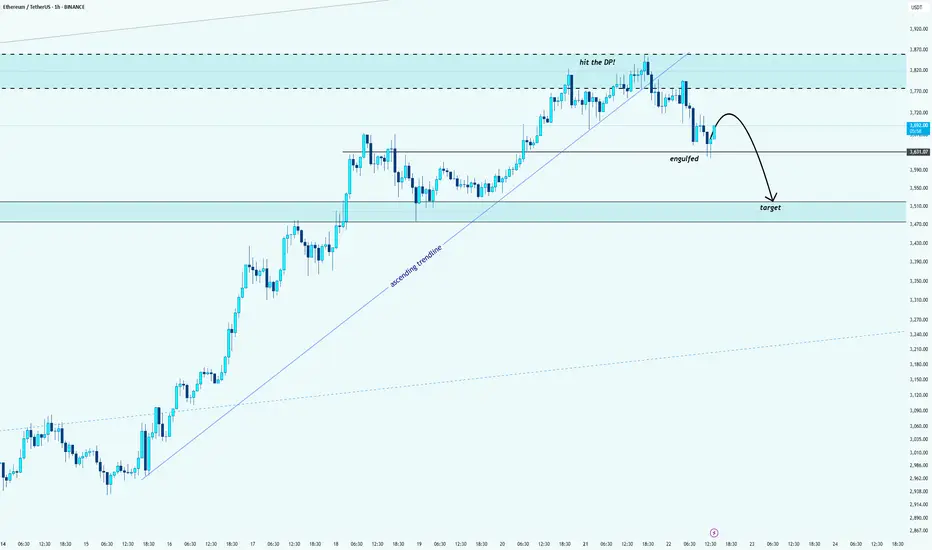
ETH/USDT: Bearish Reversal After Hitting the Decision PointHello guys!
After a strong rally, ETH finally hit the Decision Point (DP) zone marked above. Like what I said:
And we’ve already seen signs of rejection from that level.
🔹 The ascending trendline is broken
🔹 A key support got engulfed
🔹 Price is now forming a bearish structure
The target zone is mapped out around $3,500 – $3,470, where previous demand sits.
We might see a small pullback before continuation, but overall momentum is shifting downward.
Wait for confirmations and protect your capital
Hedera (HBAR): Waiting For Break of Structure (BOS) | BULLISHWe are bullish as soon as we hit that BOS near the local EMAs, which will confirm our buy-side trading setup.
Now there is one thing that concerns us, that being the huge CME gap below our local lows on current timeframes, so it is very important here to wait for that BOS before entering into long here, so let's wait.
Swallow Academy

Dogecoin (DOGE): Breakout Happened | Another 200% Incoming!Dogecoin has had a really good rally so far, but that's not all; we might see another 200% movement from the current market price!
More in-depth info is in the video—enjoy!
Swallow Academy

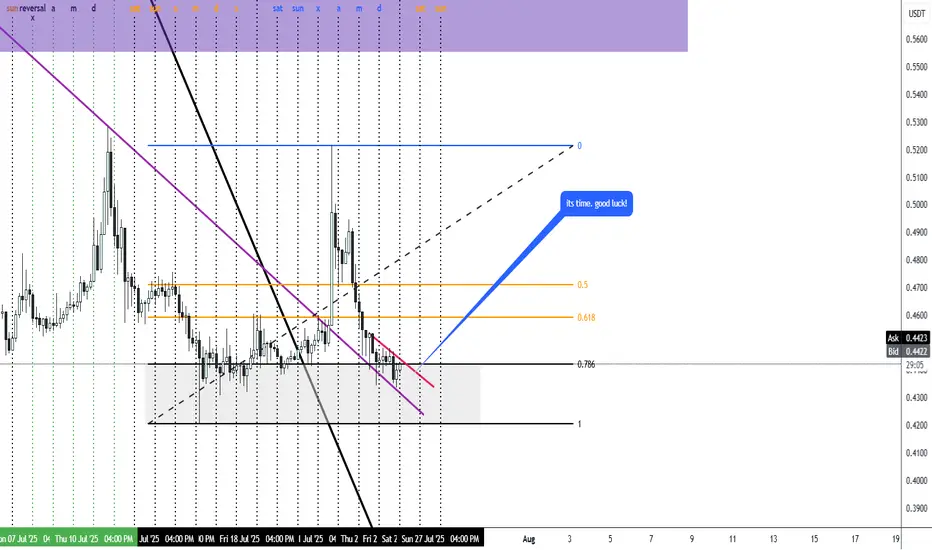
PIUSDT Time is NOW - BullishWe saw change of character.
i think It is now time to get in.
good luck to all!
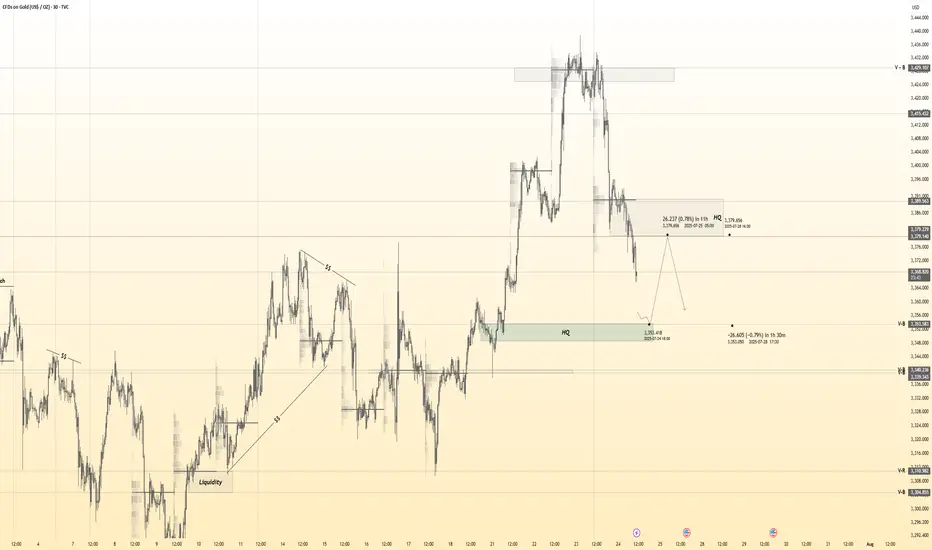
XAU/USD: A Classic VSA Short Setup in PlayFollowing up on the general weakness we discussed in Gold, here's a closer look at a specific trade setup that's unfolding right now. This is a textbook example of a high-probability short setup according to Volume Spread Analysis (VSA).
Let's break down the story the volume is telling us.
1. The Breakdown: Sellers Show Their Hand
First, look at how the price broke down hard through that support level (the grey box). Notice the volume on that sharp drop? It was high. This is our clue that sellers are strong and in control. They had enough power to smash right through a level that was previously holding the price up.
2. The Retest: Buyers Don't Show Up
Now, the price is creeping back up to that same exact level. But here's the most important clue: look at the volume on this rally. It's much lower than the volume on the breakdown.
This is what VSA calls a "No Demand" rally. It’s like the market is trying to push a car uphill without any gas. It tells us that strong buyers (the "smart money") have no interest in buying at these prices.
3. The Setup: Selling into Weakness
This combination creates a classic short setup:
Logic: We are looking to sell at a level where old support has flipped into new resistance.
Confirmation: The low volume on the retest confirms the rally is weak and likely to fail.
How to Potentially Trade It
The grey box represents a high-probability entry zone. To time an entry, you could watch for a clear rejection signal right inside this zone. For example:
A "rejection candle" (like a pin bar) that pushes into the zone but gets slammed back down.
An up-bar with a tiny body and very low volume, showing buyers are completely exhausted.
Seeing one of these signs would be the final confirmation that sellers are about to take back control.
Conclusion:
This is a powerful setup because all the pieces line up: the background is weak, sellers have shown their strength, and buyers are now showing no interest at a key resistance level.

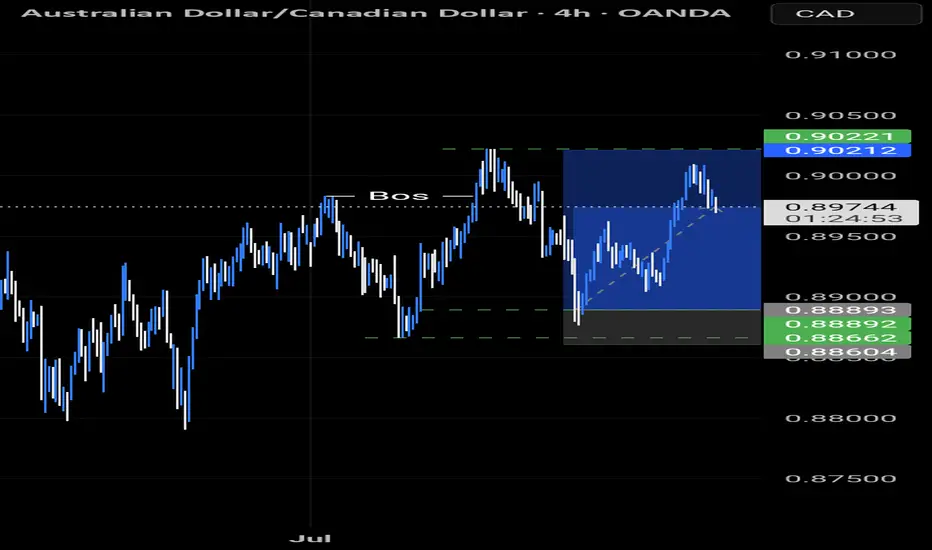
AUDCAD TRADE IDEA AUDCAD has given us a pullback to our Fibonacci level and has flown to the moon...
Let's see if the market does it's thing and gets to our desired target
TOTAL CRYPTO MARKET CAP expected to hit $6 Trillion!The Crypto Total Market Cap (TOTAL) has been on a Channel Up since the 2022 market bottom and since the April 07 2025 Low (Higher Low for the pattern), it's initiated the new Bullish Leg, already turning the 1W MA50 (blue trend-line) into Support.
As long as this holds, we expect it to complete a +270% rise from the August 05 2024 Low, similar to the Bull Cycle's first Green Phase, and reach at least a $6 Trillion Market Cap!
More importantly, we expect this final part (blue ellipse) to be what is commonly known as an Altseason, where the lower cap coins show much higher returns and disproportionate gains to e.g. Bitcoin.
-------------------------------------------------------------------------------
** Please LIKE 👍, FOLLOW ✅, SHARE 🙌 and COMMENT ✍ if you enjoy this idea! Also share your ideas and charts in the comments section below! This is best way to keep it relevant, support us, keep the content here free and allow the idea to reach as many people as possible. **
-------------------------------------------------------------------------------
💸💸💸💸💸💸
👇 👇 👇 👇 👇 👇

USDJPY: Confirmed CHoCH & Bullish OutlookI spotted a confirmed Change of Character on 📈USDJPY on 4-hour timeframe.
The market, currently in a global bullish trend, has effectively broken through a minor bearish trend and surpassed a key horizontal resistance level.
It is likely to continue rising, with the next resistance at 149.00.

Flat, Quiet… and Full of Clues .Most traders only see the middle.
The acceleration. The “trend”. The movement.
But that’s just one-third of the story.
If you really want to understand the market’s rhythm,
you need to study how moves begin, evolve, and die.
Let’s break down the 3 key phases every market goes through —
again, and again, and again.
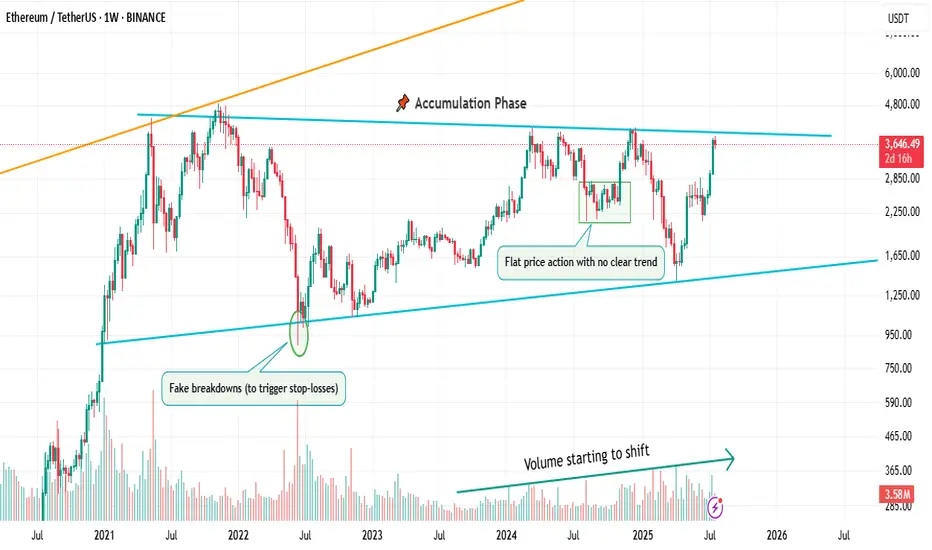
📌 1. Accumulation Phase
This is the part no one talks about.
Why? Because it’s boring. Choppy. Range-bound. Confusing.
Most traders get shaken out here.
But smart money? They’re quietly buying.
You’ll often see:
Flat price action with no clear trend
Fake breakdowns (to trigger stop-losses)
Volume starting to shift
Long wicks — both directions
This phase is a test of patience, not prediction.
And if you learn to read it well, you’ll start catching moves before they go parabolic.
🚀 2. Markup / Acceleration Phase
Here’s where everyone wakes up.
Momentum kicks in.
News gets bullish.
Breakouts start working.
Pullbacks are shallow.
And suddenly, everyone’s calling it a bull market.
But don’t be fooled.
This is not where smart money enters — this is where they ride the wave they already created.
Learn to:
Ride trends, not chase them
Add on pullbacks
Avoid FOMO entries
This is the fastest and most emotional part of the cycle — which means it rewards discipline, not excitement.
🧯 3. Distribution Phase
The party’s still on… but the hosts are quietly leaving.
Price starts to stall.
Breakouts stop working.
Volume gets heavy at the top.
And the same excitement that brought everyone in?
It’s now being used to sell into.
Distribution is sneaky.
It’s not an obvious top.
It’s a process — just like accumulation.
You’ll often see:
Lower highs forming quietly
False breakouts to trap buyers
Increasing volatility
Bullish news… with no follow-through
If you’re not paying attention, you’ll keep buying strength —
right before the rug gets pulled.
So what’s the lesson here?
Markets don’t just “go up or down.”
They prepare, move, then exhaust.
And if you learn to spot these transitions —
you’ll stop reacting late
and start positioning early.
That’s the real edge.
currently we are on the accumulation phase so in this idea I tried to show you the real story behind it and as well talk about the two others to beware of them also in the right moment I will talk about them , but for now let's focous on the current phase because we want to be part of the smart money and enjoy the next phase which is 🚀Markup / Acceleration Phase .
—
🧠 Save this post.
🔁 Revisit it when you’re confused.
📊 Because the chart isn’t random — it’s just cycling
And also remember our golden rule :
🐺 Discipline is rarely enjoyable , but almost always profitable. 🐺
🐺 KIU_COIN 🐺
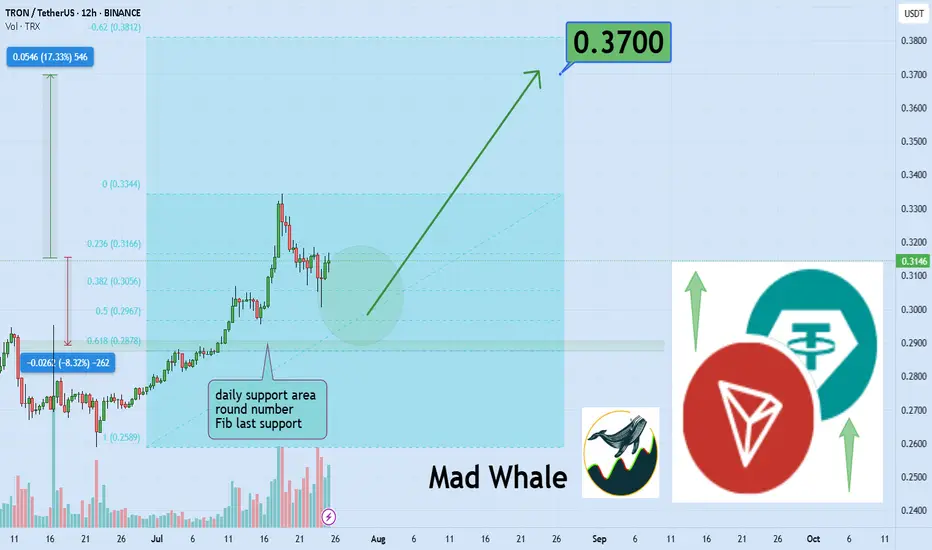
TRON Eyes 17 Percent Surge Toward Explosive 0.37 Breakout TargetHello✌
Let’s analyze TRON’s upcoming price potential 📈.
BINANCE:TRXUSDT is currently approaching a key daily support zone that aligns with a notable Fibonacci retracement level 🧭. This technical confluence suggests a potential short-term rebound, and I’m watching for a possible move of around 17% toward the 0.37 target 🎯.
✨We put love into every post!
Your support inspires us 💛 Drop a comment we’d love to hear from you! Thanks , Mad Whal
EURJPY: Correction is Over?!It seems like 📈EURJPY has finished consolidating within a broad horizontal channel on the 4H chart.
The formation of a new higher high today suggests potential upward movement.
Since it's Friday, I recommend considering trend-following buys starting Monday.
We should wait for the market to close above the highlighted resistance to establish a Higher Close on the daily chart.
Look to buy after a pullback, targeting 174.00 as the initial goal.

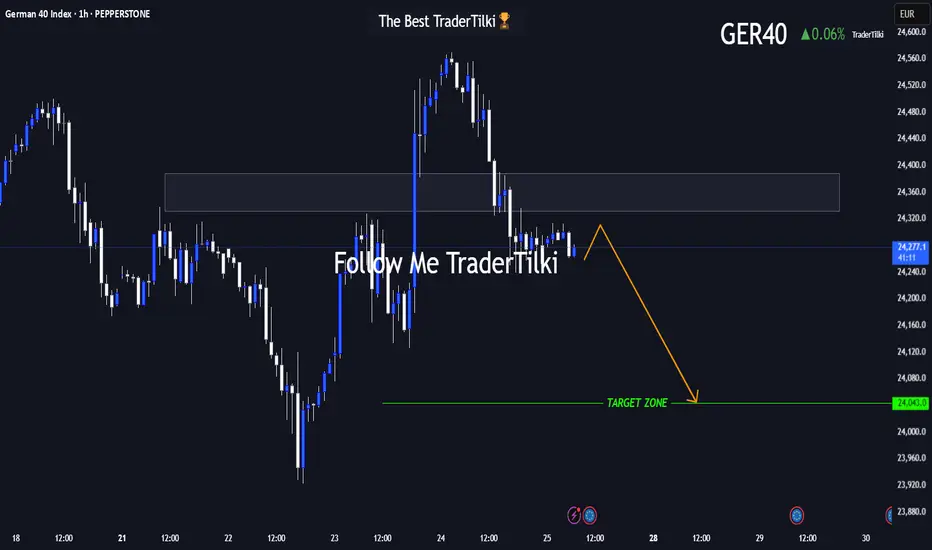
GER40 in Motion: This Setup Speaks Volumes 🌅 Good morning, my friends,
I’ve put together a fresh GER40 analysis just for you. Even if the 1-hour timeframe shows some upward momentum, I fully expect the price to reach my target level of **24,050**.
I'm holding firm until that level is hit.
Every single like from you is a massive source of motivation for me to keep sharing analysis. Huge thanks to everyone supporting with a tap!
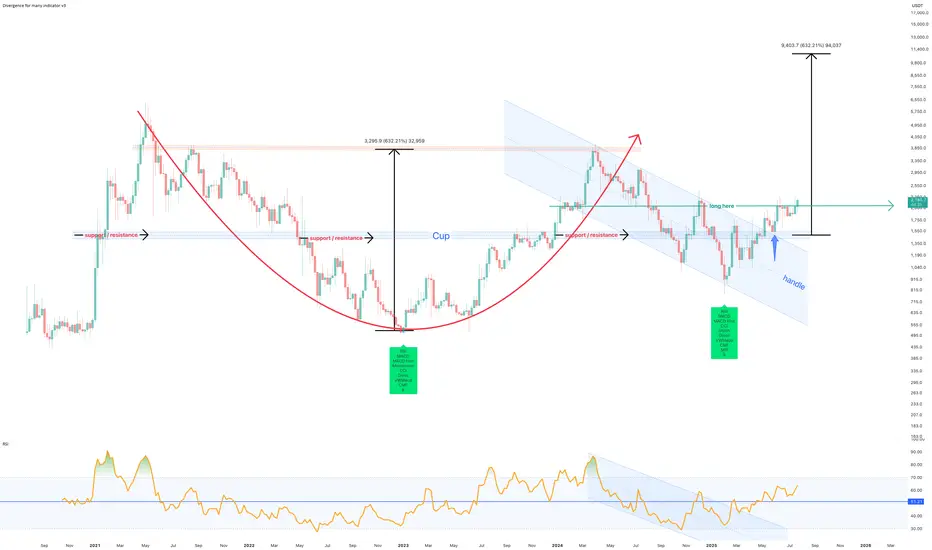
July 2025 - Marker DAO (MKR) to $10k before EthereumThe above forecast is predicted to strike before October 2025. Ethereum will never reach $10k in its lifetime, which a study for another post.
A 75% correction is shown on the above 6 day chart that began in March 2024. A number of compelling reasons now exist for a strong upward move.
Support and resistance
Look left, price action confirms support on past resistance, which follows a strong positive divergence. The resistance has held since May 2022. Incidentally on the topic of divergences, on the same time frame with the same settings, Ethereum prints a double negative divergence over the same period. (see below).
The trend
Both Price action and RSI resistances have broken out. RSI confirms a trend reversal on past resistance.
A Cup and Handle pattern confirmation
The forecast is derived from the Cup and Handle pattern topping out at around $10.5k, however it is not suggested to wait until this area before profits are taken.
Is it possible price action continues to print lower lows? Sure.
Is it probable? No.
Ww
Ethereum 6 day double negative divergencies