UNH: Monthly outlook UNH is an interesting case study, fundamentals vs technicals vs math.
If you were sleeping, here are the cliff notes on UNH:
UNH is alleged to have commited the following violations/criminal offences
Medicare Overbilling: The U.S. Department of Justice has accused UNH of overcharging Medicare by more than $2.1 billion, allegedly by manipulating diagnosis codes to inflate payments.
Securities Fraud: A class action lawsuit claims UNH misled investors by denying coverage to boost profits, which allegedly contributed to a sharp drop in stock value.
Undisclosed Payments: Reports suggest UNH made secret payments to nursing homes to reduce hospital transfers, potentially compromising patient care.
How did it come to light, you ask?
From whistleblowers, investigative journalists and a DOJ probe (department of justice).
While the investigation is ongoing, if they are found guilty of any or all of these allegations, the penalties could be:
Billions in fines
Civil damages
Criminal charges
Sanctions that can fundamentally interfere with how they do/conduct business
With that out of the way, ask yourself: Am I buying this while there is an ongoing criminal investigation that could very well result in the insolvency of an organization?
I know a lot of people think the charts tell the news, but something this serious unfortunately can't be foretold by a chart, in my opinion.
But let's humour the fallacy that these traders have, and entertain whether or not UNH could theoretically be a buy.
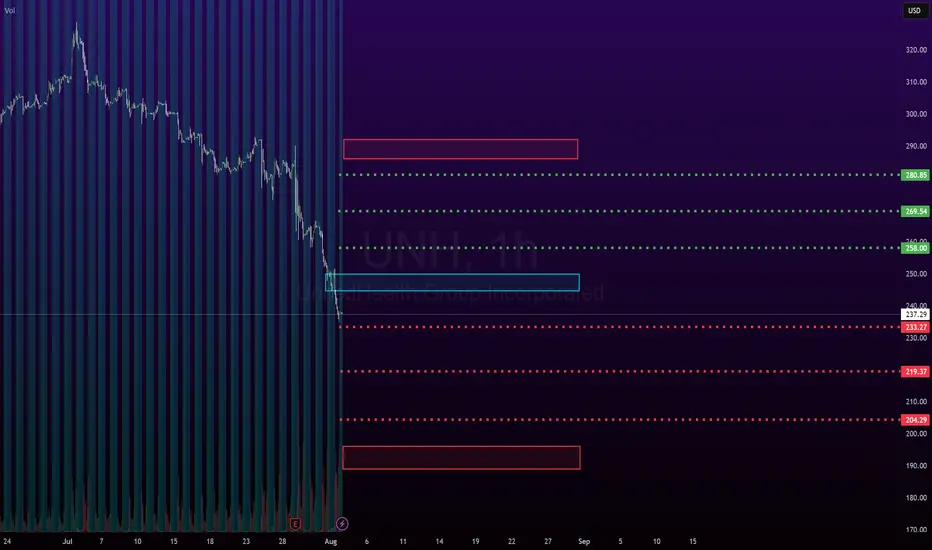
Technicals:
Oversold, obviously.
No clear bottom pattern.
No clear chart pattern at all.
Massive investor exodus, with the current selling volume being almost as much as the flash crash we had the beginning of this year and the third highest in UNH's long, long life on the NYSE.
Math:
While UNH is below is quadratic mean, it has not triggered a bullish mean reversion signal yet.
Forecast into next week is bullish with some upside bouncing expected.
Mid term forecast (over the next month) has it coming down to 220.
The math levels are posted in the chart and 220 is actually the second low target on the month, so that's interesting.
This will go lower obviously if guilt is found or damming evidence comes forth in the media over the next days. I say this because UNH popped up on my sweep alerts. Four (4) very large option orders have popped up on my order flow screener for UNH, totaling over 7 million in short premiums (puts).
First is the 480 put strike expiry 08-15 of this year with 4.2 million in premiums bought.
Second is the 530 put strike, expiry 09-19 of this year with 634 k in premiums bought.
Third is the 540 put strike, expiry 09-19 with 815 k of premiums bought.
Last is the 600 put strike, expiry 01-16-2026 with 554 k of premiums bought.
This obviously has me interested that someone knows something about stuff.
But this is not advice, just reporting what I see.
Safe trades everyone!
Community ideas
USDJPY (Monthly/Weekly/Daily analysis)hi everyone welcome back to another week hope everyone had a great weekend and as always happy trading

Insider Selloff + Liquidity Sweep🔻 PENGU/USDT TRADE IDEA 🔻
📣 Hey CandleCraft crew!
Today we’re diving into a chilly little bird that flew a bit too close to the heat. 🐧 PENGU pumped hard — but when team wallets start dumping $17M worth of tokens, that’s not bullish, that’s suspicious. Think iceberg ahead.
🔥 TRADE SETUP
Bias: Short
Strategy: Insider Selloff + Liquidity Sweep
Entry: $0.036 – $0.038
SL: $0.041
TPs: $0.030, $0.025, $0.018
Why?
– HTF sweep of liquidity above $0.04
– Insider wallet moved 485M tokens to exchanges
– LTF CHoCH + RSI breakdown
– Price hovering under 20-day EMA with weakening volume.
Candle Craft | Signal. Structure. Execution.

USDJPY Weakening or a Correction to the Uptrend✏️ OANDA:USDJPY is approaching the old Break out support zone. The convergence zone of the 2 EMA lines. If there is a sweep to the support zone at the beginning of the week, it will be an opportunity to buy to continue the bullish wave structure. When this 146.200 zone is broken, the uptrend will be broken and we have to wait for new momentum to determine the next trend.
📉 Key Levels
Support: 146.200-143.200
Resistance: 150.800-154.500
Buy zone 146.300 (Support & Trendline)
Buy zone 143.200 Strong support zone
Target 154.500
Leave your comments on the idea. I am happy to read your views.

IM EXPECTING GOLD TO COLLAPSEHere on the post, i shared my SAXO:XAUUSD sell analysis, for further details, see the content of the post. All the best.

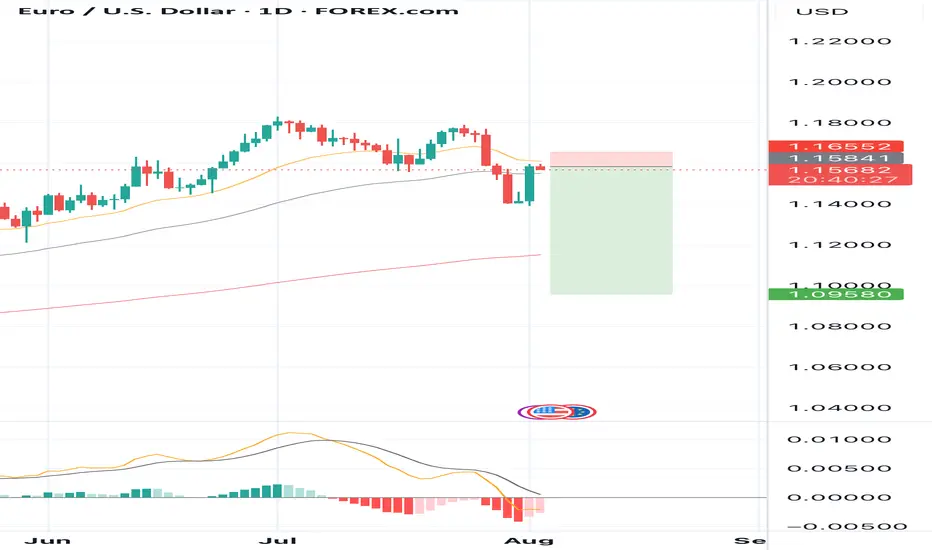
SELL EURUSD for bullish divergence trend reversal STOP LOSS: 1.1SELL EURUSD for bullish divergence trend reversal STOP LOSS: 1.1655
Regular Bearish Divergence
In case of Regular Bearish Divergence:
* The Indicator shows Lower Highs
* Actual Market Price shows Higher Highs
We can see a strong divergence on the MACD already and There is a strong trend reversal on the daily time frame chart.....
The daily time frame is showing strength of trend reversal from this level resistance so we are looking for the trend reversal and correction push from here .....
TAKE PROFIT: take profit will be when the trend comes to an end, feel from to send me a direct DM if you have any question about take profit or anything
Remember to risk only what you are comfortable with........
TradeCityPro | Bitcoin Daily Analysis #142👋 Welcome to TradeCity Pro!
Let's get into the Bitcoin analysis. Yesterday, Bitcoin continued its correction and we need to see what is going to happen in the market today.
📅 Daily Timeframe
First, let’s take a look at the higher timeframe. On the daily chart, that curved upward trendline we had was broken by yesterday's candle, and the breakout candle had high volume.
✔️ For now, I don’t consider this trendline as broken and I’m waiting to get confirmation of the break.
🔍 Currently, the price is in a correction phase, and this correction is quite natural since the price had very low volatility for a long time and was stuck below the 120000 zone.
💥 But no trend reversal has occurred yet. In my opinion, as long as the price is above the 110000 zone, the trend is bullish, and I will consider the trend reversal confirmed only if a lower high and a lower low below 110000 are formed.
⏳ 4-Hour Timeframe
Yesterday, the corrective movement of the price continued, and after a pause at the 0.5 Fibonacci level, another bearish leg formed down to the 0.618 zone.
🔔 The RSI oscillator also entered the oversold area and then exited it again. I believe there’s a high possibility that until the end of the week, Bitcoin will range in these areas and the probability of a bullish or bearish move is much lower.
🔽 However, if the 0.618 Fibonacci level breaks, the price can move to lower areas like the 111000 zone. I think the likelihood of this happening in the future is high because that zone is a strong PRZ, and at the same time, it counts as a pullback to the 110000 zone.
📈 In the bullish scenario, if the price is supported from this area and starts to move upward, since we currently have no highs below the 116000 zone, we need to wait until the first bullish leg is formed and then enter on the second leg after the new high is broken.
⚡️ For now, I’m not opening any short or long positions. I prefer the price to form more structure so I can make a more comfortable decision.
❌ Disclaimer ❌
Trading futures is highly risky and dangerous. If you're not an expert, these triggers may not be suitable for you. You should first learn risk and capital management. You can also use the educational content from this channel.
Finally, these triggers reflect my personal opinions on price action, and the market may move completely against this analysis. So, do your own research before opening any position.

SONIC. USDTNote, that most of the news concerns a number of cryptocurrencies that have grown and are now adjusting their price.
But there are a number of cryptocurrencies for which there is no news.
One of these cryptocurrencies is Sonic.
" No news is good news".
So, it is not too difficult to guess that the first target for Sonic is $0.45.

AUDUSD: Bearish Continuation from broken supportThe current setup is a clean example of a trend continuation play. Price recently broke decisively below a structure zone, this break and retest now flips the narrative, what once was a buy zone is now an opportunity for short entries.
Following the aggressive move down, price now began pulling back into that broken zone. The move appears corrective rather than impulsive, characterized by a slower, more rounded structure typical of pullback leg. This is classic behavior in continuation setups: fast drop, slow retrace, and then potential for the next leg lower.
The projected move targets a retest of the swing low at 0.63800. That level is significant, it's a level where prior demand reacted strongly and now it serves as the next probable magnet for price.
What makes this continuation trade high probability is the sharpness of the prior bearish impulse as it signals intent. The market seems to be in a controlled bearish sequence, where sellers dominate momentum and retracements offer fresh entries for trend followers.
The structure and zone alignment all point in the same direction continuation lower, not reversal.
Let me know in the comments what you think
Disclosure: I am part of Trade Nation's Influencer program and receive a monthly fee for using their TradingView charts in my analysis.

GOLDGOLD needed a reaction from 3360 which is what market gave us, now we need some more upside before any correction.
Disclosure: We are part of Trade Nation's Influencer program and receive a monthly fee for using their TradingView charts in our analysis.

BTC SHORT SETUP INTRADAY ( 02 AUG 2025 )If you have doubt on our trades you can test in demo.
Details:
Entry: 113,680 $ - 113,450 $
Target Price: 112,300 $
Stop loss: 114,370 $
Trade Ideas:
Idea is clearly shown on chart + we have some secret psychologies and tools behind this.
What is required to Join VIP?
- Nothing just you have to share 10% of your profit with us at the end of the month which you earned from our signals. Yeah this is just the requirement, trade where ever you like your favorite broker or else you don't need to pay fees first or create account thru our link.
Trade Signal:
I provide trade signals here so follow my account and you can check my previous analysis regarding BITCOIN. So don't miss trade opportunity so follow must.
BINANCE:BTCUSDT BINANCE:BTCUSDT.P BINANCE:BTCUSD

GALA.USDTEvery price correction in Gala is a buying opportunity.
So, we can wait for the channel's upper limit of $0.02 to be reached.
But if the price can confidently overcome $0.02, a 200% increase is guaranteed.

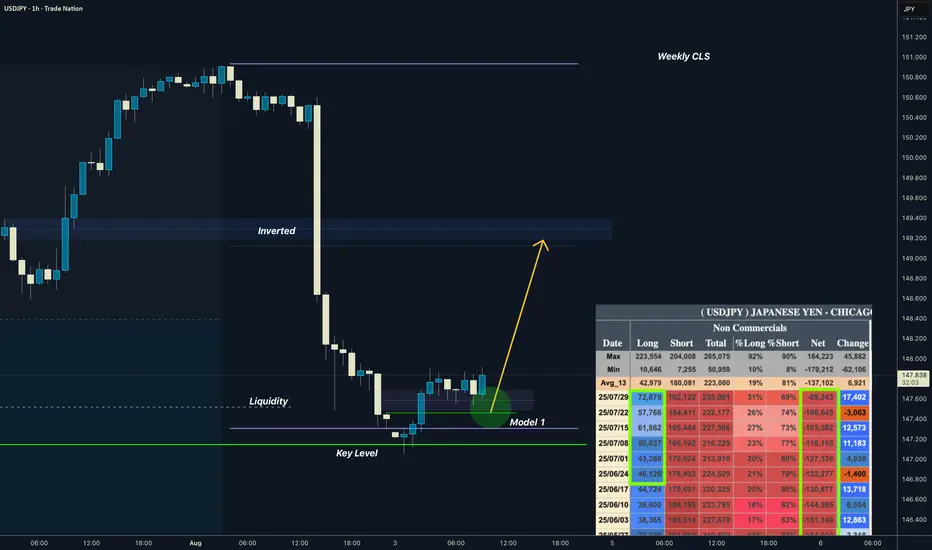
USDJPY I Weekly CLS Range I Model 1 I COT is BullishYo Market Warriors ⚔️
Fresh outlook drop — if you’ve been riding with me, you already know:
🎯My system is 100% mechanical. No emotions. No trend lines. No subjective guessing. Just precision, structure, and sniper entries.
🧠 What’s CLS?
It’s the real smart money. The invisible hand behind $7T/day — banks, algos, central players.
📍Model 1:
HTF bias based on the daily and weekly candles closes,
Wait for CLS candle to be created and manipulated. Switch to correct LTF and spot CIOD. Enter and target 50% of the CLS candle.
For high probability include Dealing Ranges, Weekly Profiles and CLS Timing.
Analysis done on the Tradenation Charts
Disclosure: I am part of Trade Nation's Influencer program and receive a monthly fee for using their TradingView charts in my analysis.
Trading is like a sport. If you consistently practice you can learn it.
“Adapt what is useful. Reject whats useless and add whats is specifically yours.”
David Perk aka Dave FX Hunter
💬 Don't hesitate to ask any questions or share your opinions
XAUUSD (GOLD): Bullish Impulsive Move Up Friday! Wait For Buys!In this Weekly Market Forecast, we will analyze the Gold (XAUUSD) for the week of Aug 4 - 8th.
Gold is bullish on the Monthly, Neutral on the Weekly, Bullish on the Daily.
The aggressive move higher after bad job numbers caused a shift in the market from bearish to bullish on the D1 time frame.
Be wary of the pullback, as that move is likely to be corrected, but that would set up a great long opportunity!
Enjoy!
May profits be upon you.
Leave any questions or comments in the comment section.
I appreciate any feedback from my viewers!
Like and/or subscribe if you want more accurate analysis.
Thank you so much!
Disclaimer:
I do not provide personal investment advice and I am not a qualified licensed investment advisor.
All information found here, including any ideas, opinions, views, predictions, forecasts, commentaries, suggestions, expressed or implied herein, are for informational, entertainment or educational purposes only and should not be construed as personal investment advice. While the information provided is believed to be accurate, it may include errors or inaccuracies.
I will not and cannot be held liable for any actions you take as a result of anything you read here.
Conduct your own due diligence, or consult a licensed financial advisor or broker before making any and all investment decisions. Any investments, trades, speculations, or decisions made on the basis of any information found on this channel, expressed or implied herein, are committed at your own risk, financial or otherwise.

GBPUSD: The Bears Have it! Sell it!Welcome back to the Weekly Forex Forecast for the week of Aug 4 - 8th.
In this video, we will analyze the following FX market:
GBPUSD
Even against a weakened USD, the GBP is weaker.
July ended with an aggressive bearish candle. August may see more of the same.
Then there is talk of interest rate cuts coming.....
Enjoy!
May profits be upon you.
Leave any questions or comments in the comment section.
I appreciate any feedback from my viewers!
Like and/or subscribe if you want more accurate analysis.
Thank you so much!
Disclaimer:
I do not provide personal investment advice and I am not a qualified licensed investment advisor.
All information found here, including any ideas, opinions, views, predictions, forecasts, commentaries, suggestions, expressed or implied herein, are for informational, entertainment or educational purposes only and should not be construed as personal investment advice. While the information provided is believed to be accurate, it may include errors or inaccuracies.
I will not and cannot be held liable for any actions you take as a result of anything you read here.
Conduct your own due diligence, or consult a licensed financial advisor or broker before making any and all investment decisions. Any investments, trades, speculations, or decisions made on the basis of any information found on this channel, expressed or implied herein, are committed at your own risk, financial or otherwise.

ETH Looks Bearish (3D)Ethereum approached the weekly trendline and experienced a correction. It seems likely that we may see one more push upward to create a false bullish sentiment on this coin. There is even a possibility of a fake breakout above the descending trendline. However, before any major move, a significant correction toward the green zone appears likely | after which the main bullish move is expected to occur.
On higher timeframes, this is currently our outlook on Ethereum.
A daily candle closing above or below the invalidation levels would negate the current buy or sell bias.
For risk management, please don't forget stop loss and capital management
Comment if you have any questions
Thank You

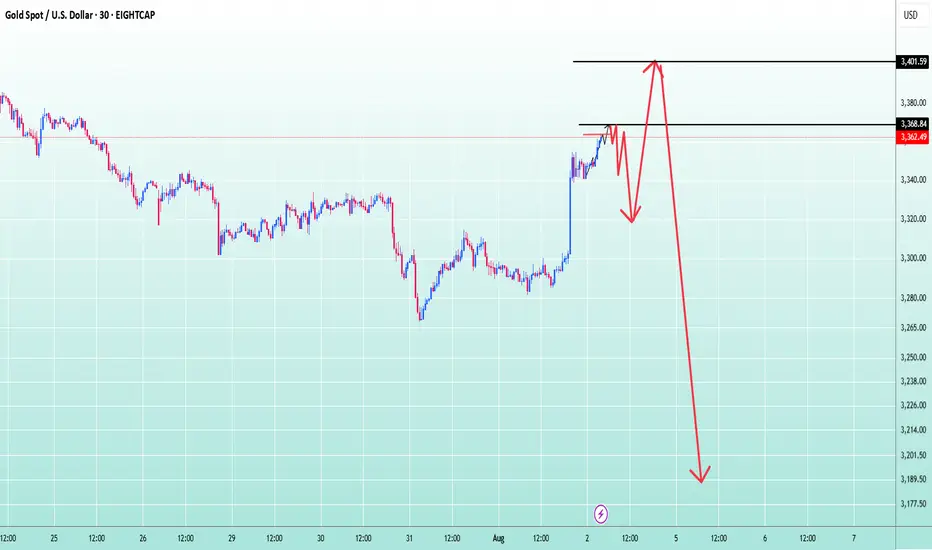
Gold trend analysis!From the price level of 3368 and above, gold is expected to pull back at least until the Stochastic on the M30–H1 timeframes reaches oversold levels.
After that, a bullish continuation is likely, pushing the price up to around 3400.
This area will be a critical decision point — determining whether the market will continue its uptrend or reverse into a downtrend.
If the H4 chart prints a reversal candlestick pattern, it would indicate the beginning of a bearish trend, which could potentially lead to a downward movement of up to 20,000 points.
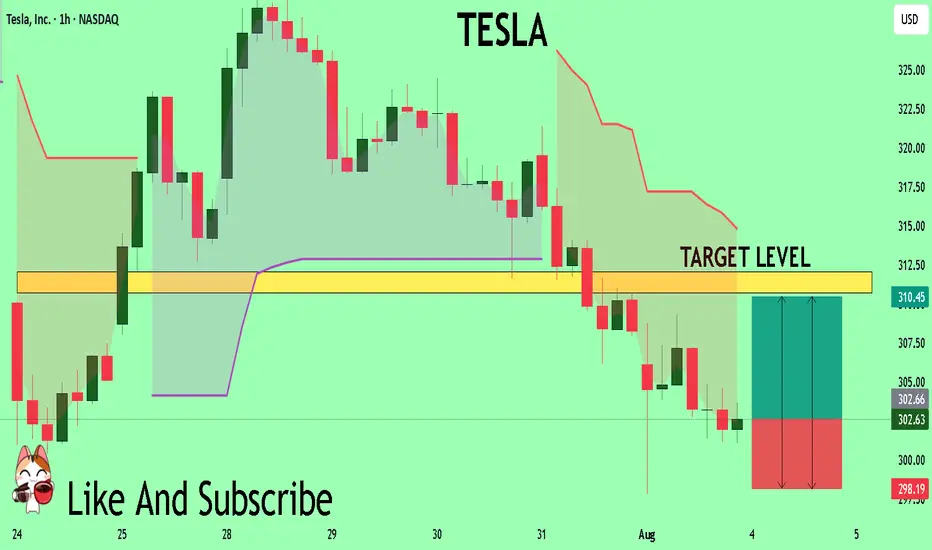
TESLA Sellers In Panic! BUY!
My dear friends,
TESLA looks like it will make a good move, and here are the details:
The market is trading on 302.63 pivot level.
Bias - Bullish
Technical Indicators: Supper Trend generates a clear long signal while Pivot Point HL is currently determining the overall Bullish trend of the market.
Goal - 310.73
Recommended Stop Loss - 298.19
About Used Indicators:
Pivot points are a great way to identify areas of support and resistance, but they work best when combined with other kinds of technical analysis
Disclosure: I am part of Trade Nation's Influencer program and receive a monthly fee for using their TradingView charts in my analysis.
———————————
WISH YOU ALL LUCK
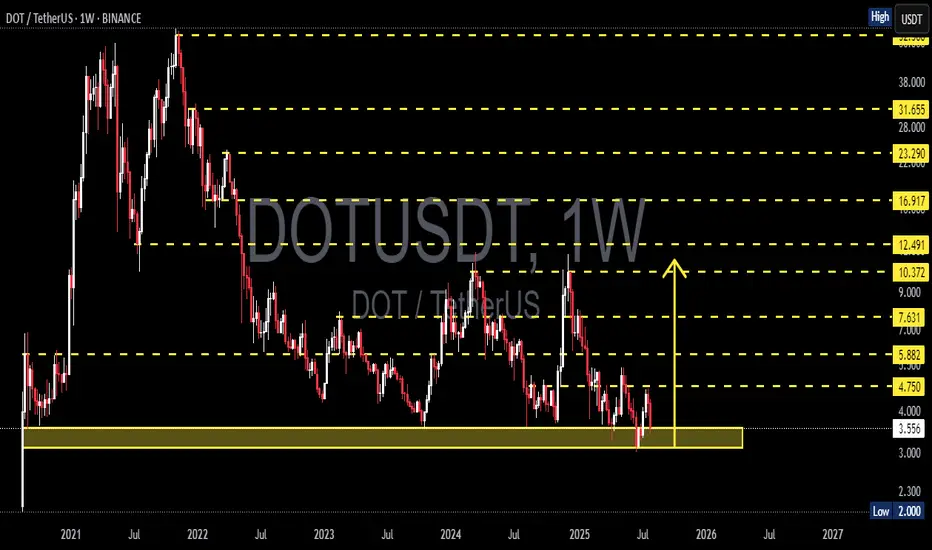
DOTUSDT On the Edge of a Major Rebound or a Devastating BreakdowPolkadot (DOT) is once again retesting one of its strongest macro support zones between $4.00 – $3.55, a historically significant demand area that has provided major price bounces since mid-2022.
This isn’t just a random level—it’s a critical accumulation base where large buyers have consistently shown interest. With price now hovering around this zone again, the next move could be decisive for DOT's mid- to long-term trend.
---
🔍 Price Structure & Key Patterns
Extended Accumulation Phase: DOT has been trading in a sideways range for over 80 weeks, indicating a potential bottoming structure forming after a prolonged downtrend.
Strong Historical Demand: The $4.00 – $3.55 region has acted as a key support multiple times since 2022, reinforcing its importance as a make-or-break zone.
Potential Trap Setup: Current price action could be forming either a bull trap or bear trap, depending on whether price rebounds or breaks down. Weekly candle confirmation will be key.
---
🟢 Bullish Scenario (Upside Reversal)
If price holds and prints a strong bullish candle (e.g., bullish engulfing or long-tailed hammer), expect the following upside targets:
Short-term: $4.75 – $5.88
Mid-term: $7.63 – $9.00
Long-term: $10.37 – $12.49, aligning with prior distribution zones
✅ A breakout from this long accumulation base could trigger a massive short squeeze and renewed buying momentum.
---
🔴 Bearish Scenario (Breakdown)
If DOT closes below $3.55 on the weekly chart:
Confirms breakdown from macro support
Opens downside risk toward $2.30 – $2.00
Would print a new lower low, extending the bear market phase and potentially triggering capitulation
⚠️ Speculative long positions should include tight risk management below $3.50.
---
🧠 Market Sentiment & Strategy
DOT appears to be in a "Capitulation meets Hope" phase—selling pressure is exhausting, but bullish conviction hasn't yet taken control.
Ideal entry zones lie within the current demand range, with tight stops.
Watch for a daily breakout or bullish momentum confirmation next week before committing to positions.
---
📌 Final Takeaway
> DOT is standing at the edge of a cliff—or a launchpad. The $3.55–$4.00 zone has repeatedly been the foundation for rebounds. If history repeats, this may be the beginning of a new uptrend. If not—brace for deeper downside.
⏳ The market is watching. Will DOT break out… or break down?
#DOTUSDT #Polkadot #CryptoTechnicalAnalysis #SupportResistance #CryptoRebound #BearishOrBullish #AltcoinOutlook #CryptoBreakdown #WeeklyChart #AccumulationZone #DOTAnalysis
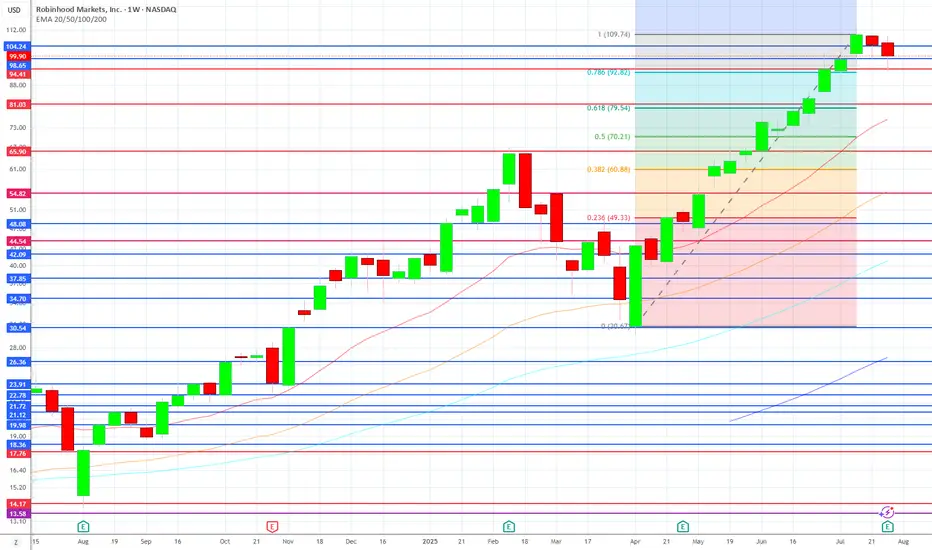
$HOODif the next couple of months get ugly my plan on NASDAQ:HOOD though nice bounce off support so far
EURUSD trading range. Top-bottom trading strategy✏️ OANDA:EURUSD surged after Nonfarm data. Formed a wide trading range bounded by 2 trendlines. The market needs more momentum to break out of the range. If there is confirmation at the upper and lower bands, it is a top-bottom trading signal for this pair.
📉 Key Levels
SELL trigger: reject resistance 1.175
BUY trigger: reject support 1.145
Leave your comments on the idea. I am happy to read your views.

#GBPUSD: Pullback Trade Confirmed?!📈GBPUSD rebounded from the highlighted key support level,
As a confirmation signal i observed a strong bullish Change of Character (CHoCH) on the 4-hour timeframe following its test.
The target is set at 1.3350.

XAUUSD – Bullish Reversal or Just a Deep Correction?Last week was a wild one for Gold.
After a quiet start and some choppy price action, the market dropped hard on Wednesday, breaking not only the 3300 key level but also the 3280 horizontal support — and what followed was anything but calm.
As expected after a strong move, the price pulled back to retest the broken support.
But Friday changed everything.
Instead of continuing down, Gold reversed sharply, fueled by weaker-than-expected NFP data. Price surged 800 pips from low to high, breaking above both the 3310 resistance zone and the weekly high around 3335.
________________________________________
🧭 Key Question:
Are we back in the bullish trend, or is this just a strong correction of the 3440 → 3270 drop?
Since May, Gold has lacked a clear trend — so a step-by-step trading approach is the most advisable to adopt.
________________________________________
🔍 Outlook:
Given the strength of the reversal and the break above two important resistance levels, my bias is bullish.
• 📌 Support: 3335 — a pullback into this zone could offer a buy opportunity in line with the recent momentum.
• 📌 Resistance: 3375 is the next key level to watch.
• ❌ Invalidation: A drop below 3310 would cancel the current bullish scenario.
🧠 Final Thoughts
Gold’s recent move challenges both bulls and bears.
Yes, the bounce was strong. Yes, key resistance levels broke.
But with no clear trend since May, chasing long term direction can be risky.
That’s why a step-by-step approach is the most advisable to adopt — let the market confirm each move before committing to the next.
For now, the breakout above 3310 and 3335 leans the bias to the upside.
However, staying reactive — not being stuck with an idea — is the smartest approach.
Disclosure: I am part of TradeNation's Influencer program and receive a monthly fee for using their TradingView charts in my analyses and educational articles.
