Community ideas
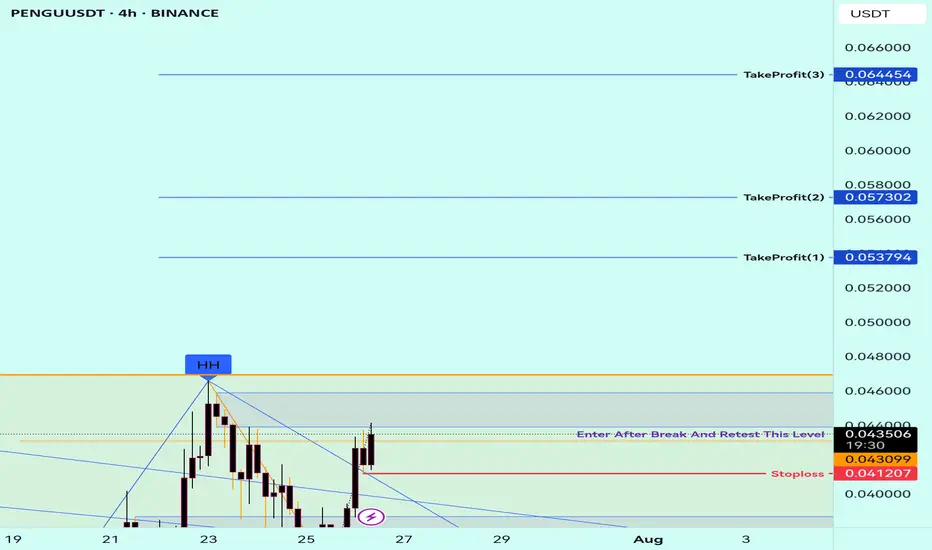
Buy Trade Strategy for PENGU: Betting on Meme Power and CommunitDescription:
This trading idea highlights PENGU, an emerging meme-based cryptocurrency that has gained popularity through its strong community support and viral potential. Inspired by internet culture, PENGU represents more than just humor — it taps into the growing trend of community-driven tokens that generate momentum through engagement, social media buzz, and grassroots marketing. With a limited supply and increasing visibility across platforms, PENGU positions itself within a niche market where speculation, culture, and community collide.
While meme coins like PENGU can offer explosive short-term potential, they also carry high levels of risk due to their dependence on community sentiment and lack of traditional utility or fundamentals. Market dynamics can shift rapidly, and what gains popularity quickly may also fade just as fast. Therefore, any investment in PENGU should be approached with caution.
Disclaimer:
This trading idea is for educational purposes only and does not constitute financial advice. Investing in cryptocurrencies, especially meme tokens like PENGU, involves significant risk, including the potential loss of all invested capital. Always conduct thorough research, understand the speculative nature of such assets, and consult a financial advisor before making any trading decisions. Past performance is not indicative of future results.
Vicusdt buy opportunityVICUSDT broke out of a falling wedge but encountered strong resistance at the supply zone, leading to a pullback for a potential retest of the wedge structure. The plan is to re-accumulate within the highlighted zone and monitor price action as it progresses toward the outlined targets on the chart.

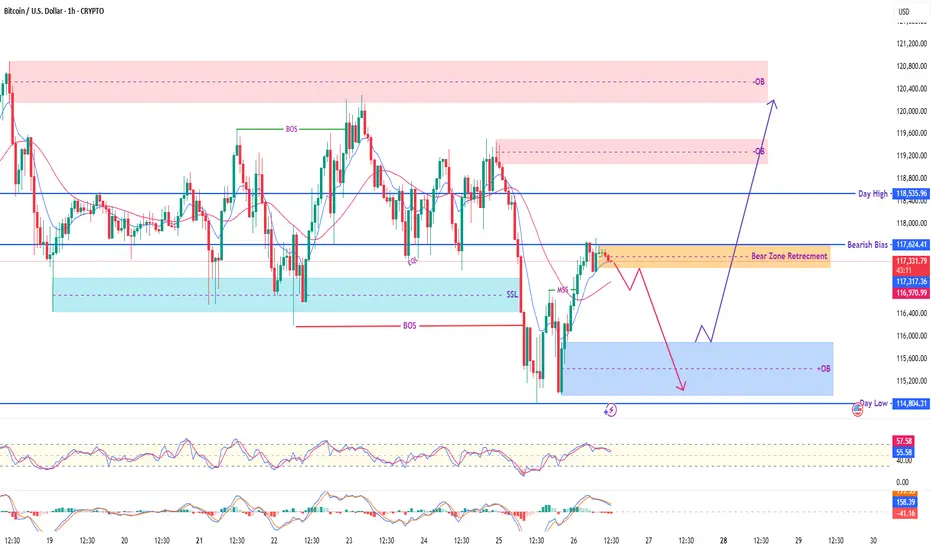
BTC/USD - Bitcoin's Crucial Levels & Potential Reversal Zones! What's up, TradingView fam! 👋 Here's a fresh 1-hour chart analysis for Bitcoin (BTC/USD), highlighting key price action and potential scenarios as the market navigates a critical zone.
Current Market Snapshot:
Price Retracement: BTC is currently in a 'Bear Zone Retracement' phase, hovering around $117,300 - $117,400. This suggests a pullback within a broader bearish move.
Bearish Bias 🐻: Our analysis indicates a prevailing 'Bearish Bias' in the short-term, meaning we're looking for potential selling opportunities or further downside.
Day High & Day Low: Key reference points are the 'Day High' at $118,505 and the 'Day Low' at $114,804.
Key Zones & Liquidity Pools:
Upper Order Block (Red OB) 🔴: A significant supply zone overhead, from $119,000 to $120,500. This area could offer strong resistance if price attempts to move higher.
Current Retracement Zone (Yellow Highlight) 📉: This is our 'Bear Zone Retracement' area around $117,200 - $117,500. This zone previously acted as support and could now flip to resistance, signaling a continuation of the bearish trend.
Lower Order Block (Blue OB) 🔵: A potential demand zone below, roughly $115,000 - $115,700. If price pushes lower, this could be an area for a bounce or temporary support.
SSL (Sell Side Liquidity) 🎯: Notice the sweep of 'Sell Side Liquidity' (SSL) around $116,500 recently. This liquidity grab often precedes a move in the opposite direction or a deeper pullback before continuation.
Potential Scenarios (Follow the Purple Arrows! 🔮):
Bearish Continuation (Most Likely Scenario) ⬇️: Given the 'Bearish Bias' and the current retracement into the 'Bear Zone', we could see rejection from current levels or a slight push higher to retest the upper part of this zone. From there, price might head down towards the Lower Order Block ($115,000 - $115,700), potentially retesting the 'Day Low' at $114,804.
Bullish Reversal (Less Likely, but Possible) ⬆️: A less probable but possible scenario involves price breaking above the current 'Bear Zone Retracement' and pushing higher. If it can clear the 'Day High' at $118,505, it might target the Upper Order Block ($119,000 - $120,500). This would invalidate the short-term bearish bias.
Indicators Check:
RSI: Currently around 57, showing a slight recovery but still with room to move.
Stochastic: Trending downwards, supporting the bearish momentum.
Always remember to trade smart, manage your risk, and wait for confirmation. This is not financial advice. Do your own research! 🛡️📊
Don't forget to Like 👍, Comment 💬, and Follow for more detailed analyses!
#BTC #Bitcoin #Crypto #Trading #TechnicalAnalysis #SmartMoneyConcepts #PriceAction #BTCUSD #MarketAnalysis"
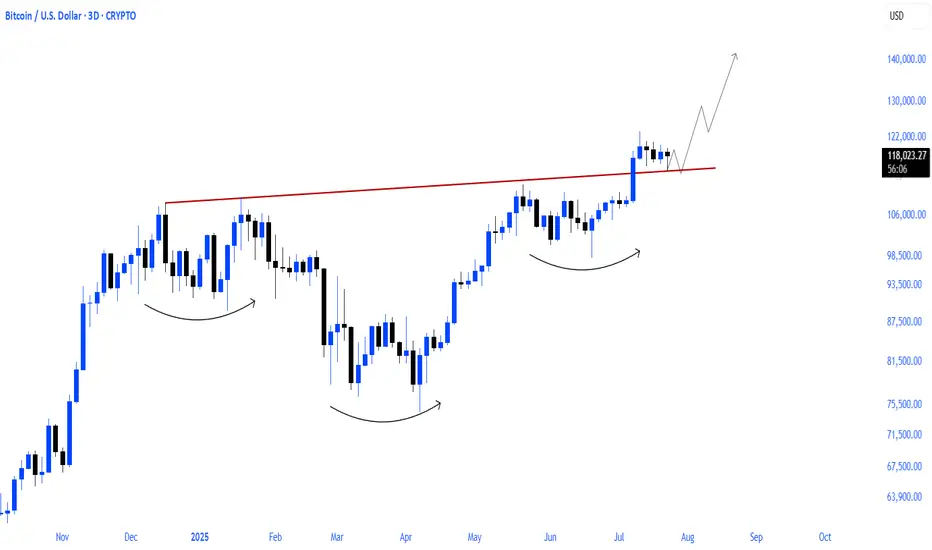
$BTC NEXT WAVE PROGRAMMED!bitcoin will load the next wave after the accumulation process it is in after the parabolic run
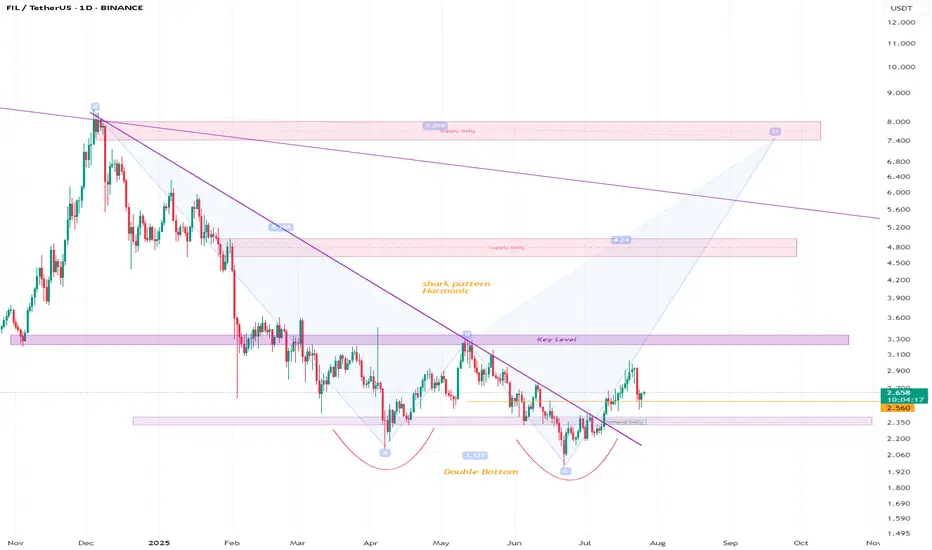
filusdtHello friends, I think Filecoin has a shark pattern and a classic twin bottom. I think it can grow well if important resistance levels are broken (good luck). Check it out for yourself.
BTC/USD – 1H Smart Money Outlook | Sunday Preparation🔹 Current Price: $118,311
🔹 Day Range: High – $118,311 | Low – $117,137
🔹 Bias: Bullish unless daily low breaks
🔎 Smart Money Framework:
✅ Market Structure Shift (MSS) and Break of Structure (BOS) confirmed
✅ Price holding above Equal Lows (EQL) and retesting BOS zone
📍 OB (Order Block) above acting as major liquidity target
🔽 Multiple bullish mitigation zones:
🔹 Bullish Bias Zone
🔹 RBS (Resistance Become Support)
🔹 Bull Golden Zone
🔹 POI near SSL (Sell Side Liquidity) – ideal for deep discount buys
🧠 Scenario Mapping:
🔺 Direct Rally from current BOS retest → OB sweep
🔽 Pullback to RBS / Bullish Bias → then continuation to OB
🔻 Deeper pullback into Golden Zone / POI for premium entry
❌ Break below SSL invalidates bullish setup
🔧 Indicators:
RSI: Hovering around 65 – showing strength
MACD: Bullish momentum building gradually
EMAs: Price staying above short-term MA – trend supportive
📌 Summary:
BTC structure favors upside with multiple strong bullish setups forming. Only a clean break of daily low and POI invalidates the long bias. Smart money likely to hunt liquidity above OB. Ideal for scalpers and intraday positional setups.

BTCUSD SELL from order block down trend trade with sl tp ,,,,,smart money concept with price action ...,,,,,,,,,,,,,,,,,,,,,,,,,,,,,,,,,,,,,,,,,,,,,,,,,,,,,,,,,,,,,,,,,,,,,,,,,,

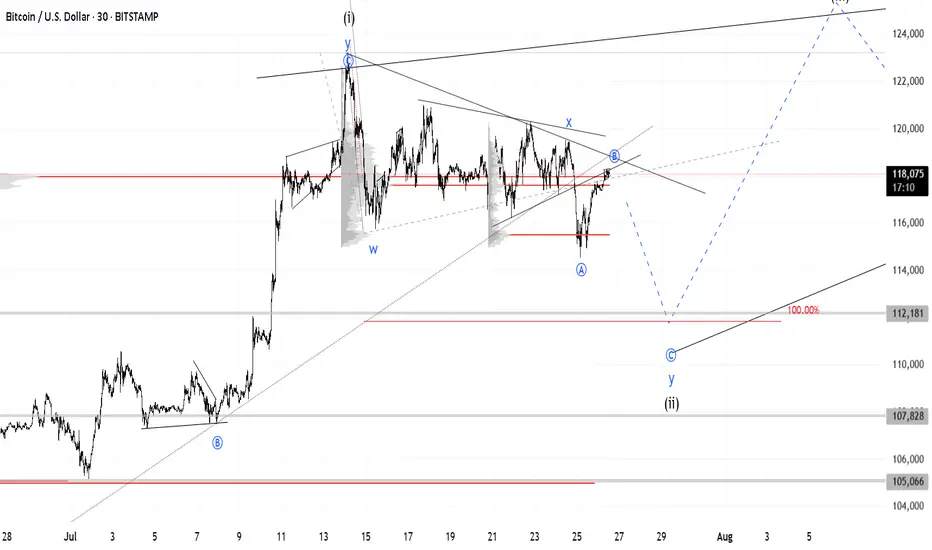
BTC at Multi-Factor Resistance: Wave Count Hints at Downside BTC is looking increasingly bearish as the price has risen to a resistance zone formed by multiple factors: trendlines, the POC (Point of Control), and moving averages.
The wave count also supports this bearish outlook / the bearish case.
Bitcoin Long: Completion of Sub-wave 4, riding wave 5I updated the Elliott Wave counts for Bitcoin and we should have completed sub-wave 4 and is currently onto sub-wave 5. Based on my counts, sub-wave 3 has extended and is slightly more than 1.618x of wave 1, thus I expect sub-wave 5 to NOT extend. Based on Fibonacci extensions, the price target is around $124,600.
The stop loss for this idea is around $114,600.
Towards to end of the video, I zoomed out for Bitcoin and observed that Cycle level wave 1 and 3 are HUGE (red font) and the current Cycle Wave 5 looks too small. Thus, the entire 5-wave structure of what we are going through now may be just a Sub-Wave 1 of Cycle Wave 5. And that means that longer-term, Bitcoin may really go to $200,000 and beyond. But for traders, keep our foot on the ground and trade what is in front of us.
Good luck!

US500 (S&P): Trend in daily time frameThe color levels are very accurate levels of support and resistance in different time frames, and we have to wait for their reaction in these areas.
So, Please pay special attention to the very accurate trends, colored levels,
and you must know that SETUP is very sensitive.
Be careful
BEST
MT


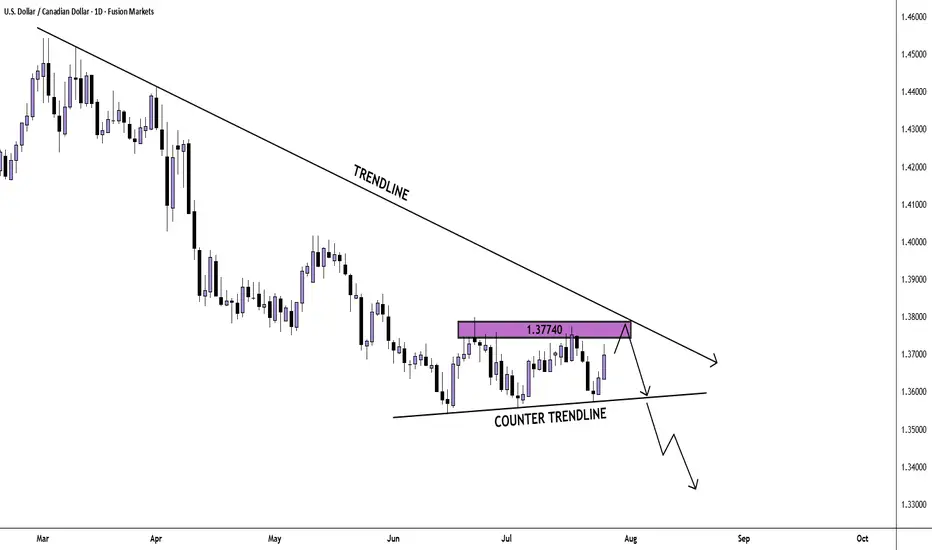
USD/CAD Daily Chart AnalysisFrom the bigger picture we see that sellers are dominating the market. Currently, price looks to be in a correction phase and twice has found resistance at the 1.37740 price point.
If price finds resistance there again, we may see a breakout and another bearish impulse.
If you agree with this analysis, look for a trade that meets your strategy rules.
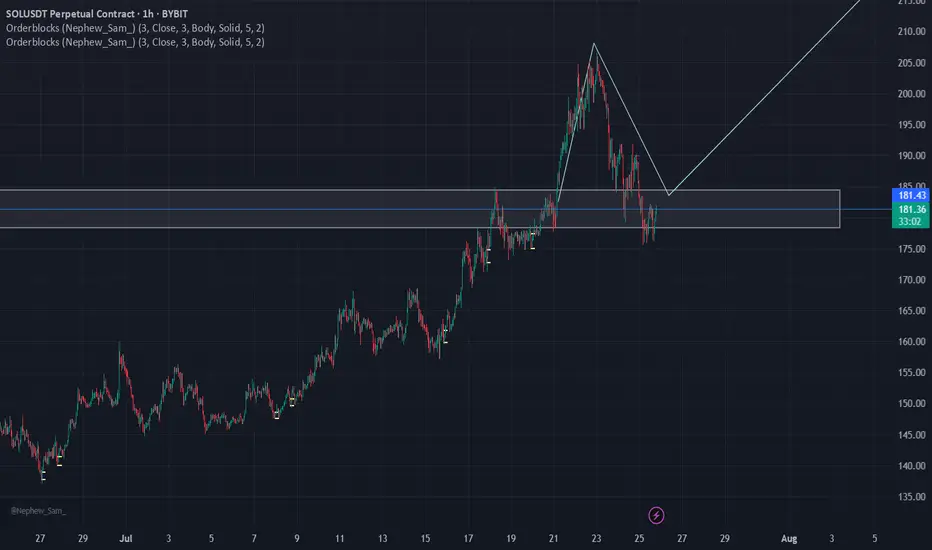
Just like #AKRM, #SOL can also pump 100%Just like #AKRM, #SOL can also pump 100%..
SOL will also have this kind of exit rally. Whether there is a war between the US, Iran, and Israel or not, the market will crash very badly.

Very Bullish!!
Solana chart looks very bullish. The price is currently dropping but I think it is a very healthy correction.
Weekly chart:
1) all momentum indicators just entered the bull zone.
2) The chart is forming higher highs.
Daily:
1) EMA55 finally crossed EMA200. The last time they crossed was October 2023 (see red vertical line in the chart) and it was the beginning of the macro bull trend.
2) Momentum indicators have reached overbought territory and crossed to the downside, however, given weekly momentum indicators have just entered the bull zone, this move is likely to be corrective action.
3) When EMA55 and EMA200 cross, the price often retraces initially to EMAs (21, 55 or 200). Once it completes the pull back, I anticipate the price to move to the previous ATH and beyond.
This is the time when high leverage trading volume increases.
Be careful not get wicked out. Focus on monthly/weekly/daily charts and ignore the noise in the lower timeframes.

Shriram Finance on Radar ! Bullish Setup !This is the daily chart of SHRIRAMFIN.
SHRIRAMFIN having a good law of polarity near at 580-600.
if this level is sustain then we may see higher prices in SHRIRAMFIN.
Thank You !!

Jasmyusdt Buy opportunityJASMYUSDT is displaying a strong cup and handle formation, presenting a good accumulation opportunity within the highlighted zone. The provided targets on the chart align with the coin’s potential, making it a worthwhile hold.
Previous analysis, which identified an Adam and Eve pattern, played out successfully.
The current strategy is to hold for at least 4 months, observing how the market develops.

pull back of HK50 1. bearish BOS
2. after the bearish breakout retest did not go back to the last breakout momentum.
3. tend to sell around 25417 and TP 25212

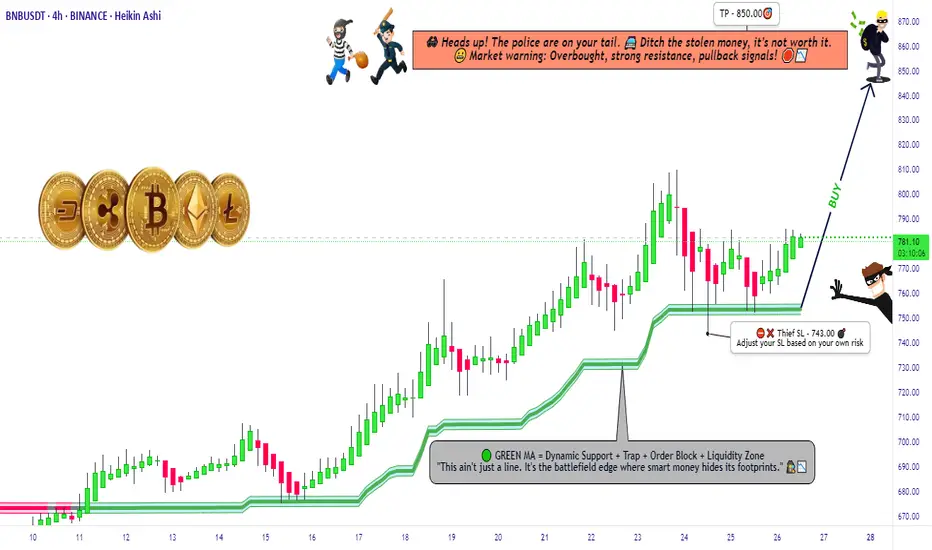
"BNB Primed for a Pump – Thief Trading Mode Activated!"🚨 BNB/USDT HEIST PLAN – SWIPE THE BULLISH LOOT BEFORE COPS ARRIVE! 🚨
🌟 Attention, Money Makers & Market Robbers! 🌟
(Hola! Oi! Bonjour! Hallo! Marhaba!)
The BNB/USDT vault is CRACKED OPEN—time to execute the ultimate heist! 🏦💰 Based on 🔥Thief Trading Style Analysis🔥, here’s your lucrative robbery blueprint for the Binance Coin vs. Tether market.
🔐 MASTER PLAN: LONG ENTRY HEIST (HIGH-RISK, HIGH-REWARD)
🎯 TARGET: 850.00 (or escape before the cops show up!)
🚨 POLICE TRAP ZONE: Overbought + Strong Resistance – Bears & cops are lurking!
💎 TAKE PROFIT EARLY & TREAT YOURSELF! (You’ve earned it, outlaw!)
⚔️ ENTRY STRATEGY: SWIPE FAST OR WAIT FOR THE PULLBACK!
🤑 VAULT IS OPEN! Enter any price if you’re bold (instant long).
🕵️♂️ SMART THIEVES: Use buy limit orders near 15M/30M swing lows/highs for a safer heist.
🛑 STOP-LOSS (ESCAPE ROUTE)
Thief SL: 743.00 (4H candle wick – adjust based on your risk tolerance!)
⚠️ WARNING: If the cops (bears) break in, DON’T HESITATE—RUN!
🎯 TARGETS & ESCAPE PATHS
Scalpers: Trail your SL & escape with quick loot! (Only long-side allowed!)
Swing Bandits: Hold strong but watch for police traps!
📡 MARKET INTEL (WHY THIS HEIST WILL WORK)
Bullish momentum in play! (But stay sharp—consolidation & reversals possible.)
Fundamentals, COT Reports, On-Chain Data, & Sentiment all hint at more upside!
🚨 TRADING ALERTS – DON’T GET CAUGHT!
📰 NEWS = VOLATILITY! Avoid new trades during major releases.
🔒 LOCK PROFITS! Use trailing stops to protect your stolen gains.
💥 BOOST THIS HEIST – STRENGTHEN THE SQUAD! 💥
🔥 Hit the LIKE & FOLLOW to support the robbery team!
🚀 More heists coming soon—STAY TUNED, OUTLAWS! 🚀
🎯 Trade Smart. Steal Big. Escape Faster. 🏴☠️
Opened longI opened a long position.
Ideally it is safe to wait for EMAs to line up for the bull trend (EMA21 > 55> 200) in the Daily chart. However, there are many indications that the price will start to move to the upside and the upside move might be quite aggressive. So I decided to open a long position with a small position size.
The reasons for opening a long position:
Daily:
Bull candle has closed above EMA21 for a few times.
RSI lines have crossed and entered the bull zone.
MACD lines are about to enter the bull zone.
Stochastic lines are above to cross and move up.
The price has been staying above Fib 0.236 level for about 10 days.
The price has broke and closed above the descending parallel channel.
4H:
All momentum indicators are in the bull zone.
EMA21 is above EMA 55.
The price has closed above EMA200.
The price is consolidating above the top descending parallel channel.
It is not the perfect bull trend set up, however, there are enough confluences for the price to start to move to the upside.
Entry price: $142.59 (blue horizontal line in 4H chart)
Stop Loss: $130.40 (red horizontal line in 4H chart)
Target: $195 (green horizontal line: Fib 0.5 level in Daily chart and fair value gap zone)
$178 is a strong support and resistance area, so if it starts to stall, I might take a partial profit.
Fingers crossed.

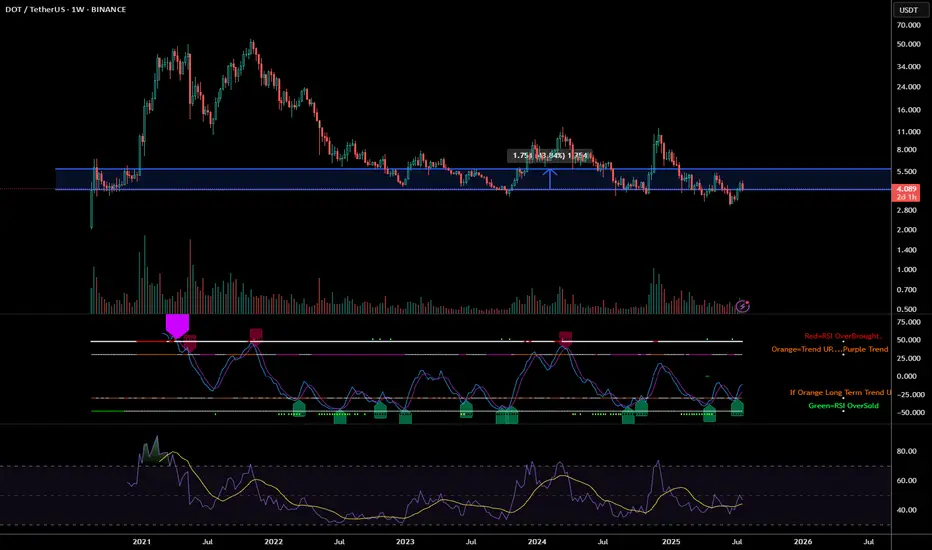
Polkadot (DOT) Technical Analysis: Navigating the Path Forward Polkadot (DOT) is currently trading at approximately $4.08 (as of July 25, 2025), having experienced significant volatility in recent months. After reaching a local high of $7.64 in mid-April 2025, DOT has undergone a substantial correction, losing approximately 46% of its value. This analysis examines DOT's technical position and potential trajectory for the remainder of 2025.
Price Structure Analysis
The daily chart reveals DOT has been in a defined downtrend since April 2025, characterized by a series of lower highs and lower lows. Most recently, price has established a trading range between $3.90-$4.30, suggesting potential stabilization after the steep decline. This consolidation zone represents a critical juncture for DOT's next directional move.
Key observations from the price structure:
Descending Channel Formation: DOT has been trading within a descending channel since April, with the upper boundary currently around $4.50 and lower boundary near $3.80.
Support Cluster: Multiple support tests in the $3.90-$4.00 region have held thus far, potentially forming a base for a recovery attempt.
Volume Profile: Trading volume has been notably higher during recent consolidation compared to previous months, suggesting increased interest at these price levels.
RSI Analysis: Signs of Potential Reversal
The Relative Strength Index (RSI) provides compelling evidence for a potential trend shift:
Bullish Divergence: While price made lower lows in late June and early July, the RSI formed higher lows, creating a bullish divergence pattern that often precedes reversals.
Oversold Recovery: The RSI reached oversold territory (below 30) in mid-June and has since recovered to the 40-45 range, indicating diminishing selling pressure.
RSI-based MA Crossover: The RSI has recently crossed above its moving average, a signal that has historically preceded price recoveries for DOT.
The 4-hour chart shows the RSI establishing a series of higher lows while price consolidates, suggesting building momentum beneath the surface despite sideways price action.
Support/Resistance Level Analysis
Critical price levels that will influence DOT's next directional move:
Support Zones:
Primary: $3.90-$4.00 (current consolidation floor)
Secondary: $3.60-$3.70 (previous support from May)
Tertiary: $3.30-$3.40 (major support from early 2025)
Resistance Zones:
Immediate: $4.30-$4.50 (upper boundary of current consolidation)
Major: $4.80-$5.00 (previous support turned resistance)
Structural: $5.70-$6.00 (descending trendline from April high)
Volume Analysis
Volume patterns provide additional context for DOT's current position:
Declining Sell Volume: Selling volume has progressively decreased during the recent consolidation phase, suggesting exhaustion of selling pressure.
Volume Spikes on Bounces: Recent upward price movements have been accompanied by above-average volume, indicating potential accumulation.
Volume Contraction: The overall contraction in trading volume during the recent range-bound price action typically precedes significant moves.
Market Structure Analysis
Examining DOT's market structure reveals several important patterns:
Potential Inverse Head & Shoulders: The recent price action is forming what could develop into an inverse head and shoulders pattern, with the neckline around $4.50. Completion of this pattern would project a move toward $5.20-$5.40.
Wyckoff Accumulation: The price action since mid-June displays characteristics consistent with Wyckoff accumulation, including:
Spring phase (drop to $3.59 in late June)
Test phase (retest of lows in early July)
Sign of strength (move toward $4.20 on increased volume)
Compression Pattern: Price volatility has been decreasing, forming a compression pattern that typically resolves in a strong directional move.
Moving Average Analysis
Moving averages confirm DOT's bearish positioning but show early signs of potential trend change:
Below Key MAs: DOT remains below all major moving averages (50, 100, and 200-day), confirming the bearish trend.
MA Compression: The gap between shorter and longer-term moving averages is narrowing, often a precursor to trend shifts.
RSI-based MA Crossover: While price MAs remain bearish, the RSI-based moving average has turned upward, often an early indicator of trend reversal.
Fibonacci Retracement Analysis
Using the move from the April high ($7.64) to the June low ($3.59):
23.6% Retracement: $4.54 (immediate target on breakout)
38.2% Retracement: $5.13 (medium-term target)
50% Retracement: $5.62 (significant resistance level)
61.8% Retracement: $6.10 (major resistance level)
The current price action suggests DOT is attempting to establish a base before potentially targeting these retracement levels.
Scenario Analysis
Bullish Scenario
If DOT can decisively break above the $4.50 resistance level with increased volume:
Initial Target: $4.80-$5.00 (previous support turned resistance)
Secondary Target: $5.50-$5.70 (50% retracement level)
Extended Target: $6.00-$6.30 (61.8% retracement and structural resistance)
Catalysts: Successful parachain upgrades, increased developer activity, or broader crypto market recovery could drive this scenario.
Bearish Scenario
If DOT breaks below the $3.90 support level:
Initial Target: $3.60-$3.70 (previous support)
Secondary Target: $3.30-$3.40 (major support level)
Extended Target: $3.00 (psychological support)
Catalysts: Continued weakness in the broader crypto market, technical issues with the Polkadot network, or regulatory concerns could trigger this scenario.
Most Probable Scenario
Based on the weight of technical evidence, the most probable scenario appears to be:
Continued consolidation between $3.90-$4.50 for the next 1-2 weeks
Eventual breakout above $4.50 targeting the $5.00 level
Establishment of a new trading range between $4.50-$5.50 through August-September
This scenario is supported by the bullish divergences, decreasing selling volume, and early signs of accumulation.
Trading Strategy Recommendations
For Long-Term Investors
Accumulation Strategy: Consider dollar-cost averaging in the current $3.90-$4.20 range
Position Sizing: Maintain appropriate position sizing given DOT's high volatility
Key Levels: Use the $3.60 level as a stop-loss for new positions
For Active Traders
Range-Bound Strategy: Trade the current range between $3.90-$4.30 until a breakout occurs
Breakout Strategy: Enter on confirmation of breakout above $4.50 with targets at $4.80, $5.20, and $5.70
Risk Management: Maintain tight stops below $4.30 on breakout trades to protect against false breakouts
For Risk-Averse Investors
Confirmation Approach: Wait for confirmation of trend reversal (price above $4.80 and 50-day MA)
Partial Position: Consider establishing partial positions at current levels with defined risk parameters
Technical Triggers: Look for RSI moves above 60 as confirmation of momentum shift
Conclusion: Cautious Optimism for DOT
The technical picture for Polkadot suggests we may be approaching an inflection point after the substantial correction from April highs. Multiple technical indicators point to diminishing selling pressure and early signs of accumulation, creating the conditions for a potential recovery.
While DOT remains in a technical downtrend, the convergence of bullish divergences, volume patterns, and market structure suggests the potential for a trend reversal in the coming weeks. The $4.50 level represents the key technical hurdle that must be overcome to confirm this shift.
For investors and traders, a balanced approach is warranted—acknowledging the current bearish trend while positioning for a potential reversal. The risk-reward profile appears increasingly favorable for cautious accumulation at current levels, with clearly defined risk parameters.
The most probable path forward appears to be continued consolidation followed by a gradual recovery toward the $5.00-$5.50 range by late Q3 2025, contingent upon broader market conditions and continued development progress within the Polkadot ecosystem.
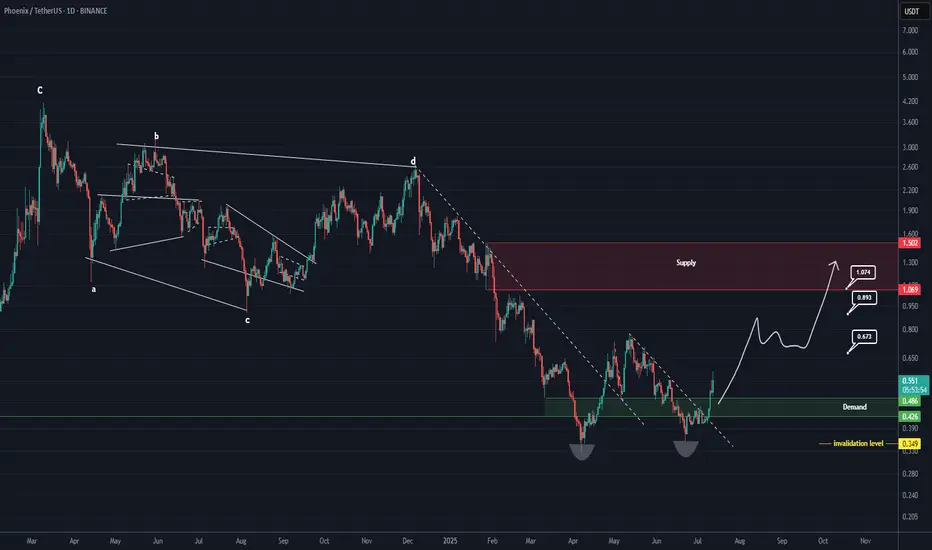
PHB Looks Bullish (1D)It appears that wave E has ended after a long consolidation and the formation of a double bottom. A key trigger line has been broken, and the price has reclaimed the flip zone (marked in green).
As long as the green zone holds, the price can move toward the targets and the red box.
The targets are marked on the chart.
A daily candle closing below the invalidation level will invalidate this analysis.
For risk management, please don't forget stop loss and capital management
Comment if you have any questions
Thank You
GOLD 1H CHART ROUTE MAP UPDATEHey Everyone,
Great finish to the week with our chart ideas playing out, as analysed.
We completed all our Bullish targets on this chart with ema5 cross and lock confirmation. We were also able to step away today after the final target with no further ema5 cross and lock, confirming the rejection that we are seeing now.
BULLISH TARGET
3356 - DONE
EMA5 CROSS AND LOCK ABOVE 3356 WILL OPEN THE FOLLOWING BULLISH TARGETS
3381 - DONE
EMA5 CROSS AND LOCK ABOVE 3381 WILL OPEN THE FOLLOWING BULLISH TARGET
3404 - DONE
EMA5 CROSS AND LOCK ABOVE 3404 WILL OPEN THE FOLLOWING BULLISH TARGET
3424 - DONE
EMA5 CROSS AND LOCK ABOVE 3424 WILL OPEN THE FOLLOWING BULLISH TARGET
3439 - DONE
We will now come back Sunday with a full multi timeframe analysis to prepare for next week’s setups, including updated views on the higher timeframes, EMA alignments, and structure expectations going forward.
Thanks again for all your likes, comments, and follows.
Wishing you all a fantastic weekend!!
Mr Gold
GoldViewFX
