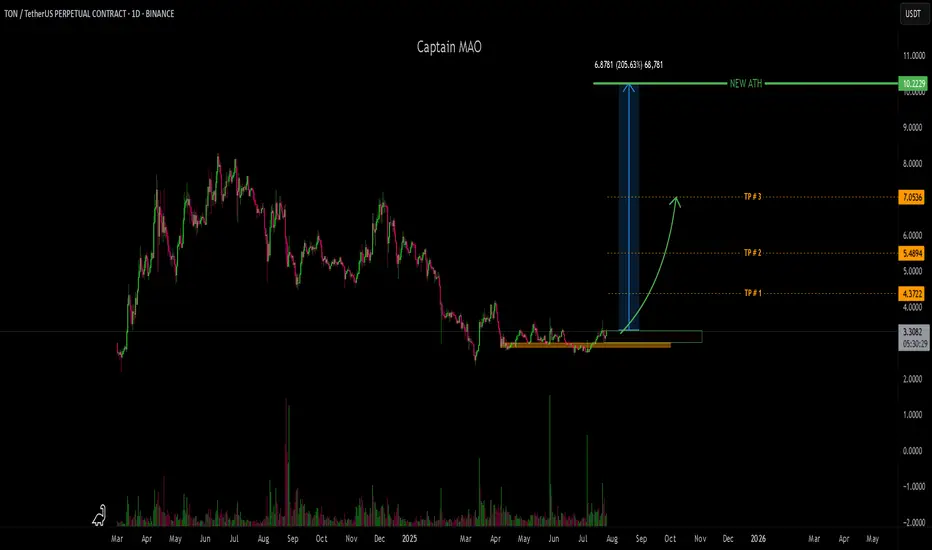
TON/USDT - ATH !!!TON/USDT has been in a sideways consolidation phase for over 100 days, tightly ranging between the $2.90–$3.50 zone. This prolonged accumulation is forming a solid base structure, often seen before major trend reversals in high-cap altcoins.
Recent price action is beginning to show early signs of bullish momentum, with buyers gradually stepping in and volume starting to rise. This area is historically significant and marks a high-probability entry zone, especially if the market confirms the breakout.
Community ideas
Unmasking the 5-0 Harmonic Pattern
---
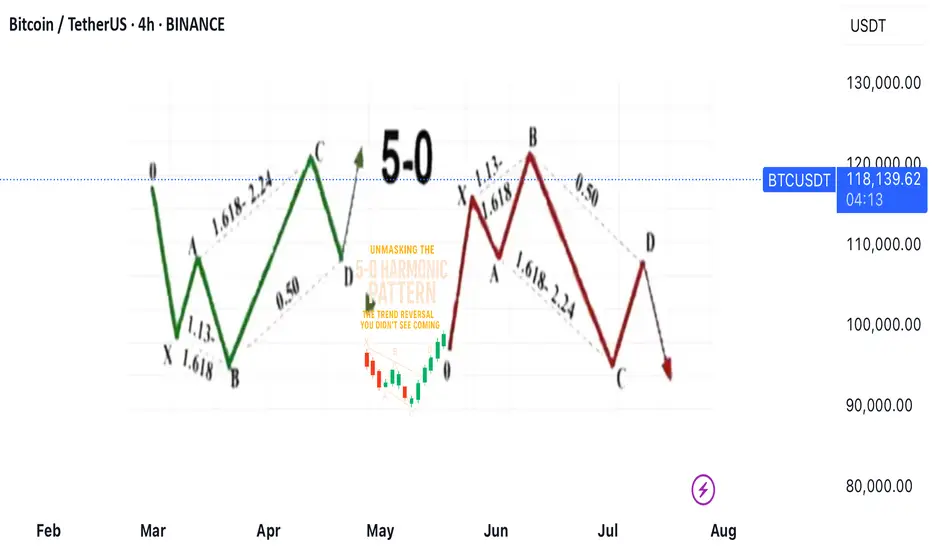
🎯 **Unmasking the 5-0 Harmonic Pattern: The Trend Reversal You Didn't See Coming**
Discovered by the visionary Scott Carney and unveiled in _Harmonic Trading, Volume Two_, the **5-0 pattern** isn't just another blip on a trader’s radar—it’s a siren of market reversal.
📈 **Why It Stands Out**
- Unlike the familiar Bat or Gartley structures, the 5-0 pattern is fueled by **precise Fibonacci ratios**, making its reversal zone deadly accurate.
- Centered around the pivotal **Point B**, this model doesn’t just hint at change—it defines it.
🌀 **The Anatomy of a Flip**
- Often marking the **first true pullback in a major trend reversal**, the 5-0 isn’t a lagging indicator—it’s your early warning system.
- The **AB leg?** That’s no ordinary wave—it’s usually the final gasp of a fading trend, setting the stage for powerful new momentum.
💥 **Bottom Line**
This isn’t just technical analysis—it’s strategic foresight. The 5-0 pattern reveals where the market **hesitates... and where you strike**.
---
_"To truly learn, we must see it in action.
So let’s pull back the curtain and share a powerful example from our **past insurance market trades**—a deal that blended precision, timing, and strategy.
In comments
BTCUSD BUBBLE ABOUT TO BURST LOL ??? SELL SELL SELLLong term BTCUSD looks like BIG PLAYERS ARE TAKING PROFIT (about to dump this to retailers lol)
I see 15m signal sell with very good risk reward
BTCUSD its ready for correction i dont beleave we will see any NEW HIGHS from here
Let see how will pay out, only time will tell
Thanks

XAGUSD SILVER ON 3OTH we are expecting a strong fundamental data .
ADP Non-Farm Employment Change forecast 82K previous -33K
Advance GDP q/q forecast 2.4% previous -0.5% Advance GDP Price Index q/q forecast 2.3% previous 3.8%
Pending Home Sales m/m0.3% 1.8%
7:00pm
USD
Federal Funds Rate
4.50% 4.50%
USD
FOMC Statement
7:30pm
USD
FOMC Press Conference.
we will be watching the data outlook for clear directional bias.

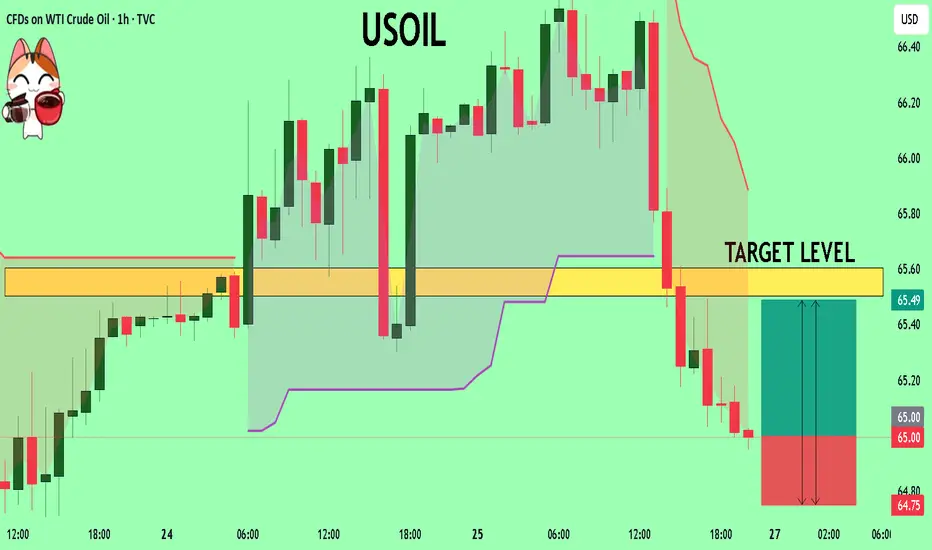
USOIL My Opinion! BUY!
My dear friends,
Please, find my technical outlook for USOIL below:
The instrument tests an important psychological level 65.00
Bias - Bullish
Technical Indicators: Supper Trend gives a precise Bullish signal, while Pivot Point HL predicts price changes and potential reversals in the market.
Target - 65.50
Recommended Stop Loss - 64.75
About Used Indicators:
Super-trend indicator is more useful in trending markets where there are clear uptrends and downtrends in price.
Disclosure: I am part of Trade Nation's Influencer program and receive a monthly fee for using their TradingView charts in my analysis.
———————————
WISH YOU ALL LUCK
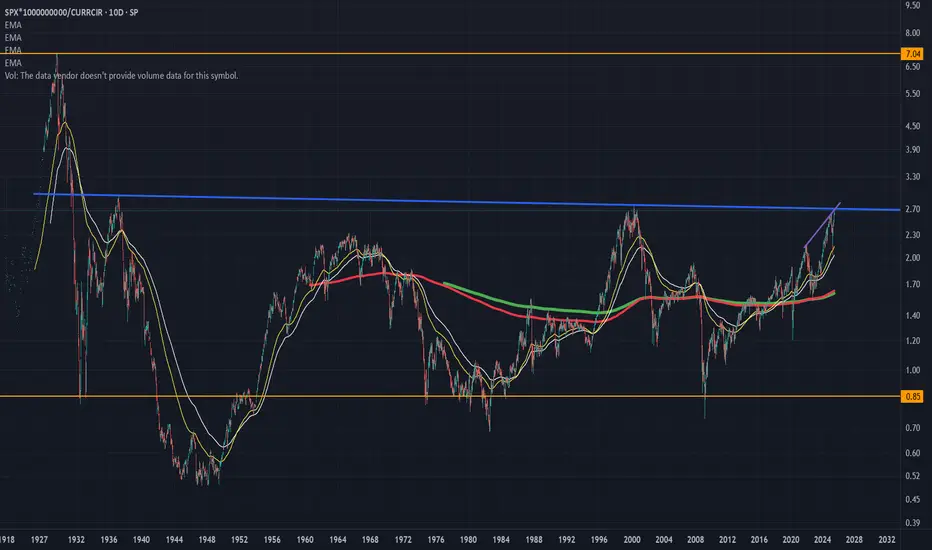
Entire S and P history in one chart. Approaching a neck-snapper!Here is a chart of the entire S and P history versus total currency in circulation.
This gives bubble periods (anytime the value is over 2) and times when the market crashed after being in a bubble.
If you notice we are fast approaching the line that broke the neck of the market in the 60s and 2000 dotcom bust.
If we clear that line, hold on to your hats because we are going into full blown speculative mania like just before the Great Depression!
In fact maybe the AI-crypto bubble will be exactly like the Great Depression, AI causing mass unemployment and global poverty.
EXPECTATION THAT BTC WILL FALL IS VERY HIGHThe area im looking to sell BINANCE:BTCUSDT.P from is a very strong resistance that would be very difficult for mr BITCOIN to pass through, so therefore, im expecting BTC to reject from there and fall to the down side. Sell BTC

Huge breakout in Union Bank
After it's Q1 results Union bank is trading near it's previous breakout level, and is ready for a huge upside from here.
If we look at the past trends of Union Bank ( See below Images )
We can clearly see after a correction of about 40 to 50%, share rises with a huge breakout and it always rises for more than 100%.
Whoever missed the opportunity at first, this is the best to get into the stock for a potential profit target of 250.

CHECK ETHUSDT SIGNAL UPDATE GOAND READ CAPTAINEntry Point: Around 3766.00 TO 3740.00
Take Profit 1: 3655.00
Take Profit 2: 3512.00
Last Target: 3368.00
Stop Loss: 3885.00

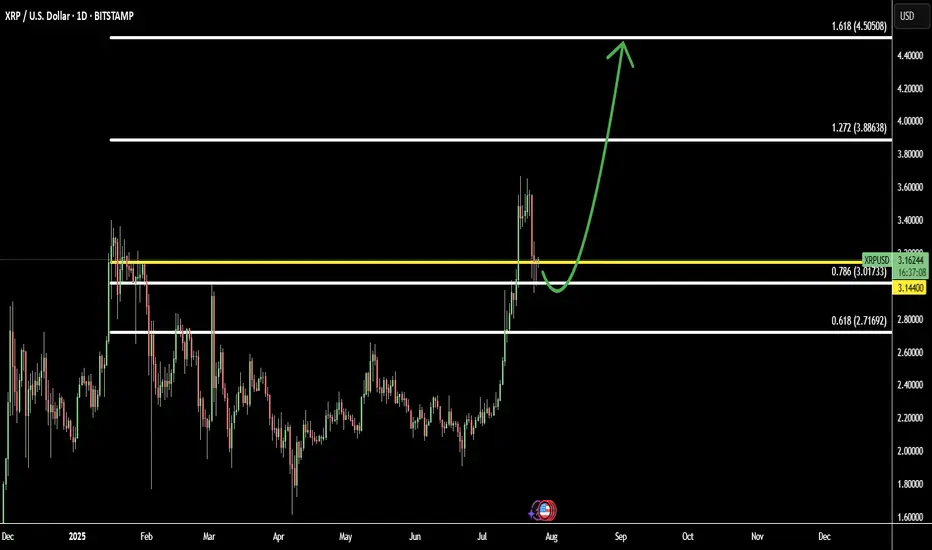
XRP Pullback Complete: Bulls Step In Toward Fibonacci TargetsAfter a healthy pullback, XRP (XRPUSD) is showing signs of renewed strength as new buyers re-enter the market. This correction phase appears to have attracted smart money, setting the stage for the next bullish leg.
The chart structure suggests XRP is now in a re-accumulation phase, with price aiming for mid-term Fibonacci targets:
Target 1: 1.272 Fib – 3.88 - continuation zone after breakout
Target 2: 1.618 Fib – 4.50 - strong extension level aligned with prior highs
If momentum holds and volume builds, XRP may resume its upward trajectory toward these targets in the coming weeks.
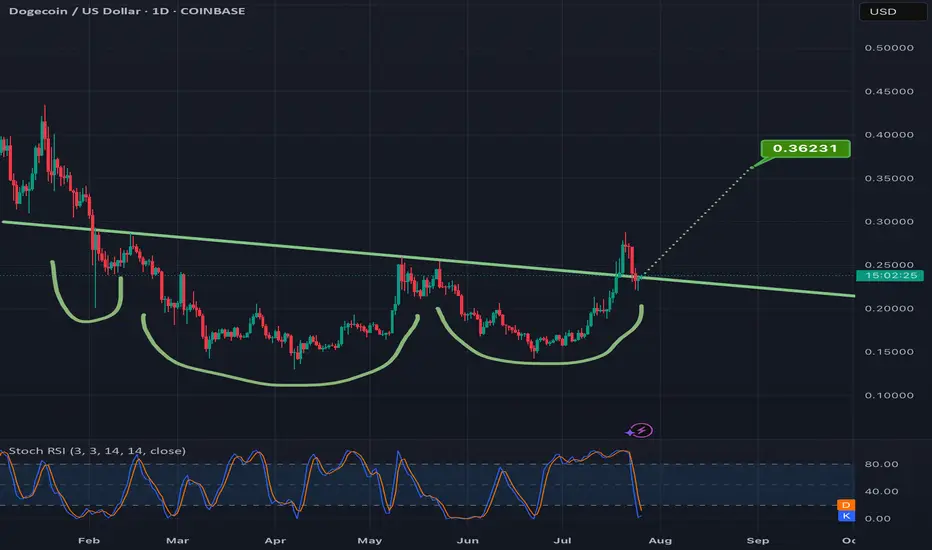
Confirming the breakout of this invh&s on doge can = 50% gainsAlready went above the neckline once and the current daily candle is currently back above the neckline for a second time. Hitting the full target would mean a good 50% gain from current price. *not financial advice*
BTC SELL SHORT IDEA H1quick momentum short,to create weekly low manipulation for any masjor move, right now focus is on the sell move, following sub struture ltf trend pull back
Nasdaq Short: Completion of 5 waves with wave 5=wave 1Over here, I present a short case for Nasdaq (and S&P500 by default since their correlations are high). The main reasons are:
1. Completion of 5 waves structure both on the high degree and on low degree, as shown in the chart.
2. Fibonacci measurement where wave 1 = wave 5.
The stop of this idea is to be placed slightly above the high, in this case, I placed it at around 23320. The take profit target is at the bottom of primary wave 4, around 20685.
Take note that this is a positional short, meaning the strategy is to short and hold and periodically adjust your stop loss based on unfolding on wave structure. Sizing is based on your risk tolerance.
Good luck!

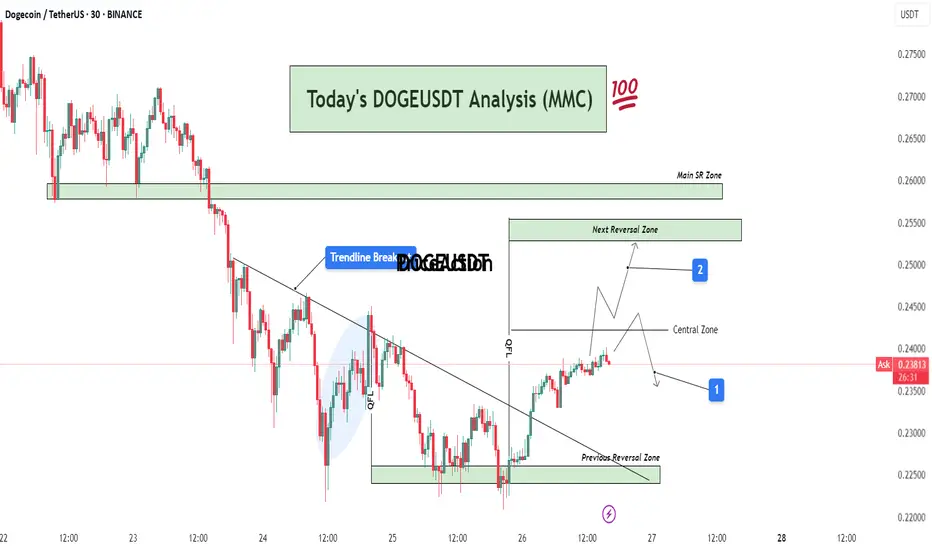
DOGEUSDT Analysis : Bullish Breakout, Reversal Zones + Target📊 Full Technical Analysis:
This chart presents a structured and precise MMC-based analysis of DOGE/USDT on the 30-minute timeframe, integrating key price action zones, trendline structure, and potential market scenarios.
🧩 1. Downtrend Phase and Trendline Formation
DOGE was in a continuous downtrend, creating lower highs and lower lows. A bearish trendline had been acting as dynamic resistance for multiple sessions. Price consistently respected this trendline, indicating strong seller dominance.
However, after repeated taps on the trendline and rejection from lower support, price finally broke above the trendline — marking a potential trend reversal or corrective phase.
🔄 2. Previous Reversal Zone – Demand Zone (0.225–0.228)
This zone acted as the major turning point where buyers aggressively stepped in. The demand was previously tested and respected, indicating strong accumulation here.
From this zone, a bullish reversal was initiated, leading to the current price rally.
This area can now be considered a structural support base – ideal for watching future re-tests or consolidation.
🔁 3. Central Zone – Decision Area (0.238–0.240)
This is a critical intraday resistance zone acting as a central decision-making area for traders.
Two Key Scenarios Could Play Out from Here:
Scenario 1 (Marked by Blue Box 1):
Price could face rejection from this zone and fall back slightly toward minor support levels for a retest or liquidity grab. If bullish pressure sustains, a higher low may form before continuation upward.
Scenario 2 (Marked by Blue Box 2):
If price breaks above the central zone with strong volume, momentum can push it toward the Next Reversal Zone between 0.250–0.255.
In either case, watching price behavior and candle structure near the central zone is critical for confirmation of the next move.
🔼 4. Next Reversal Zone – Supply/Resistance (0.250–0.255)
This zone marks a historical resistance area where DOGE faced heavy selling pressure before.
If price reaches this zone, expect:
Either profit-taking and short-term selling from intraday traders.
Or a possible breakout continuation if broader market sentiment remains bullish.
This zone will act as a key test of DOGE's strength and market conviction.
📌 5. Main SR Zone – Strong Structure (0.258–0.260)
Beyond the Next Reversal Zone lies the Main SR (Support-Resistance) Zone, where price has reacted strongly in the past.
If DOGE manages to break and hold above the 0.255 range, this zone will likely become the next upside target and strong resistance zone.
🔍 Additional Market Context:
Breakout Volume: The trendline breakout was accompanied by rising volume, which suggests stronger conviction behind the move.
QFL Zone: Price structure also aligned with a QFL (Quick Flip Level) bounce within the shaded region before breakout, further validating the bullish pressure.
Psychological Levels: 0.240 and 0.250 are psychological levels, which often act as magnet points and temporary resistance/support.
🧠 Mirror Market Concepts (MMC) Insight:
This analysis is rooted in Mirror Market Concepts, where the market tends to reflect past behavioral zones. Each marked zone (Demand, Central, Reversal, SR) is based on previous reaction points that guide current sentiment.
The market is now in a mirror reaction phase, moving from the previous demand zone toward historical supply zones. If the symmetry continues, the pattern supports a gradual bullish continuation with measured pullbacks.
✅ Trading Plan (Educational Purpose Only – Not Financial Advice):
Entry Zone 1: Breakout traders may have entered after the trendline breakout near 0.233–0.235.
Entry Zone 2: Conservative traders can look for retest confirmation in the Central Zone.
Target Zone: Next Reversal Zone (0.250–0.255) and possibly Main SR (0.260).
Stop Loss: Below the Previous Reversal Zone (~0.224) for swing setups.
Risk-to-Reward: RR setup of 1:2 or higher possible depending on entry strategy.
NVDA: Last week of July Just my thoughts on NVDA.
Not advice of course.
As always, trade safe and have a great weekend!

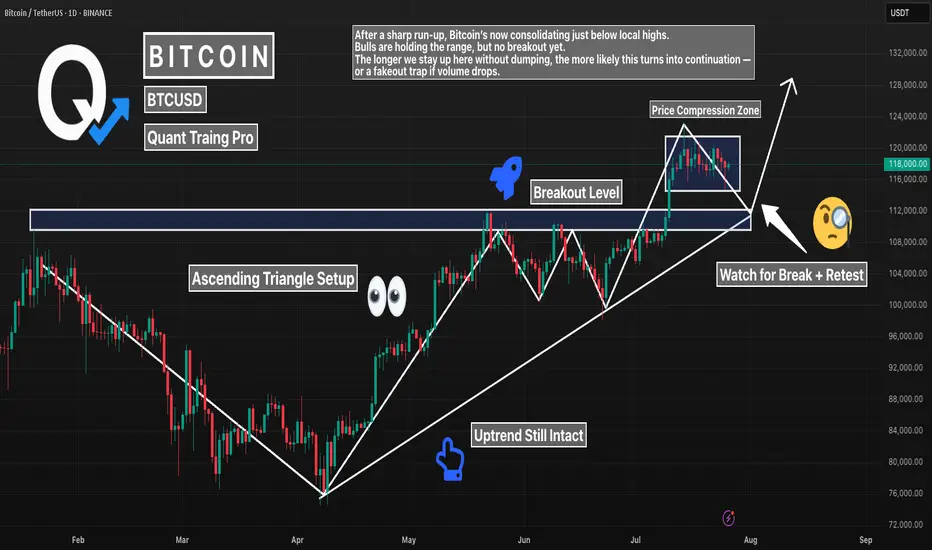
BTC 1D – Major Break of Structure. Now What?Bitcoin just broke major structure — flipping a key resistance level into support. After months of building higher lows, we finally saw price close above the previous swing high, confirming a bullish break of structure (BOS).
Now, BTC is coiling above that zone, forming an ascending triangle and refusing to give up ground. That’s a strong sign — but confirmation still matters.
What to watch:
– Break + retest of current range for continuation
– Or false breakout if volume fades and price sweeps below the level
Structure has shifted bullish. Now it’s all about follow-through.
#BTC #Bitcoin #BreakOfStructure #BOS #CryptoTrading #PriceAction #TechnicalAnalysis #QuantTradingPro
Smart Robbery Plan: LINK/USDT Long Setup | Swing/Day Trade Idea🚨CHAINLINK HEIST PLAN 🚨 | LINK/USDT Market Robbery (Thief Trader Style) 💰🔐
🌍 Hola! Bonjour! Hallo! Marhaba! What’s up, Money Makers & Market Robbers?! 🕶️💵
Get ready to raid the LINK/USDT vault with Thief Trader’s high-precision strategy based on 🔥 Technical & Fundamental fusion 🔥.
This is not your regular setup. This is a robbery roadmap. Designed for swing & day traders, and spiced with smart DCA entries, risk control, and a bold vision. Let's get into the game plan before the market alarms go off! 🚓📉📈
🎯 Master Plan – LINK/USDT | Bullish Setup
Entry:
📌 “The vault is open – grab the loot!”
Start entering long anywhere within the nearest price pullback zone. Use 15m to 30m TFs for sniper-style limit entries.
🛠️ Deploy DCA-style multiple limit orders (layered strategy), preferably around recent swing lows or major liquidity zones.
Stop Loss:
🔐 Place SL just below the 4H swing low wick (Currently at $16.50), adjusting for your risk, lot size, and how many limit orders you're stacking.
Take Profit:
🎯 Main TP target: $21.50
⛔ Or bail early if momentum weakens. Your profit, your decision.
⚡️Scalper’s Memo:
Only scalp on the bullish side – stay with the smart money.
Have deep pockets? Jump in now.
On a budget? Join swing traders and follow the full heist plan.
📉 Use trailing SL to secure profits during volatile rallies.
🔍 Fundamental & Sentiment Snapshot:
LINK is gaining bullish traction due to a combo of strong sentiment, favorable macro outlook, and on-chain flows aligning.
📊 Keep eyes on COT reports, intermarket data, and liquidity metrics.
🧠 Sentiment leans bullish while late bears are trapped in the supply zones above.
🛑 Risk & News Management Alert:
🚨 News releases can spike volatility and mess with clean entries.
📵 Avoid placing trades during high-impact events.
📍 Use trailing stop-loss to protect your running profits and preserve capital.
💖Support the Plan, Join the Heist:
Love the trade idea? 💥Hit the BOOST💥 button and show some love to the strategy that lets traders "rob the market" with confidence.
Every like helps build the strongest heist crew on TradingView.
✅ Stay sharp. Stay patient. Stay profitable.
👤 Thief Trader signing out… until the next raid. 🐱👤💰🚀
#LINK #LINKUSDT #CryptoTrading #ThiefTrader #SwingTrade #DayTrade #DCA #BullishSetup #TradingPlan #TA #RobTheMarket #ChainlinkHeist #SmartMoneyMoves

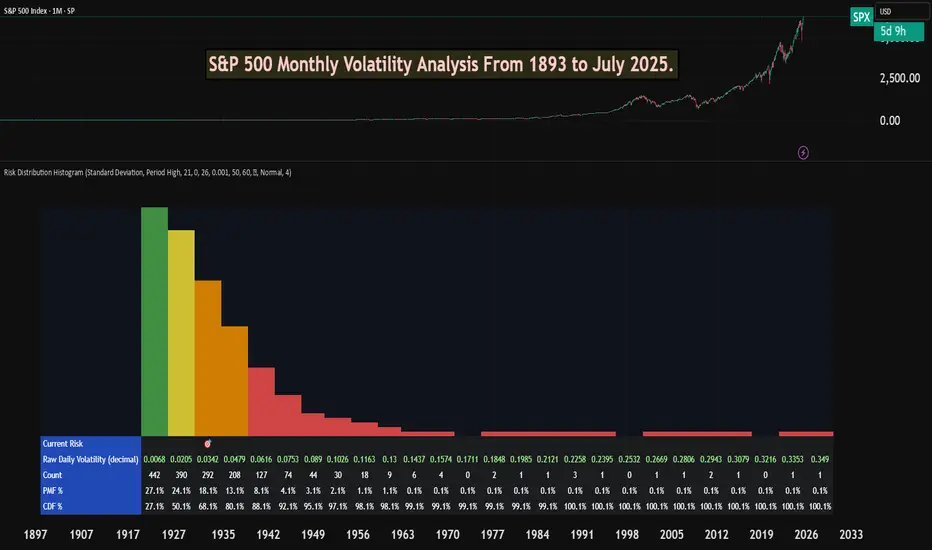
S&P 500 Monthly Volatility Analysis From 1893 to July 2025Most of the time, the S&P 500 is seen as a low-volatility index when compared to most individual stocks, small-cap indexes, or indexes from other countries.
However, most investors don't know exactly what volatility to expect from a statistical perspective.
The Risk Distribution Histogram allows us to understand exactly how risk is distributed.
S&P 500 Statistical Risk Distribution
Here are some highlights from what we get from the analysis. Some of this data might actually surprise investors. The data is monthly:
27% of all months have volatility under 0.68%
80% of all months' volatility was under 4.79%
5% of all months had a volatility of over 7%
If we can call a volatility over 25% a severe crash or "grey" swan, we had 7 of those events
3 months with extreme volatility over 30%
This allows us to understand tail risk and plan ahead. While most times the S&P 500 is in the low volatility zone, extreme events can happen.
What can we learn from this?
Prepare for rare but possible high-volatility events.
Understand the 80/20 rule. Most months are very low volatility, but 20% of them will have a volatility higher than 5% approximately.
Avoid overconfidence in stability
Plan for long-term horizons. High volatility tends to "dissipate" in the long term.
This is why it's important not to discard rare high-volatility events, especially when the investor is in need of liquidity.
This risk analysis can be done for any ticker.
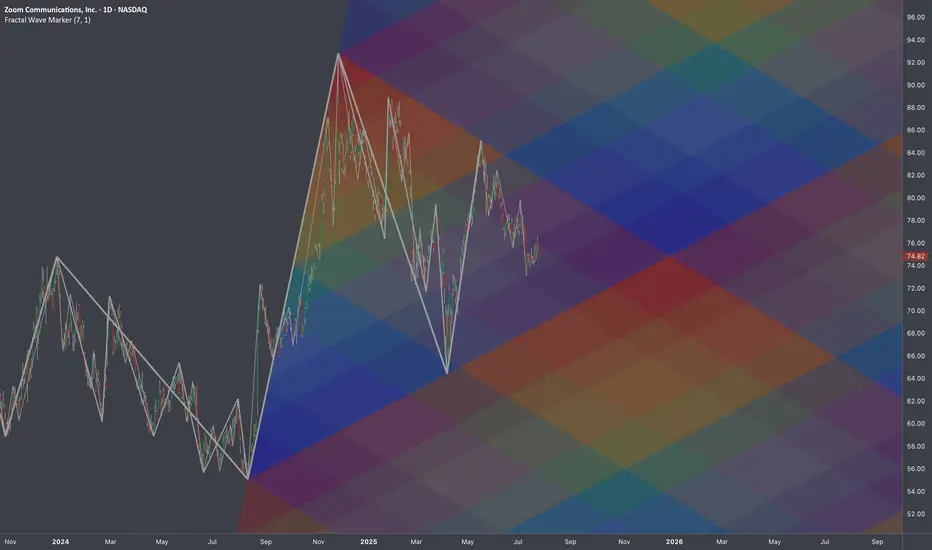
$ZM: Fibonacci Gradient 🏛️ Research Notes
Original Structure
Substitute for projection (TV's drawing tool)
I was thinking if using same 3 coordinates of cycle to cover future 2-polar expansions after breakout. That's why descending fibs would start with coldest (at breakout zone it would be relevant) and vise versa.
Same but with added counter-direction to produce gradient effect of decay.
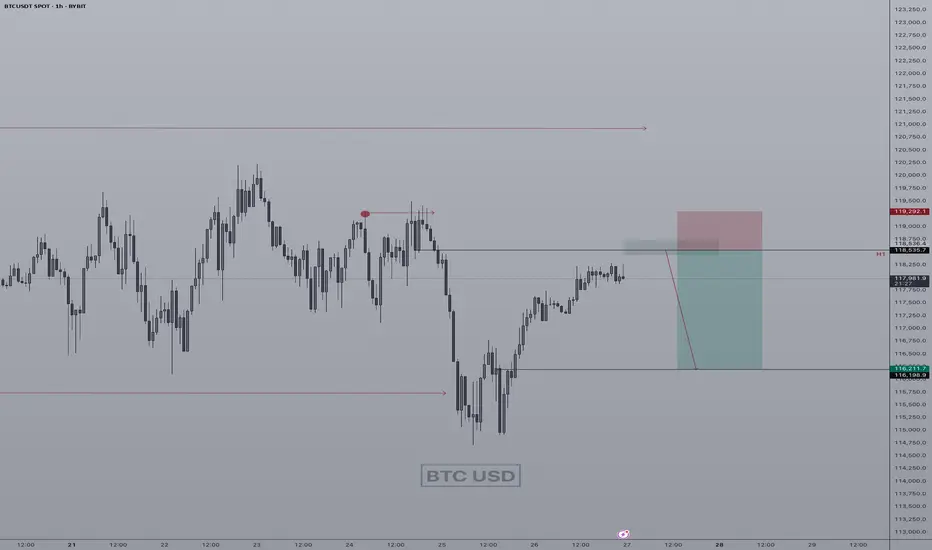
BTCUSD MIGHT DROP!The price currently trade at 117,399 recently price broke through the local support level of 116155.00 I anticipate price to make some sell corrections . I’m selling from the current market price. Take advantage of the opportunity.

Buy zone for GBP USDEasy buy on GBP_ Very good entry point after a massive rally,,, pull back zone.. and its a careful buy point

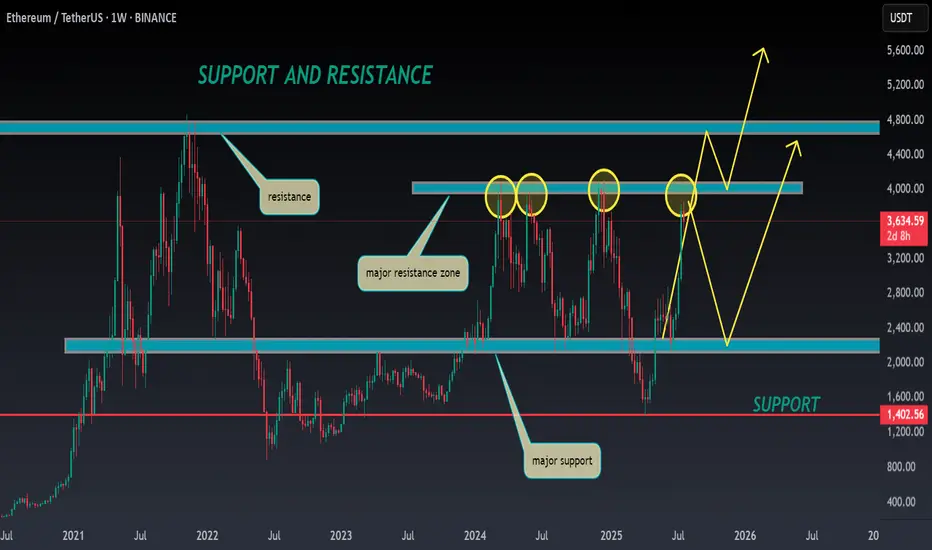
ETH ANALYSIS🔮 #ETH Analysis 🚀🚀
💲💲 #ETH is trading between support and resistance area. There is a potential rejection again from its resistance zone and pullback from support zone. If #ETH breaks the major resistance zone then we would see a bullish move
💸Current Price -- $3634
⁉️ What to do?
- We have marked crucial levels in the chart . We can trade according to the chart and make some profits. 🚀💸
#ETH #Cryptocurrency #DYOR
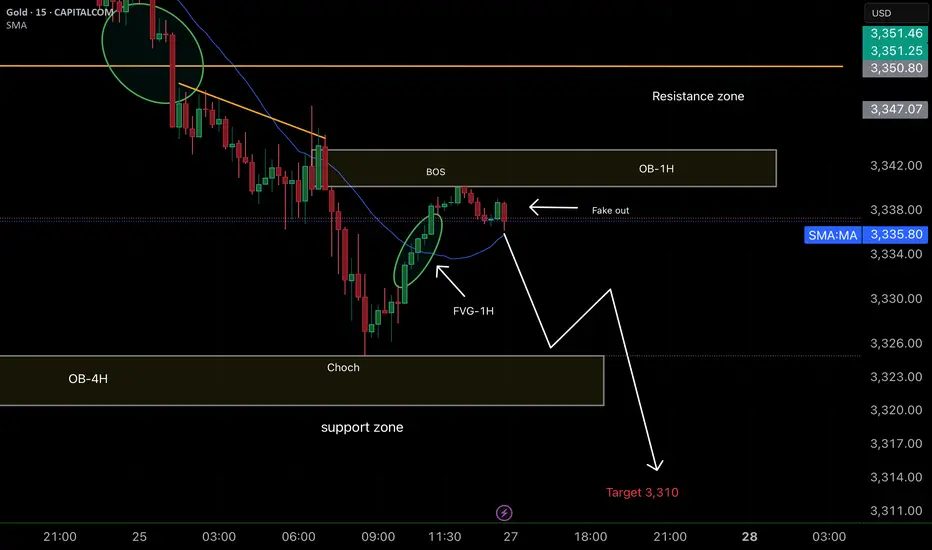
Smart Money concepts (SMC) Positive points of the analysis:
1. Clarity in the market structure (CHoCH + BOS):
It is clear that the market made a CHoCH and then confirmed it with a Break of Structure (BOS), which validates the downward trend change.
2. Well-identified fake out:
The "fake out" just after the BOS and within the 1H-OB is typical institutional behavior. This bullish wick is a trap to induce liquidity before the fall. Excellent reading.
3. Confluence zone (1H-OB + 1H-FVG):
The price rises to mitigate the 1H-FVG within the 1H-OB, providing a very good entry opportunity.
Furthermore, this occurs within the resistance zone, which gives it even more weight.
4. Support zone and target at 3310:
The TP is very well projected at 3310, just below the current support zone. If it breaks that zone, it is highly likely that it will reach the target.