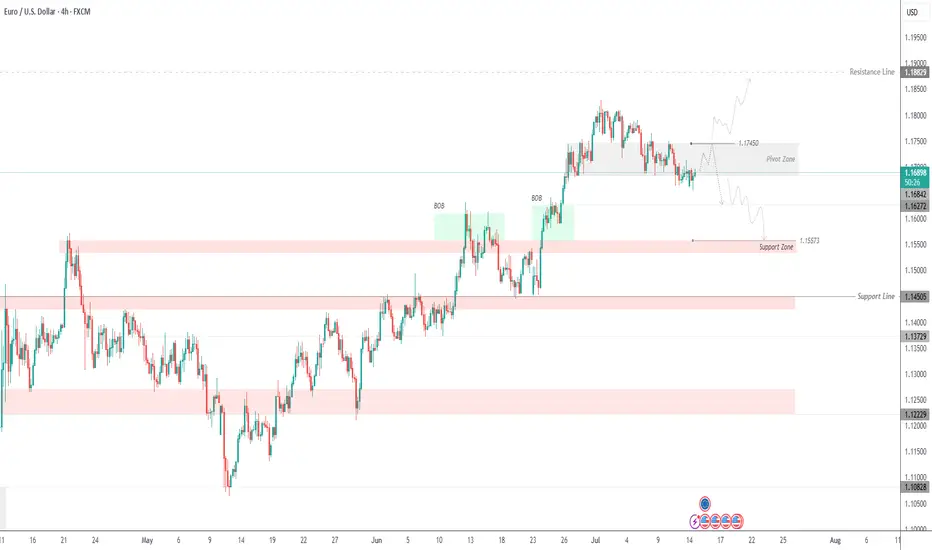
EURUSD Testing Patience – Bearish Trend Not Over YetEURUSD – Overview
EURUSD continues to trade under pressure amid bearish momentum, respecting key technical levels.
The price maintains bearish momentum as long as it trades below 1.1745, with downside targets at 1.1627 and 1.1557.
A retest of 1.1745 is possible and considered normal in this structure. However, if the price stabilizes below 1.1684, it will likely continue dropping toward the support targets.
To shift back to a bullish bias, the pair must break and hold above 1.1745.
Pivot Line: 1.1695
Support Levels: 1.1627 – 1.1557
Resistance Levels: 1.1745 – 1.1810
previous idea:
Pairs
Sprott Copper Arbitrage against LME copper futures, discount 20%Currently COP.UN (traded on TSX, Toronto Stock Exchange) is showing some substantial discount again against NAV. Discount is more than 20% which basically means that you can buy copper on the world markets (LME) with a 20% discount! I expect discount will narrow again in coming weeks and wil go back to minus 10 or even better.
A more detailed description can be find below of all facts and figures.
Current Situation:
Discount to NAV: COP.UN is trading at just over a 20% discount to its net asset value (NAV). Essentially, this means you can buy copper exposure at a significant discount to the current market price.
Copper Storage and Transfers: The trust’s copper is stored in LME-approved warehouses and is increasingly being shipped to COMEX warehouses in the U.S. The reason is straightforward: copper prices on COMEX are currently higher than on the LME. By moving copper to COMEX, Sprott can sell inventory at better prices.
Mechanism for Payouts: The proceeds from selling copper at a premium on COMEX versus the LME can be distributed to unitholders as a special cash distribution (dividend). This provides a direct way for investors to benefit from arbitrage between exchanges.
Redemption Option: Institutional investors can redeem trust units for physical copper, subject to minimum tonnages and fees. This helps keep the trust price connected to physical copper markets and offers an arbitrage route if the discount remains wide.
The Opportunity:
This setup offers trading houses huge opportunities:
Arbitrage Play: Buy COP.UN units at a >20% discount, redeem them for physical copper, and sell the metal at spot prices, pocketing the spread (net of costs).
Dividend Upside: Hold COP.UN units and potentially benefit from future special dividends if Sprott continues moving copper to COMEX and realizing higher sales prices.
Useful Resources:
COP.UN Prospectus (Sprott Physical Copper Trust) cop-prospectus-en.pdf

CAD/JPYSince my ascending triangle formation has violated its characteristics it is no longer valid. I took this opportunity to revisit this pair and start again. I still believe price is operating from the Double Bottom Formation so I'm still looking for price to go up. Here we have 4 touches on our Trendline & A Expanding Flat Formation (highlighted in blue letters). I have entered a position after the 4hr close but im still looking for a retrace for a better position.

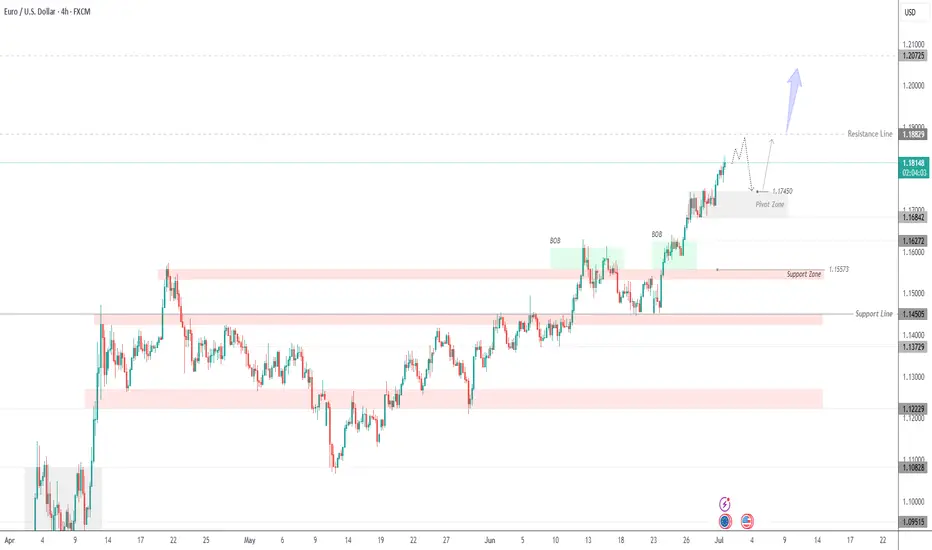
Euro Continues Bullish Trend | Eyes on 1.1882 & 1.2075EUR/USD – Strong Bullish Structure | Watching 1.1745 Pivot Zone for Reentry
The Euro continues to trade in a well-defined bullish trend, supported by institutional demand and clear price structure.
After breaking above the 1.1684 resistance zone, EUR/USD extended toward 1.1818 and now approaches the next resistance at 1.1882. This level may act as a temporary cap, but if breached with momentum, the pair could target the 1.2075 zone next.
Bullish Order Blocks (BOBs) marked on the chart highlight previous accumulation zones where buyers stepped in aggressively. These areas are still valid for demand-based pullbacks.
Key Area to Watch – 1.1745 Pivot Zone:
This level serves as a potential reentry point if the price retraces. As long as EUR/USD holds above this zone, bullish momentum remains intact. A confirmed bounce here could resume the uptrend toward 1.1882 and beyond.
However, a clean break below 1.1745 could open the door for a deeper correction toward 1.1627 or even 1.1557, which is the next major support zone.
Key Levels:
Resistance: 1.1882, 1.2075
Pivot Zone: 1.1745
Support: 1.1627, 1.1557
EUR/USD Forming Double Top –Bearish Reversal Toward Key Support?📉 EUR/USD Technical Outlook – Bearish Bias Developing 🔍
🟪 Key Resistance Zone:
📍 1.1350 – 1.1450
Price has tested this resistance zone multiple times, forming a double-top pattern (🔄) within the highlighted circle. This signals buying exhaustion and potential reversal pressure. The recent failure to break above confirms the zone’s strength.
🔴 EMA Confluence:
🧭 50 EMA (red): ~1.1242
🧭 200 EMA (blue): ~1.0961
The price is currently hovering just above the 50 EMA but well above the 200 EMA, which is acting as a dynamic support. The crossover has already occurred, so if price breaks below the 50 EMA decisively, momentum could shift bearish.
🔻 Support Breakdown Risk:
A breakdown from the 1.1200 neckline area (highlighted in red oval) would confirm the double-top pattern 🎯. That opens downside potential toward the strong demand zone below.
🟪 Strong Support Zone:
📍 1.0700 – 1.0800
This area aligns with prior consolidation (March lows) and the 200 EMA, making it a high-probability reversal zone 📈 if the bearish scenario plays out.
📌 Trade Setup Insight:
✅ Bearish confirmation below 1.1200 neckline 📉
🎯 Target: 1.0800 zone
❌ Invalidation: Break above 1.1350 resistance
🔵 Summary:
The chart is hinting at a classic double-top reversal below a key resistance zone. If price breaks the neckline, sellers are likely to gain control, targeting the strong support near the 200 EMA.
📊 Bias: Bearish 👇
📅 Timeframe: Daily
🛑 Risk Management: Watch for fake-outs near neckline; volume confirmation preferred.

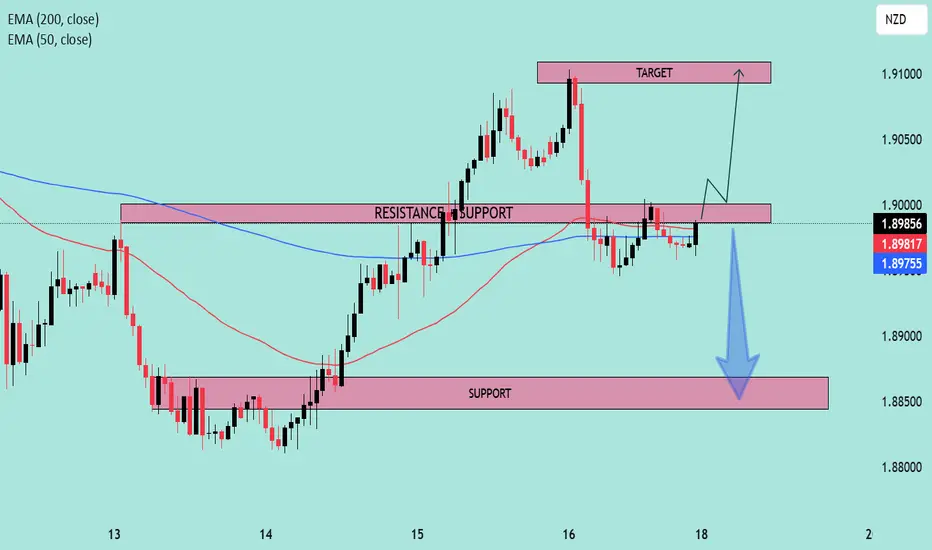
EURNZD at Key Decision Zone | Breakout or Breakdown?📊 Pair: EURNZD
🕒 Timeframe: Likely H1 or H4
📅 Date: May 18, 2025
🔍 Technical Analysis
🔁 Key Zones
🔴 Resistance-Turned-Support (RTS):
1.8975 – 1.8990
This area was previously a resistance level that price broke above, and is now acting as a critical support zone (flip zone). Price is currently retesting this area.
🎯 Target Zone (Resistance):
1.9085 – 1.9110
This is the next projected bullish target if price successfully rebounds from current support.
🛑 Major Support Zone:
1.8840 – 1.8860
Strong buying interest was seen here previously, acting as a safety net in case of bearish rejection from the current level.
🔄 EMA Confluence
📘 EMA 200 (Blue): 1.8975
📕 EMA 50 (Red): 1.8981
Price is hovering around the EMAs, indicating a moment of decision. A decisive move above these EMAs could trigger bullish momentum. 📈
🔮 Scenario Outlook
🟢 Bullish Scenario (Preferred Setup)
✅ Confirmation above 1.8990
➡️ Retest and continuation could push price toward the 1.9100 target zone.
🔼 Momentum supported by prior breakout and higher lows.
📌 Entry Idea: Above 1.8995
🎯 Target: 1.9100
🛡️ Stop: Below 1.8950
🔴 Bearish Scenario
❌ If price fails to hold the 1.8970–1.8990 zone, a breakdown could follow.
⬇️ Likely move toward 1.8850 support zone.
🚨 Watch for bearish engulfing or rejection candles near resistance.
🧠 Summary
Price is at a key decision point.
✅ Bullish bias is slightly stronger due to market structure (higher highs & higher lows).
⚠️ But a clean break below support would shift focus to the downside.
📈 Strategy: Wait for confirmation ⚖️
Bullish: Break + retest of 1.8990
Bearish: Breakdown below 1.8950 and close under EMAs
US30 Approaching Key Resistance Within Rising Channel:🧠 Chart Context & Overview
Chart Type: Candlestick
Time Frame: Appears to be Daily (based on price action and spacing of dates)
Current Price: ~$40,798.4
Indicators:
EMA 50 (Red): ~40,065.2
EMA 200 (Blue): ~41,475.6
Trend Structure: Ascending channel with higher highs and higher lows forming since early April.
🔍 Technical Breakdown
📈 Trend Analysis
The price is moving within a rising parallel channel, respecting both upper and lower boundaries.
The recent bullish candles indicate momentum building towards a breakout or test of resistance.
🔄 EMA Confluence
Price is above the 50 EMA, showing short-term bullish momentum.
EMA 200 is acting as overhead resistance (~41,475), aligned with the top of the channel—a key decision zone.
📊 Support & Resistance Levels
Immediate Resistance: ~41,475 (EMA 200 & upper channel boundary).
Support Levels:
~40,065 (EMA 50)
~39,000 (mid-channel support zone)
~38,000 (lower channel boundary)
📌 Scenarios to Watch
✅ Bullish Case:
A clean breakout above the channel and the 200 EMA (~41,475) with strong volume could trigger a trend continuation toward:
42,500 – next psychological and historical resistance
Potentially higher if macro sentiment aligns
⚠️ Bearish Case:
Rejection at 200 EMA or the upper channel could lead to:
A pullback to the mid-channel zone (~39,800–40,000)
Further downside to retest the lower channel support (~38,000)
📅 Outlook
The chart currently supports a bullish bias within an uptrend structure, but the key resistance zone (41,475) must be broken decisively for confirmation. Watch for volume and candle structure near that level to assess breakout validity.

USD/CHF Reversal Setup (Read-Caption)🧠 Professional Technical Analysis – USD/CHF 💱
🗓️ Date: May 6, 2025
🕰️ Timeframe: Likely 4H or Daily
📊 Current Price: ~0.82218
🔍 Technical Indicators
🔵 EMA 20: 0.84190 (short-term trend)
🔴 EMA 50: 0.82524 (mid-term trend)
❗ Bearish crossover: EMA 20 is below EMA 50 → short-term bearish bias 🐻
📉 Support Zone Analysis 🛡️
🟥 Key Demand Zone (Support): 0.82084 – 0.81437
🔁 Price has bounced here before 🪃
🕯️ Candles with long lower wicks = buyers stepping in 🧍♂️💪
🟠 This is the “bounce zone” 📈
🧭 Trade Idea
✅ Long Entry: Around 0.82084–0.82200
🛑 Stop Loss: Below 0.81437 ❌
🎯 Take Profit: Around 0.83600 🟢
⚖️ Risk/Reward: Excellent (>2:1) if bounce holds 🚀
🔄 Price Action Outlook
📉 Downtrend approaching major support
🕯️ Looking for bullish candlestick confirmation (engulfing, hammer, etc.)
📈 Target area aligns with mean reversion to EMA 20
📌 Conclusion
👀 Watching for bullish reversal signs 🔄
🛒 Buy zone is clearly defined ✅
⛔ Setup is invalidated if price closes below 0.81437

EUR/AUD Bearish Channel with Key Support Ahead📉 Market Structure Analysis (Bearish Bias)
Current Trend:
The pair is trading within a well-defined descending channel, indicating a bearish trend. Price action is forming lower highs and lower lows, adhering to the channel boundaries.
Moving Averages (EMA):
EMA 50 (Red) at 1.77491 is above the price, acting as dynamic resistance.
EMA 200 (Blue) at 1.73338 is close to current price, likely to act as a support area in the short term.
The bearish crossover between the 50 EMA and current price supports the continuation of downward momentum.
🔍 Key Zones:
Weak Resistance Zone:
Located around 1.7740 – 1.8000, previously a support area, now acting as resistance.
Price rejection from this zone multiple times indicates sellers' strength.
Support Zone:
Located around 1.6950 – 1.7100, where demand may return.
This zone coincides with the lower boundary of the descending channel, making it a likely reaction zone.
📊 Forecast / Expectation:
The chart projects a bear flag / corrective pullback before another leg downward toward the support zone.
If price breaks and sustains below the EMA 200, it will likely accelerate bearish pressure.
The descending channel suggests potential continuation to the downside unless price breaks out of the upper boundary with momentum.
✅ Trade Implications:
Bearish Setup:
Look for short opportunities on intraday pullbacks near the resistance or EMA 50.
Bullish Invalidations:
A breakout above the descending channel and sustained move above 1.7800 would invalidate the bearish outlook.
Conclusion:
This chart presents a technically clean bearish setup. The confluence of a descending channel, EMA rejection, and defined resistance/support zones suggests the EUR/AUD may continue lower, especially if it loses the 1.7300 level decisively.

Monitoring to Entry – AN/PAGThis pair was added to our Awaiting Confirmation list on April 16 , after showing a potential setup for a long position based on price deviation.
As of April 17 , the setup evolved further:
The pair Started below the lower Bollinger Band , suggesting continued price dislocation.
Stochastic %K and %D were both under 20 , indicating an Oversold condition.
ADX = 12.0 – signaling a sideways market, favorable for mean reversion.
DI-/DI+ ratio = 1.86 – still shows dominance of sellers, but that value improved (decreased) from the previous day.
A strong bullish candle appeared, reinforcing the shift in momentum.
Conclusion:
Although not all indicators were aligned perfectly, the price structure and early momentum reversal were enough for me to trigger a long entry as of April 17.
Now, I am monitoring this position with close attention to DI dynamics and further stochastic confirmation.

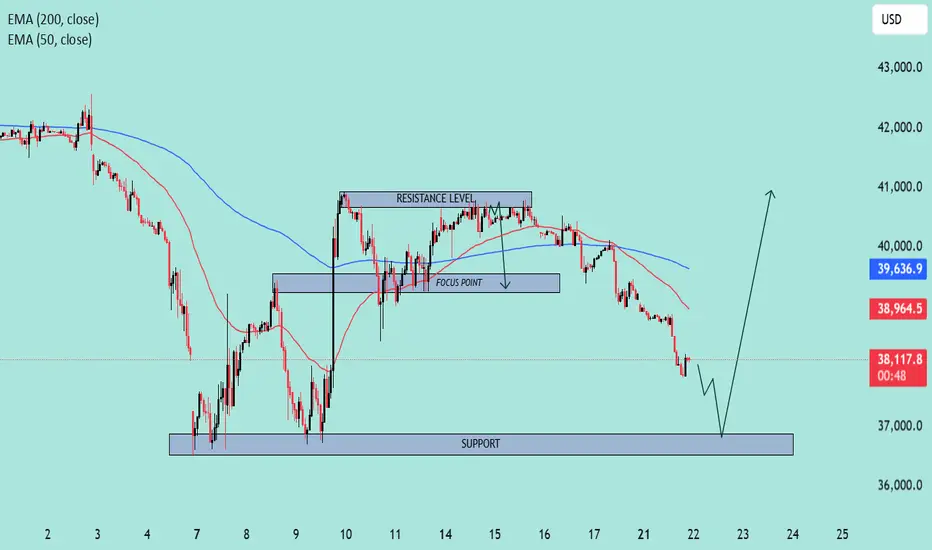
US30 Approaching Key Support Zone – Potential Reversal Ahead?📊 Chart Overview:
Timeframe: Looks like an intraday (maybe 1H or 2H).
Indicators:
EMA 50 (Red): 38,964.7
EMA 200 (Blue): 39,637.0
🔍 Key Levels & Structure:
🔵 Support Zone (Highlighted):
Around 36,800 – 37,200 range.
This is a well-tested support level where price previously bounced.
Current price action is approaching this zone again, which increases the chance of a potential bullish reaction.
🟣 Resistance Level:
Defined around 40,500 area.
Price has rejected multiple times from this zone.
Previously served as a consolidation/decision area.
📍 Focus Point (Previous Support Turned Resistance):
Near 38,700 – 39,000.
This level may act as a reaction point on the way back up.
📉 Current Price Action:
Strong downward momentum heading into the support zone.
Price is under both EMAs, suggesting short-term bearish trend.
However, the drawn arrow suggests a potential reversal bounce from the support.
🧠 Interpretation & Scenario Plan:
🅰️ Bullish Scenario:
Price touches or sweeps the support zone.
Bullish structure or reversal candle forms (e.g., hammer, bullish engulfing).
Break back above EMA 50 & Focus Point could confirm the shift.
Target: Revisit Resistance Zone (above 40,000).
🅱️ Bearish Scenario:
Support fails to hold.
Clean break below 36,800 with volume could lead to accelerated sell-off.
Watch for breakdown retests of support turned resistance.
🔔 Takeaway:
⚠️ Current move is bearish, but price is approaching a key demand zone. Bulls might step in if the zone holds. Confirmation is key before going long. Reclaiming EMAs would strengthen bullish bias.
EUR/USD Bearish Setup Unfolding Below Key Resistance📊 Technical Analysis of EUR/USD (4H Chart)
🧭 Chart Overview:
Current Price: ~1.1350
Indicators Used:
EMA 50 (Red): ~1.1311 — acting as dynamic support.
EMA 200 (Blue): ~1.1114 — aligns closely with major support zone.
📌 Key Levels:
🔼 Main Resistance Zone: 1.1375 – 1.1400
Price has tested this zone multiple times, forming a potential double top pattern.
Strong bearish pressure observed each time price enters this area.
🔁 Minor Resistance (Retest Zone): ~1.1325 – 1.1345
Currently acting as a decision zone.
If price fails to hold above this level, it could turn into resistance on the next bearish leg.
🔽 Support Zone: 1.1100 – 1.1130
Converges with EMA 200 — making it a high-probability demand zone.
Potential target for the anticipated drop.
🧠 Price Action & Structure:
Market showed a strong bullish rally previously, breaking through resistance levels.
Now showing signs of exhaustion at the top.
Bearish scenario projected with a lower high forming below the main resistance, followed by a sell-off toward the support zone.
⚙️ Possible Scenarios:
Bearish Scenario (High Probability):
Price rejects the minor resistance → breaks below EMA 50 → continues lower to support.
Target: 1.1110 area.
Bullish Scenario (Low Probability):
Price reclaims and closes above 1.1375 with strong momentum.
Potential breakout and continuation toward 1.1450+.
🧩 Confluences Supporting Bearish Bias:
Lower high formation potential.
EMA 50 starting to flatten.
Failure to maintain momentum above main resistance.
Clean drop path toward 1.1110 if support breaks.
📉 Conclusion:
This setup favors short-term bearish movement, particularly if the price rejects around the 1.1345 level again. A breakdown below the minor resistance zone would likely trigger a sell-off toward the 1.1110 support, in line with the 200 EMA.

GOLD (XAU/USD) Breakout Watch –Bullish Continuation or Pullback?🔍 Instrument Analysis: XAU/USD (Gold vs USD)
Timeframe: Likely 1H or 4H (based on candle structure)
Indicators:
EMA 50 (Red) – Current value: 3,365.25
EMA 200 (Blue) – Current value: 3,248.04
📈 Current Market Structure
Price: Trading at 3,433.62, in a strong uptrend with higher highs and higher lows.
Trend: Bullish, supported by price trading above both the 50 EMA and 200 EMA.
Key Zones:
Immediate Resistance: ~3,430 - 3,440 zone (currently being tested).
First Support Zone: ~3,315 - 3,330
Second Support Zone: ~3,250 - 3,270
🧠 Scenario Analysis
✅ Bullish Scenario (Primary Bias)
Price is attempting a break and retest of the resistance zone.
If a successful retest confirms it as support, next upside leg could target 3,480+.
Bullish continuation is favored as long as price holds above 3,385 (recent breakout level).
⚠️ Bearish Scenario (Secondary Bias)
If price fails to hold above 3,385, we may see a pullback to:
3,315 - 3,330 support area (reaction likely due to proximity to EMA 50).
A deeper retracement toward the 3,250 zone, aligned with EMA 200, which would be a critical level for bullish continuation or breakdown.
📊 EMA Insight
EMA 50 > EMA 200: Confirms bullish momentum.
The slope of both EMAs is upward, reinforcing current upward trend.
A test of the EMA 50 may offer a buy opportunity if structure holds.
🔔 Trade Outlook
Bullish bias remains intact above 3,385.
Look for bullish price action confirmation (bullish engulfing, pin bars, etc.) on retest of resistance-turned-support.
Monitor volume/activity around 3,385-3,400 for potential rejection or continuation clues.

EUR/USD Bearish Setup Unfolding Below Key Resistance📊 Technical Analysis of EUR/USD (4H Chart)
🧭 Chart Overview:
Current Price: ~1.1350
Indicators Used:
EMA 50 (Red): ~1.1311 — acting as dynamic support.
EMA 200 (Blue): ~1.1114 — aligns closely with major support zone.
📌 Key Levels:
🔼 Main Resistance Zone: 1.1375 – 1.1400
Price has tested this zone multiple times, forming a potential double top pattern.
Strong bearish pressure observed each time price enters this area.
🔁 Minor Resistance (Retest Zone): ~1.1325 – 1.1345
Currently acting as a decision zone.
If price fails to hold above this level, it could turn into resistance on the next bearish leg.
🔽 Support Zone: 1.1100 – 1.1130
Converges with EMA 200 — making it a high-probability demand zone.
Potential target for the anticipated drop.
🧠 Price Action & Structure:
Market showed a strong bullish rally previously, breaking through resistance levels.
Now showing signs of exhaustion at the top.
Bearish scenario projected with a lower high forming below the main resistance, followed by a sell-off toward the support zone.
⚙️ Possible Scenarios:
Bearish Scenario (High Probability):
Price rejects the minor resistance → breaks below EMA 50 → continues lower to support.
Target: 1.1110 area.
Bullish Scenario (Low Probability):
Price reclaims and closes above 1.1375 with strong momentum.
Potential breakout and continuation toward 1.1450+.
🧩 Confluences Supporting Bearish Bias:
Lower high formation potential.
EMA 50 starting to flatten.
Failure to maintain momentum above main resistance.
Clean drop path toward 1.1110 if support breaks.
📉 Conclusion:
This setup favors short-term bearish movement, particularly if the price rejects around the 1.1345 level again. A breakdown below the minor resistance zone would likely trigger a sell-off toward the 1.1110 support, in line with the 200 EMA.

Two tempting short setups — but one is hiding real dangerWhich pair would you short?
We’re looking at JCPB/BAB and AGG/GTO , both showing positive deviation and riding the upper Bollinger Band.
At first glance, both look ripe for a short… but dig deeper, and you'll see very different stories.
🔹 JCPB/BAB
Chart:
Low ADX, balanced DI+ / DI− → classic setup for a mean-reversion short.
But the last daily candle is a strong bullish bar — big, green, and decisive.
This could be the start of a breakout , and shorting into fresh upside momentum is dangerous.
Looks neutral — but hides bullish potential.
🔸 AGG/GTO
Chart:
Clear uptrend: DI+ dominates, price marching upward.
Also touching upper Bollinger Band, so yes — shorting here is fighting the trend.
But at least the risk is obvious , and you can frame the trade accordingly.
Transparent trend = measurable risk.
🧠 Bottom line:
JCPB/BAB may seem safer — but that green candle changes everything.
AGG/GTO is clearly trending — risky to short, but less deceptive.
👇 So, if you had to short one of these — which would it be?
Drop your take below. Let’s hear your reasoning.

EUR/USD 4H Analysis – Bearish Reversal Toward Key Demand Zone📊 EUR/USD 4H Analysis – Bearish Reversal Setup
🔸 Market Structure:
The chart indicates a Change of Character (CHOCH) at the recent high, signaling a possible shift in trend from bullish to bearish. The buy stop liquidity appears to have been grabbed before the price reversed, suggesting smart money may be positioning for a sell-off.
🔸 Key Levels:
Resistance Zone: Near 1.0900, where liquidity was swept.
Support Zone: Marked in purple between 1.0450 - 1.0500, acting as a potential demand area.
🔸 Price Action Expectation:
A minor pullback or retest of the CHOCH zone before further downside.
A bearish continuation towards the 1.0500 demand zone, aligning with liquidity objectives.
🔸 Trading Plan:
Bearish Bias: Potential short opportunities if price confirms lower highs.
Invalidation: A sustained break above 1.0900 would negate the bearish thesis.
Target: 1.0500 zone for potential long-term buy interest.
📉 Conclusion: If the price respects the CHOCH level and fails to reclaim liquidity above, sellers could dominate, driving EUR/USD lower toward the 1.0500 liquidity pool.

NZDJPY 4h chart analysis: Key levels Trends SetupThe NZDJPY pair is showing slight bullish momentum but the key level to watch is 86.000 A breakout above this level could signal further upside. while rejection could lead to retest of lower support levels, Stay alert and trade with cautions.

AUD/USD at Critical Support – Breakout or Breakdown? 🔍 AUD/USD Daily Chart Analysis – March 9, 2025
Key Observations:
Ascending Channel 📈
The price is moving within an upward channel, indicating a short-term bullish trend.
Support & Resistance Zones 🟦🟥
Support: Around 0.6231 - 0.6200 (blue zone). A breakdown below this could push the price lower toward 0.6129 (orange zone).
Resistance: The 0.6460 - 0.6584 level is the next major hurdle for bulls.
200-Day Moving Average (Red Line) 🔴
The price is currently below the 200-MA, indicating a long-term bearish sentiment. However, a breakout above this level could signal a trend reversal.
Potential Scenarios 📊
✅ Bullish Case: If the price sustains above 0.6231, we could see a bounce towards 0.6460 - 0.6584 in the coming weeks.
❌ Bearish Case: A break below 0.6231 could push the price toward the 0.6129 - 0.6100 region before finding support.
Trade Plan 🎯
Buy Zone: Around 0.6231 with a stop-loss below 0.6200.
Sell Zone: If price rejects 0.6460, a short position could be considered with a stop above 0.6584.
📊 Conclusion: AUD/USD is at a key decision point. Bulls need to hold support for further upside. A breakdown could trigger a bearish move.

Sprott Physical Copper Trust (symbol, COP.UN) traded in Canada COP.UN is showing a big discount of about 20% against NAV
So a buy set up in COP.UN around current levels of about CAD 9,65 could show some nice profits
in the coming months when the discount will probably getting smaller.
Potential upside 20%
Long positions in COP.UN can be hedged by going short CPER (Copper ETF) in the US market to hedge against price drops in COP.UN

TECS/SSG Potential Long OpportunityTECS/SSG pair is signaling a Long position at the close of yesterday, supported by multi indicators, suggesting a promising opportunity.
ADX : Indicates no trend at present.
Correlation : remains very high in the last few weeks.
Close price : closed below lower BB.
Historical test : I would be happier with more historical opportunities in the last few months to test, but generally it seems okay.

ZSL/JDST: Potential Long OpportunityZSL/JDST pair is signaling a Long position at the close of yesterday, supported by multi indicators, suggesting a promising opportunity.
ADX : Indicates no trend at present, and a quick look at the daily chart confirms it.
Correlation : remains very high in the last few weeks.
Close price : closed below lower BB.
Historical test : I would be happier with more historical opportunities in the last few months to test, but generally it seems okay.

USDJPY broke above the 1day MA50. Bullish signal.USDJPY broke above the 1day MA50 for the first time since July 17th.
That is a clear bullish signal as the last time it did this after a correction was on January 16th 2024.
We expect at least a test of Resistance A on the short-term.
Buy and target 149.500.
Previous chart:
Follow us, like the idea and leave a comment below!!

(MOG) mog coinmog coin listed to kraken but now does not appear on their website as newly listed. Not sure if there is a bug or glitch or if they decided to not list mog coin. As I can see on trading view the kraken USD mog coin pair does exist despite the listing on their website going blank. Kraken also listed memecoin. In the last few months Kraken has listed some ~50 cryptocurrency to their trading exchange.
notable add-ons include;
TURBO, ECHELON PRIME, PARCL, RENDER, FLOKI, MANTLE, KUJIRA, BITTENSOR, LAYERZERO, BIG TIME, PENDLE, SAFE, MAPLE, HELIUM, BONK, OPTIMISM,.
people in the USA cannot trade :
ACA, AGLD, ALICE, ASTR, ATLAS, AUDIO, AVT, BONK, C98, CFG, CLOUD, CSM, FLOKI, GENS, GLMR, HDX, INTR, JASMY, KIN, KMNO, KUJI, L3, LMWR, MC, MV, NMR, NODL, NYM, ORCA, OTP, OXY, PARA, PEPE, PERP, PICA, PORTAL, PRCL, PSTAKE, PYTH, RAY, REQ, REZ, ROOK, SAMO, SDN, STEP, SUI, TEER, WEN, WIF, WOO, XRT, YGG, ZEX.
I notice quite often the best performing cryptocurrency "on the day," is one that is not tradable in USA. For instance, this week Sanctum (CLOUD) performed the best while most cryptocurrency was losing yet there is no way to gain from this instance because as seen from above CLOUD is not tradable in USA. Neither Bonk nor Dogwifhat are tradable in America on Kraken.com.
to check your location here is the link:
support.kraken.com
