LTC/USD Great 5% Realistic Long OpportunityAll the information for this trade can be found on the chart. My DMs are open! Feel free to reach out if you have a question.
Pairs

Bullish ETH/USD Is On The Way To $253 - Ascending TriangleAll information can be found on the chart. Feel free to DM me if you have any questions.


BTC/USD Approaching Pivotal Decision MomentIn this idea I will explain the recent price action of BTC and show you how to prepare for its next move.
Currently we are witnessing a bearish retest on the S/R flip. Support and Resistance levels can usually be re-used after the price broke through. A level that used to be support, and turn into a level that can be resistance. More so than historical price action, these levels show that trades care about its existence.
Right now, BTC is hovering around this point again of breaking through such a support or resistance. This is a pivotal moment where a break out in any direction be utilized. If we see it breaks out north and the price goes up. We can expect prices as high as $10,000. However, if it breaks down south, price of $9,300 are more realistic.
Follow me for consistent high quality updates, with clear explanations and charts.
Please like this post to support me.
- Trading Guru
--------------------------------------------------------------
Disclaimer!
This post does not provide financial advice. It is for educational purposes only!

XRP/USD Retracement To S/R Flip Gives Great Scalp OpportunityWe get the opportunity here to short trade XRP/USD and monetize the situation that it will retrace first, before getting ready to break through the resistance.
I know that this isn't a 350%+ trade, so the moonbois will be disappointed in me when they read this. I made this idea for the true traders, who know that a few % per day will get them the financial stability they want based off trading. It's the trades like these where the real money can be earned.
All further information for the trade can be found on the chart.

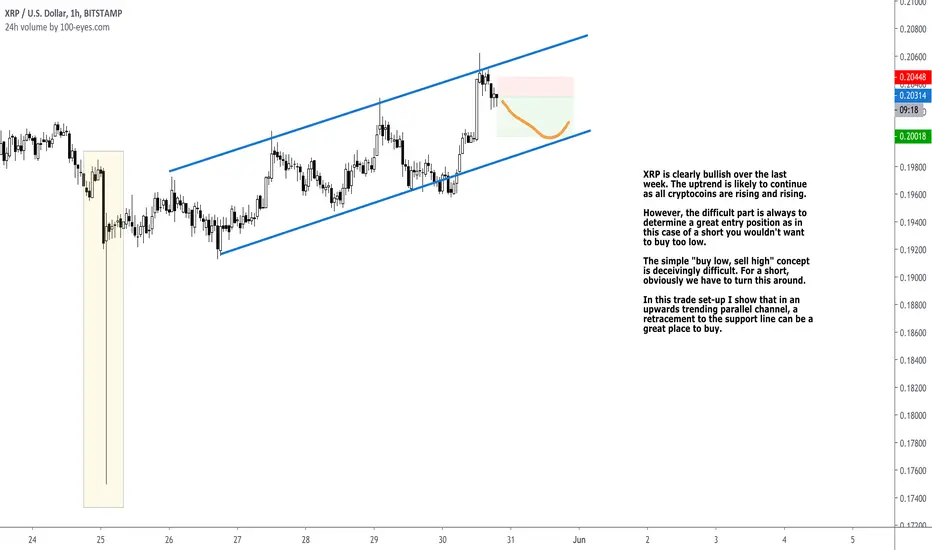
XRP Continues To Deliver Profits [Second Iteration]XRP is clearly bullish over the last week. The uptrend is likely to continue as all cryptocoins are rising and rising.
However, the difficult part is always to determine a great entry position as in this case of a short you wouldn't want to buy too low.
I will continue this idea, after an incredibly successful trade last time:
We can keep using the parallel channel to get a few more good trades in. After the confirmation on this resistance, we can now switch to a short position.
The simple "buy low, sell high" concept is deceivingly difficult. For a short, obviously we have to turn this around.
In this trade set-up I show that in an upwards trending parallel channel, a retracement to the support line can be a great place to buy.
Follow me for consistent high quality updates, with clear explanations and charts.
Please like this post to support me.
- Trading Guru
--------------------------------------------------------------
Disclaimer!
This post does not provide financial advice. It is for educational purposes only!
Short Scalp for ETH/USDDay traders pay attention! This is a really nice scalp opportunity. People who only care about fundamental analysis shouldn't read this. Purely based on TA we can find a nice opportunity here for a short position.
The price has closed in on the important $240 level, where we have seen historical strong resistance. Important to notice is that this is not just a price based resistance level, but also a psychological resistance level.
We already get a small confirmation of a retracement, so this is a great moment to enter such a scalp. Leave some room for error by placing the stop loss slightly above $240. For the take profit I chose a price slightly above the important $225 level. By putting it a bit higher we maximize the chances of our limit order to get hit.
Follow me for consistent high quality updates, with clear explanations and charts.
Please like this post to support me.
- Trading Guru
--------------------------------------------------------------
Disclaimer!
This post does not provide financial advice. It is for educational purposes only!

Bullish Scenario for BTC: What will happen after the resistance?Hi everyone, for this trade on BTC/USD we will look at this parallel ascending channel.
BTC/USD has been moving beautifully along this channel with a very bullish momentum. The bears have been left behind at around $8,800.
The momentum has been very consistent and upwards, creating much FOMO beyond doubt.
The price is at a small resistance now, and if it breaks through we can see a move as high as $10,000.
There are two scenarios here, either the price gets rejected at this resistance, and BTC will show some weakness again for the first time in a week. Or the price will break through the resistance and we'll see a nice volatility spike. I charted for you the scenario where it breaks through the resistance.
Follow me for consistent high quality updates, with clear explanations and charts.
Please like this post to support me.
- Trading Guru
--------------------------------------------------------------
Disclaimer!
This post does not provide financial advice. It is for educational purposes only!

AUD/USD with Ascending Triangle [QUICK UPDATES]Hey all, here’s another entry on my tradingview series called 'Quick Updates'.
On AUD/USD here we can see a nice ascending triangle. This is a bullish pattern, where we expect the price to break through the upper resistance line eventually. Every time the price has hit this area the price has bounced back, but each time slightly less. This means two things: 1) with each subsequent attempt to break through the resistance, the resistance becomes weaker, and 2) the bears are becoming weaker as their momentum is decreasing after each bounce.
I expect that at some point the price will break through the triangle and we see a very bullish break-out. We can monetize such a scenario with a simple long trade. All the numbers for the trade are in the chart.
--- What is The Quick Update Series All About? ---
I have started a tag (quickupdates) where I quickly share great opportunities based on TA for shorter timeframes, such as 4h, 1h, and 15m. It will contain a brief explanation with clear and clean charts in order to keep the velocity up and make sure you get to see the opportunities as fast as possible.
Follow me for consistent high quality updates, with clear explanations and charts.
Please like this post to support me.
- Trading Guru
--------------------------------------------------------------
Disclaimer!
This post does not provide financial advice. It is for educational purposes only!

Maximize Your RR By Buying High In The Bearish Gold MarketIn this idea I will explain how to trade gold, now that we have information directly after the market has opened.
Now that the gold market is open again, we can immediately see the bearish trend of the gold price. The price went down about 1% and reached $1720 within only a few hours.
This is an indication to me that the recent uptrend of gold will be over for a while, and that we're looking for a small consolidation.
I charted a scenario here that can monetize this behavior, by using the newly found horizontal resistance area.
If we look at the previous gold idea here with the symmetrical triangle
We can see that the price moved according to the bearish scenario, but didn't go down all the way to the support zone. I suggested to cancel that trade as the technicals are no longer valid, and now suggest to move to the current set-up where with a bearish signal, you should try to get a buy in as high as possible, to maximize your risk reward.
Follow me for consistent high quality updates, with clear explanations and charts.
Please like this post to support me.
- Trading Guru
--------------------------------------------------------------
Disclaimer!
This post does not provide financial advice. It is for educational purposes only!

Add This To Your Chart Before Trading Gold This WeekAll info and explanations can be found on the chart. I literally do all of this for free, a thumbs up would be really appreciated if you like my work.

BTC Reaching Text-Book Bear Flag [In-Depth Explanation]In this idea I will explain the current price action on BTC /USD and go into depth on how we can identify a 'Bear Flag'. Finally, I will explain how to trade this pattern. Continue reading to learn more about this!
----
Hi everyone!
I'm back with another analysis here on BTC /USD. I haven't been posting actively on Tradingview for the last few weeks as I was busy working on a really great new crypto indicator for Tradingview (I published it under my name, you can find it on my scripts). Also, I have started to spend more time writing down educational content for all of you on the most important indicators. Follow me on Tradingview to make sure you get the notification when I publish the guides!
Here on BTC /USD we can find a bearish pattern called a 'Bear Flag'. A Bear Flag can be found during a downtrend where a sudden price drop is followed by a narrow trend range in an ascending channel where the price is oscillating between the top resistance line and the bottom support line. The continuation of such a pattern is usually followed by a very similar harsh downtrend that started prior to the ascending channel . The name of this pattern comes from the resemblance of an inverted flag on a pole.
On the right hand side you can see the theoretical way such a pattern plays out. This text-book bearish pattern can then be monetized by understanding the expected price behavior that gets translated into the practical use-case on the left. Obviously, for a bearish pattern you would enter a short position. But let's go a bit more into depth on what possible entry positions would be.
For the entry position, I'd stay with the text book movement and expect a decline from the top resistance line. A logical place would be around the $9500 level. This is a good place to enter a short position.
For the take-profit, you can utilize other information on the chart, such as this horizontal support zone. A great place to leave the trade is around $8850.
Follow me for consistent high quality updates, with clear explanations and charts.
Please like this post to support me.
- Trading Guru
--------------------------------------------------------------
Disclaimer!
This post does not provide financial advice. It is for educational purposes only!

STEEMBTC Massive Volatility Increase After Controversial UpgradeThere is a lot of news around Steem recently. Binance expressed clear concerns around their blacklisting procedure and doesn't even want to support their latest upgrade.
All of this has been translated into massive price action, crazy volatility, and large volume spikes.
All-in-all: happy times for trades like us!
We do see some interesting patterns within all of these pump and dumps, and if you're feeling FOMO I suggested a set-up here for you how you could also try to enter a trade and benefit from some of these juicy gains.
Follow me for consistent high quality updates, with clear explanations and charts.
Please like this post to support me.
- Trading Guru
--------------------------------------------------------------
Disclaimer!
This post does not provide financial advice. It is for educational purposes only!

Huge MFI Divergence, Long Now or Never Come Back...As you can see from the chart, MFI in the daily timeframe has a huge divergence.
I think the bearish movement is over, we shall see 1.10 soon as bears are losing their selling power.

XRP/BTC - Short the Bearish Restest!We see a very interesting support zone on the daily here on XRP/BTC. This zone has been important already 4 times before in the last year. Now, XRP has seem some negative news lately and broke through this incredibly important support level.
Through an S/R Flip we can trade this symbol with a short set-up. The previous support might turn into a new resistance, which is a bearish scenario we can monetize with a short. I gave some suggestions for stop loss, entry, and take profit in the chart.
Remember that the closer you buy near the old support zone, the better your risk-reward will be.
Follow me for consistent high quality updates, with clear explanations and charts.
Please like this post to support me.
- Trading Guru
--------------------------------------------------------------
Disclaimer!
This post does not provide financial advice. It is for educational purposes only!

New Pairs Trade (Long PEP vs Short MNST)Hey traders, today I share a pairs trade I put on, going long $PEP and short $MNST in equal amounts betting on a reversion to the mean in the next couple of days and with a tight stop loss to limit the downside.
These are two similar stocks which make for a great pair and you can see on the Range Strength indicator the pair is currently trading in a strong range which is what we want to see before we take a signal from the Buy Sell Bands.
Stay tuned as i'll be updating this trade idea as it progresses.
Have a great weekend!
Jared

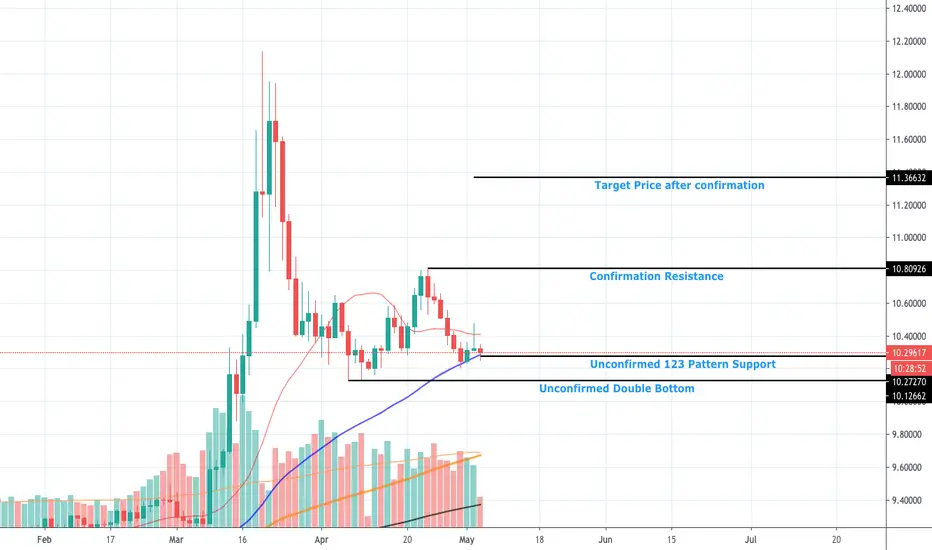
USDNOK LongIt is forming unconfirmed 123 pattern. Needs to break confirmation resistance to reach the target price.
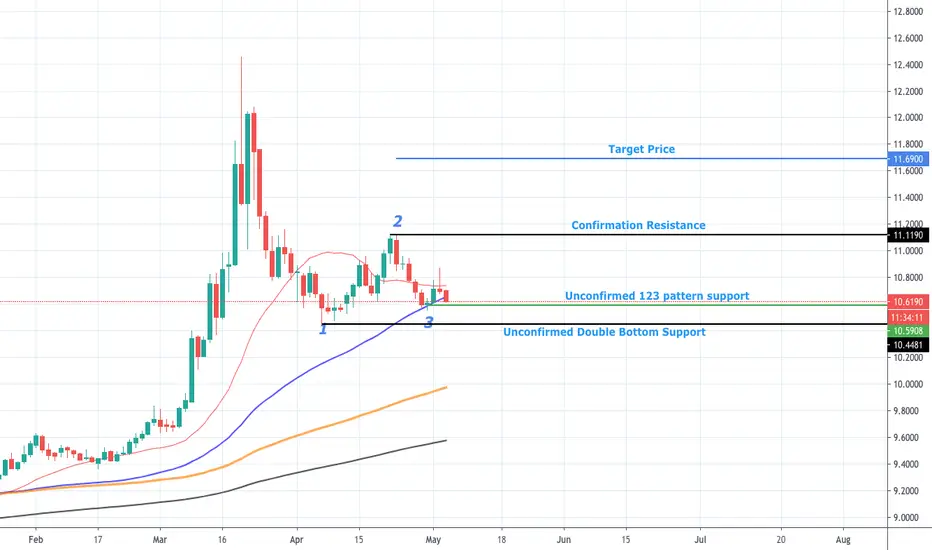
CHFNOK 123 Pattern LongIt is important how it will close today. It is unconfirmed 123 patter so far.
USDCAD Double Bottom LongIt found support at 50SMA. It is a unconfirmed double bottom. Look for the chart for the details

BTC/USDT Back in Ascending Parallel ChannelIn this idea I will break down the price behavior of BTC/USDT and explain how an ascending channel and a fib retracement are playing an important role.
BTC/USDT was following an ascending channel but just had an attempt to break out of the channel. We have seen strong support again on the 8750 level, an area where the price has traded a lot recently. The price just moved back into the channel, giving this pattern another chance.
When trading an oscillating price between the support and resistance trendlines of an ascending channel, you would want to enter a long position near the bottom of the channel for maximum risk reward.
Since the trend is bullish in such a channel, we can enter the trade with a bullish bias, making it more favorable to long the supports than to short the resistances.
Also, if we look at the fibonacci retracement, we can see that taking the low from 16th of April to the high of 30th of April, the .236 level is very important.
The price has stuck to this line very often, finding resistance or support near this region. This time it was support during the fake out. This gives us more reason to believe a long position now is a safe bet, and that the bulls will protect us if bears suddenly try to push the price down.
Follow me for consistent high quality updates, with clear explanations and charts.
Please like this post to support me.
- Trading Guru
--------------------------------------------------------------
Disclaimer!
This post does not provide financial advice. It is for educational purposes only!

BTC/USD RSI Overbought Strategy In this idea I will look into detail how the Relative Strength Indicator has been behaving recently and how it can help us to predict the price of BTC.
The RSI is a momentum indicator. If it increases above the value of 70 we can call it an 'overbought RSI'. This indicates that the price has received an unsustainable upward price momentum, and we expect the price to quickly move back to a more balanced RSI. The neutral RSI is 50.
If we look at the recent 15m behavior of BTCUSD we can see that the RSI has been overbought three times. After each time a sharp drop in price occurred. Now that the RSI just had another overbought signal, we can make a prediction on the extension of this behavior and monetize the scenario by adding a short trade set-up.
I chose the closest price support level for the take profit of the short, to have a maximum probability of reaching our profits.
Follow me for consistent high quality updates, with clear explanations and charts.
Please like this post to support me.
- Trading Guru
--------------------------------------------------------------
Disclaimer!
This post does not provide financial advice. It is for educational purposes only!

EUR/GBP LONG After a very bullish close on Friday, I have taken a long position in this pair. I expect this pair to potentially move all the ay up to 0.9300 area over the long term.
I will be looking to scale out some of my positions as previous highs and will being my stop to breakeven at the alert.
If you want to learn more, please follow me on here or on Instagram @saxonpooley. I produce free weekly outlooks every weekend, where I break down key areas on a pairs I am watching.
I also teach people how to trade so if you are keen to learn, feel free drop me a message!
Saxon

ETH/USD Detailed View on Next Buy AreaIn this idea I will explain break down the price behavior of ETH/USD and explain how an ascending channel and psychological support lines can be used to find the next area Ethereum will find support. On this area you will be able to enter a long position trade.
In my previous idea I went into more details how I expect ETH/USD to move towards $240 over the coming month. Also, I explained the importance of psychological support and resistance levels and explained the ascending channel ETH is in at the moment:
In this idea I want to zoom in a bit and look at the 15m timeframe. This explains further the importance of the lines I drew on the 4h chart, such as the middle line of the ascending channel that has acted as support before as well.
There are two options now, the price might find support already on the middle line, after which we can enter a long trade. However, I personally want to wait until the price drops closer to the bottom of the channel and plan to buy near the psychological support of $200. This level has caused much volatility before, and I think many people will put their stop loss around this area.
This is usually a great place to position your longs.
Follow me for consistent high quality updates, with clear explanations and charts.
Please like this post to support me.
- Trading Guru
--------------------------------------------------------------
Disclaimer!
This post does not provide financial advice. It is for educational purposes only!
