Palantir Technologies | PLTRPalantir stock is set to pop in the next year as the tech firm erects an artificial intelligence "fortress" that will help it become one of the biggest players in the AI race in the coming decade, Wedbush Securities analysts wrote on Friday.
According to Wedbush's Dan Ives, Palantir is headed to $25 a share in the next 12 months. That represents a surge of 54% from Thursday's closing price of $16.15. Shares were up 5.7% at $17.07 early Friday.
The data software firm, which has been funded in part by the CIA's In-Q-Tel venture capital arm, is the "Messi" of AI, Ives said, referring to Argentine soccer superstar Lionel Messi.
"As we begin the 4th Industrial Revolution, Palantir is engaging in the widespread trend of various industries leveraging recent generative AI innovations to streamline operations and improve expense profiles," the Wedbush analysts wrote. Given Palantir's wide roster of partners in both the public and private spheres, Wedbush sees the next six to 12 months as a period of significant expansion for the company as it serves the growing demand for enterprise-scale large language AI models.
"This is early innings on a sum-of-the-parts AI story just on the cusp on monetizing this massive green field AI opportunity," it predicted.
Palantir CEO Alex Karp has been a vocal proponent of the rapid development of AI even in the face of risks associated with the technology.
In an op-ed for the New York Times this week, he wrote that AI will shape political developments in this century in the same way that nuclear weapons drove geopolitics in the last century. He cautioned that there are risks, but they should not deter the continued advancement of AI. "If these technologies are to exist alongside us over the long term, it will also be essential to rapidly construct systems that allow more seamless collaboration between human operators and their algorithmic counterparts, to ensure that the machine remains subordinate to its creator," he wrote. "We must not, however, shy away from building sharp tools for fear they may be turned against us."
Palantir is one of the most popular stocks, and for many, it's been a wild ride. Since the direct listing, investors have seen shares skyrocket to the high FWB:30S , crash to $5.84, and ride the AI boom back to the high teens. I invested in PLTR at the direct listing and purchased shares on the way up and as they declined in price. I was vocal about my dissatisfaction with how Alex Karp handled what has now become the infamous Q2 2022 conference call and became bullish again as PLTR turned things around. 2023 has been a strong year for PLTR as shares have increased by 182.47% YTD. Some investors have done well, while others got back to even or chipped away at the losses. Since May 5, shares have appreciated by 143.59%, appreciating from $7.41 to $18.05. Q2 2023 earnings are around the corner as PLTR is set to report post-market on August 7. Shares can continue higher into earnings and continue throughout 2023 if PLTR delivers growth across its revenue, earnings, customers, and contracts while maintaining its Q2 free cash flow (FCF) margins. In this article, I will discuss what I am looking for in the Q2 2023 earnings report and provide some insights as to what I think shares of PLTR could be worth in the future.
In 2021, PLTR made 45 official announcements through its website newsroom, and in 2022, PLTR had 44 announcements. PLTR has been busy in 2023; through July 18, they have made 26 official announcements. This doesn't include any of the blog posts PLTR has written discussing the work their conducting. I continuously research these aspects as they provide insight into what will be discussed on the earnings call and in the 10-Q. In Q2 2023, PLTR posted 14 press releases and another four in July. For PLTR to continue its growth trajectory, it needs more adaptation of its products in the government space as well as the private sector.
I expect PLTR to deliver strong growth numbers as there have been significant partnerships announced since April 1. On the government side, Palantir announced two deals with government entities in Ukraine, including the Prosecutor General's Office of Ukraine and the Ministry of Digital Transformation of Ukraine. PLTR announced that Ukraine would utilize its technology to support the defense and reconstruction of the country and empower Ukraine investigators with critical data processing tools regarding 78,000 registered war crimes. US Special Operations Command entered a multi-year contract worth up to $463 million to expand its enterprise capabilities.
On the commercial side, PLTR expanded its cloud partnership with Microsoft (MSFT), entered into an agreement to build an integrated management flow system on top of Foundry for CA Modas S.A, and expanded its partnership with Jacobs Solutions (J). These partnerships are critical because it will allow PLTR to expand throughout several sectors through some of the largest counterparts. I expect the Jacobs and Microsoft partnerships to be extremely beneficial in the coming years as more companies look to create value by enabling AI and moving toward data-driven decisions.
PLTR guided for revenue to come in at $528-$532 million in Q2 and revenue of $2.185-$2.235 billion for the full year. In Q1, PLTR delivered $525.2 million in revenue which is 24.04% of the low-end estimates and 23.5% of the high-end estimates for 2023. For PLTR to meet its 2023 full-year revenue guidance, it would need to generate an average of $553.27 million in Q2–Q4 to meet the low-end projection and an average of $569.94 to meet the high-end estimates.
I expect PLTR to deliver at least $550 million in revenue for Q2 and discuss how they will increase incremental revenue throughout the year as more contracts continue to be initiated on an ongoing basis. If we see anywhere from $550-$575 million in revenue for Q2, it would be a strong indication that the high-end estimates will be met or exceeded when they report their 2023 fiscal year numbers. If PLTR records $550 million in Q2, $575 million in Q3, and $601 million in Q4, PLTR will generate $2.25 billion in annual revenue for 2023. This would be an average QoQ revenue increase of 4.6% over the next three quarters. I think it will be a strong signal coming off the AIP conference if PLTR is on track to beat the high-end estimates, as that would mean PLTR will be moving into the $600 million quarterly revenue bracket sometime in 2023 and inching their way closer to generating over $1 billion in revenue on a quarterly basis.
PLTR has now strung together two consecutive quarters of GAAP profitability and is projecting its adjusted income from operations coming in at $118-$122 million in 2023 and between $506-$556 million for their fiscal year. In Q1 2023, PLTR generated $125.11 million in adjusted income from operations, which is 24.73% of the low-end projection and 22.50% of the high-end estimate. This would mean that PLTR would need to increase its adjusted income throughout the year to meet its annualized projections.
I dislike adjusted numbers and prefer free cash flow (FCF) as it's harder to distort than other profitability measures. In Q1, PLTR generated $188.9 million in adjusted FCF, which is a 36% margin. PLTR's true FCF number was $182.6 million, as they generated $187.4 million in cash from operations and allocated $4.8 million toward CapEx. This places PLTR's FCF margin at 34.77%, which is the largest margin they have operated at since becoming a publicly traded company.
I have previously indicated that I believe PLTR can replicate similar growth to Salesforce (CRM). CRM currently has a market cap of $223.51 billion and, in the TTM, has generated $32.19 billion of revenue and $7.06 billion in FCF. Mr. Market is valuing CRM at a 6.94x multiple on sales, and 31.64x FCF. CRM has seen explosive growth over the last decade as its grown its revenue by 690.67% and its FCF by 1,125.54%. Including the TTM, CRM has operated at a 20.57% FCF margin over the previous five years.If PLTR finishes on the high-end of their revenue estimates for 2023 they would deliver $2.25 billion in revenue. PLTR's previous projections placed their 2025 revenue at $4 billion or more and I don't recall seeing updated estimates. If PLTR comes in on the high end of the 2023 projections and generates $2.25 billion, its YoY revenue growth would have decelerated from 41.11% in 2021 to 23.61% in 2022 and 18.12% in 2023. Hypothetically, if PLTR can grow its revenue at a 15% YoY basis over the next decade from 2024–2033, it would generate $2.98 billion in revenue for 2025 and $9.12 billion in 2033. At a 33% FCF margin in 2033, PLTR would generate $3 billion in FCF. At a 32x multiple on FCF, PLTR would be valued at $96.17 billion.
If PLTR can maintain an 18% YoY revenue growth rate and maintain a 33% FCF margin, PLTR will generate $11.78 billion in revenue and $3.89 billion in FCF in 2033. At a 32x FCF multiple, PLTR would be valued at $124.42 billion. If PLTR was to grow at a quicker pace of 21% YoY on average, they would generate $15.15 billion in revenue and $5 billion in FCF in 2033. Assigning a 32x multiple on their FCF would place PLTR at a $159.93 billion valuation.
Based on these assumptions, PLTR could grow between 151.49%-318.23% over the next decade, which would be an annualized return of 15.15%-31.82%. These are just assumptions regarding what could occur and why I feel PLTR could be a good long-term investment.
For those who think a 32x multiple on FCF is a crazy valuation, I am going to place a table below. Based on the current market caps, big tech has multiples from 31.29x to 221.31x. Putting the outliers aside, it's not uncommon to see companies trade in the 40x range. Even companies such as the Coca-Cola Company (KO) trade at a 29.90x multiple and PepsiCo (PEP) trade at a 45.41x multiple on FCF.
Palantir

PALANTIR Sell signal at the top of the 15-month Channel Up.Palantir (PLTR) gave us a solid buy signal 3 months ago (June 24, see chart below) as it respected the recurring bottom sequences within the 15-month Channel Up:
Right now the price has been consolidating after a direct hit at the top (Higher Highs trend-line) of the Channel Up. The 1D RSI got overbought and started pulling-back on a standard Bearish Divergence, a formation which three time within this pattern turned-out to be a solid sell signal.
The dashed Channel Up gives us a short-term Target on its bottom, which is where the 1D MA50 (blue trend-line) is trading at and is the short-term Support. That is our Target currently (Target 1 = 34.50).
If and only if, we close a 1D candle below the 1D MA50, we will open a new sell, as it will be a bearish break-out signal. In that case, we will target a potential near contact with the 1D MA200 (orange trend-line), which is the long-term Support and where the remarkable buy entries of August 05 and January 31 were provided (Target 2 = 29.50).
Keep in mind that the most optimal buy entry for the long-term (since May 2023) has been given by the 1D RSI and more specifically when it hits its Support Zone. We will continue to place buy long-term buys accordingly.
-------------------------------------------------------------------------------
** Please LIKE 👍, FOLLOW ✅, SHARE 🙌 and COMMENT ✍ if you enjoy this idea! Also share your ideas and charts in the comments section below! This is best way to keep it relevant, support us, keep the content here free and allow the idea to reach as many people as possible. **
-------------------------------------------------------------------------------
💸💸💸💸💸💸
👇 👇 👇 👇 👇 👇

Palantir Technologies and a strong look into its FundamentalsNYSE:PLTR is one of the most popular stocks of the last 2 years , and not for no reason being a high revenue growth stock "16.8% Growth Rate" , My personal problem with the stock lays with the valuation holding a PE Ratio of 201x, and a forward PE Ratio of 172.5x, a 20.1x Price to Books Ratio, and a 32.8x Price to Sales (Revenue) Ratio. an interesting Return on Equity of 10% , A Return on Assets of 4.6% , And an Return on Capital Employed of 6.7% , with Net margins of 16.3%. Being Completely "Debt" free according to there Balance Sheet
--------------------------------------------------------------------------------------
Valuation:
PE Ratio: 201x
Forward PE Ratio: 172.5x
Price to Sales: 32.8x
Price to Books Ratio: 20.1x
-----------------------------------
Balance Sheet:
Cash: US$4.00b
Debt: US$0
Equity: US$4.14b
Total Liabilities: US$1.05b
Total Assets: US$5.19b
-----------------------------------
Strengths and Weaknesses:
The Valuation to me personally is a weakness, however the Balance sheet is a Strength in my view. I think based on the price I currently would wait to add this one to my own portfolio however all investors and traders are different.
-----------------------------------
Disclaimer: I am not a financial advisor and in no way am I signaling a sell, buy, or hold opinion on this stock (Palantir Technologies) I am just giving my personal opinion as a hobby trader, I have no certifications and I am not a financial analyst, I also may be wrong about how I feel about the stock. I want you to do plenty more research on this and the stocks you are interested in because the stock market always holds a lot of risk that may pose different risks and overall be different for each investor and trader. Please do not make opinions based on this idea or any idea. Please be careful! this post is only for conversation.
-----------------------------------
Idea:

Palantire on the way to $30Palantire is on the way to $30. The current pull back is good opportunity to join in the journey.

PLTR: Will SP500 entry boost stock price to target?PLTR ending diagonal is taking time and stretching out. The last few weeks have been forming a bull flag and now the news of SP500 entry is poised to push the share price higher. On an expanding diagonal, wave 5 is expected to be longer than wave 3. So, the price target puts it to over $40 or higher. My plan hasn't changed. My long term load target will come after the intermediate degree wave 1 is complete. Short term, I am looking for a long entry to catch the next wave. Broader market is getting pretty weak, so, a bounce is expected. PLTR will most likely take the crown during that bounce.

Technical Analysis on Palantir Technologies Inc (PLTR)Palantir ( PLTR ) is currently in a short-term bullish phase, as indicated by the green trendline, which began in May 2023 with the breakout of the descending trendline (orange) accompanied by a gap up and increasing volume.
The stock has recently broken above the resistance zone R1, which it is currently retesting.
Bullish Scenario:
A short-term bullish scenario would see a move toward the next resistance level R2 in the $38-$40 area.
Bearish Scenario:
If the retest of resistance R1 fails, the stock could move towards the support areas, where potential entries could be considered if one anticipates a rebound:
The POC area around $24;
The weekly support S1;
The weekly support S2.
The support zones S2 and S1 are more clearly visible on a monthly timeframe:

$PLTR | Allocation | Buy Limit | Technical Confluences:
Price is in Overbought conditions in the Weekly Timeframe (Will take time to play out)
Price action bounced off 3 Resistances; Horizontal Trendline, top range of a Parallel Channel and the top of a Supply Zone
Fundamental Confluences:
PLTR's specialized software platorms that are complex yet scalable in it'sdata handling capabilities gives them their edge
Competitors have yet to catch up to NYSE:PLTR 's advancement but competition is starting to build against them from other big tech firms
The growth potential in data analytics is massive and it has not include massive global expansion
A large portion of their revenue depends on government contracts which is stable but is susceptible to any changes in government and their policies (something to watch for)
-----
This counter is a one that I had enter prior to this as shown.
The story for NYSE:PLTR in the data analytics field is something that must be held in a long-term portfolio.
At the moment, I don't see NYSE:PLTR breaking up above the 3 resistances and am expecting a reversal which I will place Buy Limit orders (as shown) to allocate more into this stock.
-----

PALANTIR Correction starting. Short or wait to buy on that levelPalantir Technologies (PLTR) have been trading within a Channel Up since the May 04 2023 Low. Last week the price reached the pattern's top (Higher Highs trend-line) and technically we expect that to be the end of the recent Bullish Leg, as also indicated by the Sine Waves.
Naturally we anticipate a medium-term pull-back in the form of a Bearish Leg. The previous 3 Bearish Legs have been under the form of Lower Highs that broke below the 1D MA50 (blue trend-line) and hit at least the 1D MA100 (green trend-line) before rebounding again into a new Bullish Leg.
As a result, we expect to see at least a test of the 1D MA100, which short sellers can target $26.00. This is also above the minimum %correction we've seen inside this pattern (-25.90%).
The strongest buy signal inside this long-term Channel Up is historically give when the 1D RSI hits the 35.85 - 30.20 Support Zone.
-------------------------------------------------------------------------------
** Please LIKE 👍, FOLLOW ✅, SHARE 🙌 and COMMENT ✍ if you enjoy this idea! Also share your ideas and charts in the comments section below! This is best way to keep it relevant, support us, keep the content here free and allow the idea to reach as many people as possible. **
-------------------------------------------------------------------------------
💸💸💸💸💸💸
👇 👇 👇 👇 👇 👇

Palantir Stock Surges 10% in Premarket Trading on TuesdayKey Takeaways:
- Palantir Technologies shares surged in extended trading Monday after the company reported better-than-expected quarterly results.
- The company lifted its full-year guidance on strong demand for its artificial intelligence platform.
- Palantir reported second-quarter revenue of $678.13 million, a 27% year-over-year increase, and net income of $134 million.
- CEO Alex Karp highlighted "unbridled demand" for Palantir's software as a key driver for the strong quarter.
In a significant market move, shares of Palantir Technologies Inc. (NYSE: NYSE:PLTR ) soared in premarket trading on Tuesday following the company's announcement of its second-quarter earnings. The data analytics giant exceeded Wall Street’s expectations, reporting a record high in quarterly earnings per share, driven by robust demand for its Artificial Intelligence Platform (AIP).
Earnings Beat Expectations
Palantir reported second-quarter revenue of $678.13 million, marking a 27% increase compared to the same period last year. This figure surpassed analysts' estimates compiled by Visible Alpha. Net income for the quarter stood at $134 million, translating to an earnings per share (EPS) of 6 cents, which also exceeded projections.
CEO Alex Karp attributed the strong performance to an "unbridled demand for and understanding of the capabilities of our software." The company’s commercial revenue saw a notable increase of 33% to $307 million, with U.S. commercial sales growing by 55% to $159 million.
Strong Full-Year Guidance
Palantir’s positive momentum is reflected in its optimistic guidance for the remainder of the year. The company now anticipates third-quarter revenue to range between $697 million and $701 million, surpassing analysts' forecasts. Furthermore, Palantir has revised its full-year revenue guidance upward to between $2.74 billion and $2.75 billion, up from the previous range of $2.68 billion to $2.69 billion.
Market Reaction and Future Outlook
Despite initial volatility, with shares opening 12% lower on Monday, Palantir staged an impressive intraday reversal. This move, marked by the highest trading volume since early May, suggests that larger market participants may have anticipated a significant earnings-driven move.
Technical Analysis: Key Price Levels
Looking ahead, investors should monitor key technical levels where Palantir (NYSE: NYSE:PLTR ) shares could face selling pressure. The $27 to $29 range is crucial, as it represents a resistance zone from trendlines connecting multiple swing highs since December 2020. A decisive close above this range could pave the way for a move towards the $39 level, where sellers might lock in profits near the February 2021 swing high.
A more bullish scenario could see Palantir retesting the $45 region, challenging its record high set in late January 2021. For long-term investors, projecting a target above the all-time high (ATH) using historical trends suggests a potential price target of around $50.50.
Conclusion
Palantir Technologies continues to solidify its position as a leader in the AI-driven data analytics space. With its robust quarterly performance and increased full-year guidance, the company is well-positioned to capitalize on the growing demand for its AI platform. Investors should keep an eye on key technical levels as Palantir navigates its next growth phase.

Palantir: Resistance Palantir has fallen back below the previously broken resistance at $27.50. Despite the current difficulties with this level, the rally should continue soon with the green impulse wave being expanded further north.

PALANTIR Still not late to BUY if you missed it.Palantir (PLTR) has been one of our best performers on our stock portfolio, with the last 3 signals since December 2023 (see charts below), being spot on:
The last one is the more recent (May 02) and as you can see, the Inverse Head and Shoulders (IH&S) pattern right at the bottom of the 1-year Channel Up is following our expected course very closely and is on its way to hit the $29.00 Target.
We see that the delivery of this new Bullish Leg is through a Bullish Megaphone seeking the lower Support cluster of the 4H MA50 (blue trend-line) - 4H MA200 (orange trend-line) - 1D MA50 (yellow trend-line). We are expecting $29 within 30 days.
-------------------------------------------------------------------------------
** Please LIKE 👍, FOLLOW ✅, SHARE 🙌 and COMMENT ✍ if you enjoy this idea! Also share your ideas and charts in the comments section below! This is best way to keep it relevant, support us, keep the content here free and allow the idea to reach as many people as possible. **
-------------------------------------------------------------------------------
💸💸💸💸💸💸
👇 👇 👇 👇 👇 👇

PLTR, expect new SERIES OF HIGHS in the next coming months!PLTR Growth Momentum hasn't waned a tiny bit. The stock keeps ranging at the 52 wk high most of the time suggesting an "Alpha" stock characteristic. Yesterday's price movement was another testament of buyer's weighty positioning of this soon-to-be-massive-valuation stock. It is named the future MSFT of today's era.
The recent price growth (+6% yesterday's session) was augmented by another good news:
Palantir (NYSE:PLTR) recently acquired about 6 million more shares of Rubicon Technologies (NYSE:RBT), bringing its stake in the firm to 6.2%. Palantir’s purchase of the shares appears to have been required by a deal that the company signed with Rubicon last year. As of this writing, PLTR stock is up by about 5%.
Palantir creates and markets data analysis tools. Meanwhile, Rubicon operates “a digital marketplace for waste and recycling service.” Rubicon is also one of Palantir’s customers.
In our monthly chart, Histogram is recording 5 straight months of ascend -- talk about 'value' strength of this stock. On tri-monthly data, the elusive bottom line shift has appeared after 3 years. This is already a huge hint of the momentum going upside. Net buy volume has surged an impressive 20+ % and it continues to grow on a weekly basis.
Coming QTR2 earnings (Aug. 2023) results is expected to come in 'green' at $536M.
Expect more significant price growth for PLTR. And it's not all hype, there is meat into it.
At current valuation, it is still a bargain in my opinion. A 3-digit valuation in the future will not be farfetched based on metrics and progressive developments on the company.
Spotted at 17.00
TAYOR
Safeguard capital always.

Palantir Cup and Handle Weekly ChartNYSE:PLTR Palantir Cup and Handle Weekly Chart:
It appears Palantir has developed a cup and handle pattern on the weekly chart and with momentum building it could get over the resistance it has seen at the 27 -28 level. It is a newer stock so one of the C&H rules is the entire pattern forming above the 200-day average market price I have in Green the 40 week average which is a close equivalent and it fails that rule.On the other hand It does form over roughly 24 months, it did have a decrease in volume over the handle development, the buy signal is when the price breaks above the handle’s resistance with increased volume. Technical analysis can and will fail due to other market forces. In my opinion short to mid term we could test 30 as a good start developing support long term it could see 40.

#202425 - a weekly price action market recap and outlook - pltrGood evening and I hope you are well.
Let's do some single stock trading ideas. Palantir.
comment: The stock that lives on hopes and dreams of people who know few about IT and much less about data & analytics, much like Snowflake. Go look at the Snowflake chart. When I have read the ipo price in 2020 I told everyone it was a bubble and the stock should trade below 100 for many years until maybe big profits could come in. They are still years away from those big profits and the stock lost 49% from the IPO price. I do not know anyone who works in Data & Analytics and knows Palantir who tells anything positive about them. It's a hype stock that got good publicity because of investors and defense contracts. That stock will trade below 15 in either late 2024 or 2025. Not financial advice.
current market cycle: My dead dog can tell you it's a traingle and that is a form of a trading range and market is in breakout mode. Your job is to wait for the breakout and hop along, that's it. Now set the same alerts as I have and make money once they ring.
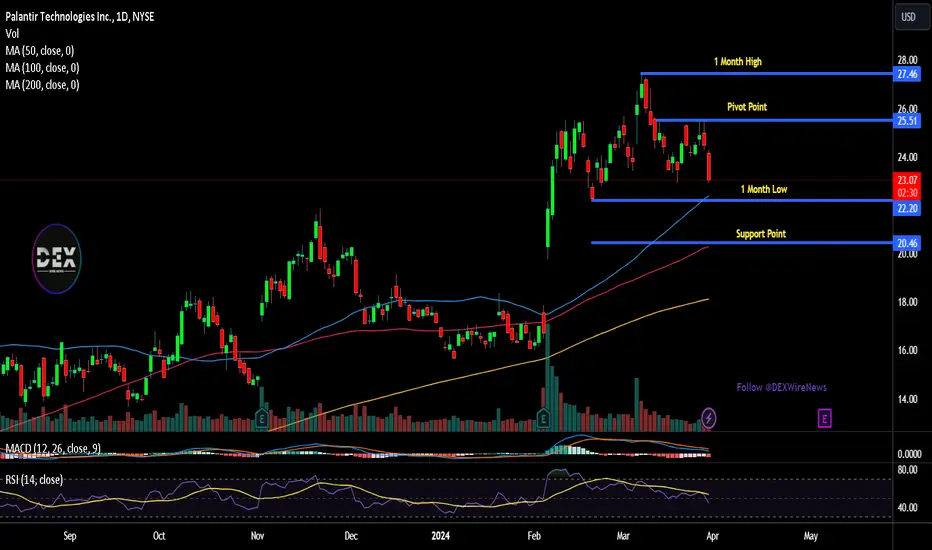
key levels: 20 - 27
bull case: Market is getting rejected at the 50% pb from all time low to all time high. That's bearish af. Only chance bulls have for this to trade back up is a weekly close above 27. Bulls have going for them, that there seems to be big passive buying at 20.50. They are also trading above the daily and weekly 20ema, which is also bullish.
Invalidation is below 20.
bear case: Once that buyer at 20.50 gives up, it's free fall. The triangle will probably play out and we see some downside from 23 to 20/21 again in the short term. Last earnings surprised upwards and bulls used that spike as exit liquidity. Tells you something.
Invalidation is above 26.
short term: bearish for trade back down to 20/21. Short term in this case means several weeks, since I'm posting the weekly chart.
medium-long term: I don't know which way the triangle breaks down to but either way, you can clearly see the big lows and highs. One of those will probably get retested before the other. So set the alarms and trade it when it breaks out.
I hope my insrted illustrations help you.

PLTR: What is this craziness?PLTR price action has gone crazy this week. First, the H&S pattern failed when $19 target failed and pushed above the neckline; creating an inverse H&S pattern. The target for inverse H&S pattern almost got hit, but then the post earning shenanigans began. Price has fallen through the neckline once again and if the last low of $20.20 breaks, then it will be enroute to test 0.618 fib retracement area of $15.29.
In the grand scheme of things, anywhere between $15 to $17 would be a fantastic buy area. If we are fortunate, then this correction would extend, and price will get down to the golden pocket $10.5 area. It could take the rest of the year to play out, but I will start to accumulate shares and setup some option plays to get my bag going. I think the fundamentals of the company remains unchanged and long term it is a triple digit stock. So, anything is a gift and DCA is the way to go.

PLTR Palantir Technologies Options Ahead of EarningsIf you haven`t bought PLTR before the previous earnings:
Then analyzing the options chain and the chart patterns of PLTR Palantir Technologies prior to the earnings report this week,
I would consider purchasing the 23usd strike price Calls with
an expiration date of 2024-5-17,
for a premium of approximately $1.99.
If these options prove to be profitable prior to the earnings release, I would sell at least half of them.

PALANTIR bottomed on this Inverse Head and Shoulders pattern.Palantir (PLTR) easily hit our $24.50 target last time we published a call with you here (February 06 2024, see chart below) and shortly after started to correct:
The price has now hit and rebounded on the 4H MA200 (orange trend-line), forming so far an Inverse Head and Shoulders (IH&S) pattern, which is technically a bottom formation. This is the very same pattern that was formed on both previous bottoms of the 1-year Channel Up.
On top of that, it broke and re-tested the Lower Highs trend-line, which again on both previous bottoms, it was a successful buy signal. In addition, the 1D RSI rebounded on the 1-year Support Zone.
We are currently on that exact time within the 4H MA50 (blue trend-line) and 1D MA50 (yellow trend-line). A closing above the latter, should be the final buy confirmation. Our medium-term Target is $29.00 which represents the 1.236 Fibonacci extension, which was where the November 21 2023 Higher High was priced.
-------------------------------------------------------------------------------
** Please LIKE 👍, FOLLOW ✅, SHARE 🙌 and COMMENT ✍ if you enjoy this idea! Also share your ideas and charts in the comments section below! This is best way to keep it relevant, support us, keep the content here free and allow the idea to reach as many people as possible. **
-------------------------------------------------------------------------------
💸💸💸💸💸💸
👇 👇 👇 👇 👇 👇

Cathie's Ark Invest Buys Palantir Stock Ahead Of Q1 Earnings Cathie Wood's Ark Invest, renowned for its bold investment strategies and forward-thinking approach, made significant moves in its portfolio ahead of Palantir Technologies Inc.'s ( NYSE:PLTR ) Q1 earnings announcement. With an eye on emerging trends in AI and technology, Ark Invest seized the opportunity to bolster its holdings in Palantir ( NYSE:PLTR ) and other key stocks, signaling confidence in the companies' growth prospects.
Strategic Accumulation of Palantir Stock:
Ark Invest's ARK Autonomous Technology & Robotics ETF (ARKQ) initiated a flurry of trades, acquiring a substantial number of Palantir shares in anticipation of the company's first-quarter results. The purchase of over 100,000 shares, coupled with additional acquisitions from previous sessions, underscores Ark's bullish stance on Palantir's AI-driven solutions and their potential to drive future growth.
Anticipation for Palantir's Q1 Earnings:
As Palantir ( NYSE:PLTR ) prepares to unveil its Q1 earnings on May 5, analysts project positive results, with expectations of increased earnings per share and revenue compared to the previous quarter. Ark Invest's strategic accumulation of Palantir ( NYSE:PLTR ) stock ahead of the earnings announcement reflects confidence in the company's ability to deliver strong financial performance amidst growing demand for its innovative technologies.
Diversified Portfolio Expansion:
In addition to Palantir ( NYSE:PLTR ), Ark Invest diversified its portfolio with strategic investments in Meta Platforms Inc. (formerly Facebook) and Roku Inc., seizing opportunities presented by market fluctuations. Despite market volatility, Ark Invest remained undeterred, capitalizing on the sell-off of Roku shares to acquire a significant stake in the streaming equipment maker, demonstrating conviction in its long-term growth prospects.
Embracing the Electric Vehicle Revolution:
Ark Invest also expanded its footprint in the electric vehicle (EV) sector, shifting focus to BYD Co. Ltd., a prominent player in the EV market. With Warren Buffett's Berkshire Hathaway holding a stake in BYD, Ark Invest's investment in the company underscores confidence in its potential to disrupt the EV landscape and contribute to ARKQ's portfolio growth.

PLTR: Correction has begunI have been waiting for a correction in the stock since selling out of it in early February. There has been a couple of months long distribution pattern formation and now a confirmed breakdown this week. I had been short for a couple of weeks and second guessing myself a few times because bulls were heavily defending the neckline for H&S pattern. It almost formed a re-accumulation pattern and a falling wedge, almost shaking me out of my short position. I am glad I held on due to the Elliott wave pattern and now comfortably sitting on a pretty good cushion. I am planning to get out before the B wave bounce starts, which I think will be at the 0.764 retrace area at $19 which is also a very large volume support. After that will look for a 3 wave bounce. Then possible short again for a 5 wave down move down between $19 and $15 area. I am not sure if the retracement will be deep or not, but there is a lot of geo political turmoil going on, which might favor the stock. Whatever it might be, I think between $15 and $10 will be a great once in a decade buy, something like Tesla back in 2012. There is however a chance that all of the rally and this correction is part of a wave B and a very large selloff to single digits or even pennies are yet to come. We will think about that if a lot of things happen first. For now, I am trading my short term bearish, long term bullish plan.

PALANTIR: Best buy opportunity since January.PLTR is bearish on its 1D technical outlook (RSI = 33.299, MACD = -0.640, ADX = 35.931) as it trades under its 1D MA50 and today reached the 1D MA100 for the first time since February 5th. Even though the 1 year Channel Up still has some downside to bottom on its 1D MA200, this is technically the best buy opportunity since the January 31st low as the 1D RSI entered the 1 year Support Zone. This is the 3rd correction inside this Channel and each leg is -4% shorter, so the current -25% correction from the top is a fair Low to buy. The accumulation at the bottom of those corrective waves has been between 4-6 weeks so the market may take its time to accumulate towards the end of May and then rally aggressively. Fair target, the 1.236 Fibonacci extension (TP = 29.00).
See how our prior idea has worked out:
## If you like our free content follow our profile to get more daily ideas. ##
## Comments and likes are greatly appreciated. ##

Palantir: Time to Exit?Upon closer reevaluation of Palantir, we continue to believe that we have not yet completed Wave (2) and that the price should not continue to rise. Our initial hypothesis was invalidated; we first expected to see Wave 5 at $19. Now, we assume Wave 5, or rather Wave (1), at $21.85, having developed Waves A and B, with Wave B at $25.69. This should also form our top and serve as an Expanded Flat, which we set from Wave A downwards. This closely aligns with the 61.8% level, which is highly probable for a Wave (2). Our target range is between $12 and $9.36. We should not fall below this; otherwise, we would consider closing the position down to $7.19, although we deem this unlikely. We believe the price will move within this range. We will place a limit buy order only after observing a significant weakness in Palantir.

Palantir Stock Plummets by 6% Amidst Generative AI Hype CyclePalantir Technologies (NYSE: NYSE:PLTR ) has been on a wild ride in the stock market, experiencing both exhilarating highs and nerve-wracking lows. The latest twist in this rollercoaster journey comes with an analyst downgrade from Monness, Crespi, Hardt & Co., sending the stock plummeting by 6%. The reason? An 'Unprecedented Generative AI Hype Cycle' that has inflated the company's valuation beyond what some analysts consider reasonable.
The Hype Cycle:
Generative artificial intelligence (AI) has been the talk of the town lately, promising to revolutionize industries with its ability to create text, images, video, and even computer programming code autonomously. Palantir, known for its data-mining and analytics prowess, has eagerly jumped on the generative AI bandwagon, aiming to leverage this technology for growth in commercial markets.
Analyst Downgrade:
Brian White's downgrade of Palantir ( NYSE:PLTR ) stock to 'Sell' from 'Neutral' with a price target of $20 reflects concerns over the stock's sky-high valuation amidst the generative AI frenzy. Despite Palantir's significant gains of nearly 43% in 2024, White believes the company's valuation has become "egregiously rich," leaving investors vulnerable to potential downside risks.
Reality Check:
While Palantir ( NYSE:PLTR ) has made strides in capitalizing on the AI trend and expanding its market reach, concerns linger over the lumpiness of government-related contracts and spotty execution. Additionally, the stock's recent retreat from its March high underscores the volatility inherent in Palantir's journey.
Disclaimer: Investing in stocks involves risks, and past performance is not indicative of future results. Investors should conduct thorough research and consult with financial advisors before making investment decisions.
PLTR: Obvious distribution happening, time to buy is coming soonPLTR is stuck in a range. Distribution patterns are forming. RSI is holding on to a critical level. Good new out there is not making any dent to the price action. The ticker has a history of falling off the cliff after being range bound. EW count is suggesting a full 5 wave sequence is complete. So, basically it is time to hurry up and wait. PLTR has just completed the first minor degree wave 1 cycle. It is expected to see a deep correction, but the company fundamentals are very strong. My plan is to watch the EW wave formation in lower timeframes and the fib retrace areas to identify buying zones. I am willing to accumulate as price is going down, because the probability for this stock to go much, much, much, higher is too great to ignore. Price targets will come soon when the correction intensifies.
