PALLADIUM - Potential Bullish Reversal!Hello TradingView Family, this is Richard, if you like the idea, do not forget to support with a like or/and comment.
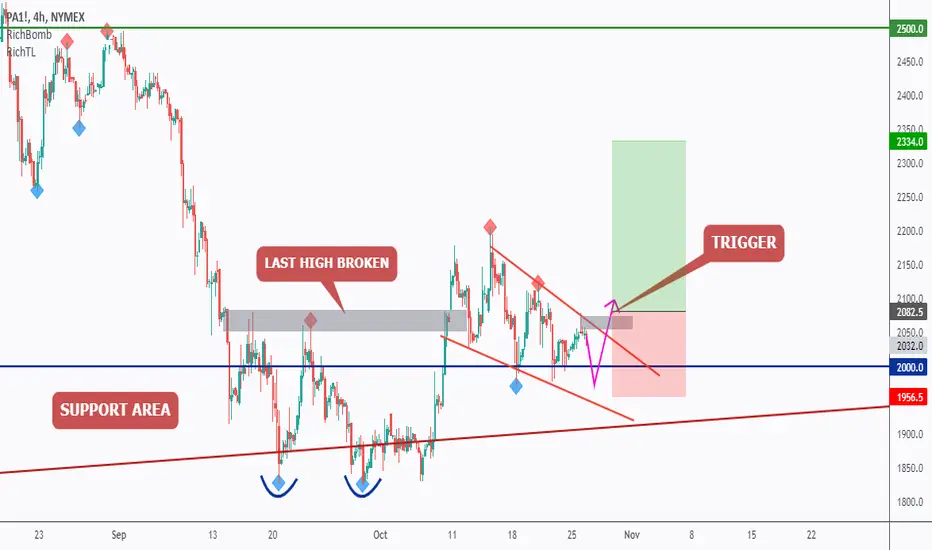
PA1! is sitting around a strong support area and round number 2000.0 so we will be looking for buy setups on lower timeframes.
on H4: PA1! is forming a wedge pattern in red but the upper trendline is not valid yet, so we are waiting for a new swing high to form around it to consider it our trigger swing. (projection in purple)
Trigger => Waiting for that swing to form and then buy after a momentum candle close above it (gray zone)
Meanwhile, until the buy is activated , PA1! would be overall bearish can still trade lower.
Good luck!
All Strategies Are Good; If Managed Properly!
~Rich
Palladium
PalladiumWednesday Morning, 20 October 2021
6:19 AM (WIB)
This is the most interesting ROI with very high risk result. The profits more bigger then Crude Oil and Platinum also Silver. And since the price breaks out from first resistance, I still kept my purchase orders even it hit $2.200. I don't want to wasting time with intraday trading on this. So, I try to review the chart and found beautiful head and shoulder with the most possible to hit back $2.030 area. In this area, I decide to open purchase order again because I believe the Golden Cross in 4 Hours Trading Session, will bring the price fly away high to breaks out the third resistance. But when the formation declines, I will do nothing. And still, the probability for the price to move higher is bigger than fall.
Keep watch and Notes.
Best regards,
RyodaBrainless
"Live to Ride and Ride to Live"

PalladiumWednesday, 13 October 2021
21:46 PM (WIB)
Palladium declined to form Head n Shoulder from the resistance. But prefer to choose upside move with using 1 F as the great confidence to breaks out the highest price that I expect to be at $2.400 to $2.500. Fascinating strategy from Bulls. At this stage, I need to be careful with counter fall, because the price could be testing the highest resistance at $2.175. Since the price moving above middle lines, the buyers intensity of confidence at very high performance.
Best regards,
RyodaBrainless
"Live to Ride and Ride to Live"

PalladiumFriday, 8 October 2021
19:12 PM (WIB)
Palladium since breaks out the first resistance running high with direction to second resistance which it seems as strong resistance at that point. As I said before, I will wait for the price to breaks out that resistance. But, when it comes fall again, I will prepare for another purchase order at first resistance that is going to be as strong support lines.
Best regards,
RyodaBrainless
"Live to Ride and Ride to Live"

PalladiumFriday, 8 October 2021
2:27 AM (WIB)
Palladium just broke up the first resistance with forming an inverse head and shoulder at the ground. I will keep my purchase order until the price reach the second resistance.
At that point, I will try to open sell order. But when the price breaks out the second strong resistance, I will hold my order for long term transaction.
Best regards,
RyodaBrainless
"Live to Ride and Ride to Live"

PalladiumWednesday, 6 October 2021
20:12 PM (WIB)
Palladium just broke $1.848 and still, I'm not interest to open order right now. My expectation is the price should move to the lowest point at $1.820. Where in this price there's huge buyers will set up their purchases. So, I will set up once it touch my Golden Zone Area.
Best regards,
RyodaBrainless
"Live to Ride and Ride to Live"

nas100 BUY SIGNALTHIS IS A NASDAQ 100 FREE SIGNAL. patiently waiting for the market to run next week

PalladiumMonday, 27 September 2021
13:36 PM (WIB)
Palladium seems has already developing bullish move with more possibility to breaks up the descending downtrend. I'm expecting the price chart rise into 0.5 F
Best regards,
RyodaBrainless
"Live to Ride and Ride to Live"

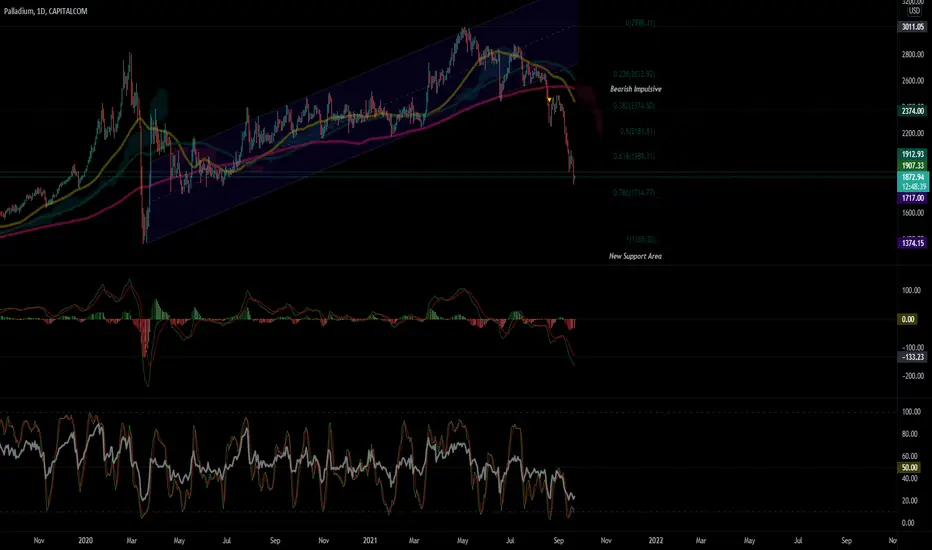
PALLADIUM Best long-term buy opportunity.Palladium (XPDUSD) has been trading within a Fibonacci Channel and is turning into one of the best long-term investments as the price is approaching the MA200 (orange trend-line) on the 1W time-frame. This level has been in support ever since XPD broke parabolically to the upside (January 2017). At the same time, it happens to be resting exactly at the bottom of the Channel (Fib 0). Another indicator in support of a rebound is the CCI which is the nearest it's been to the June 2015 Support level.
As you see on this long-term chart, the potential growth of Palladium is immense as a break above the May High can trigger a parabolic rally towards the 3.0 Fibonacci extension (that happened with Fib 1.0 to Fib 2.0 in 2020. We are adding Palladium to our long-term portfolio.
** Please support this idea with your likes and comments, it is the best way to keep it relevant and support me. **
--------------------------------------------------------------------------------------------------------
!! Donations via TradingView coins also help me a great deal at posting more free trading content and signals here !!
🎉 👍 Shout-out to TradingShot's 💰 top TradingView Coin donor 💰 this week ==> Vergnes
--------------------------------------------------------------------------------------------------------

Bearish Pennant on XPD/USD @ D1There is a medium-term swing trading opportunity presented by a bearish pennant on the daily chart of XPD/USD (Palladium CFD). It provides a bearish breakout trading setup. The pennant and its pole are marked with the yellow lines. My potential take-profit level is marked with the green line (1641.16). My potential stop-loss level is marked with the red line (2173.27). A short trade can be entered once a daily close well below of the pennant's lower border is registered.

PalladiumTuesday, 21 September 2021
15:04 PM (WIB)
Palladium's Bears just hit $1.818. It broke down the $1.907. This move open possibility the price will fall more deep into 0.786 F or even lower. What's bring Palladium's price on the market fall so far away? From $3.000 to $1.818? I need to find out why and keep watch the movement.
Best regards,
RyodaBrainless
"Live to Ride and Ride to Live"
PalladiumFriday, 17 September 2021
13:28 PM (WIB)
Palladium has been a long time in Bearish mode with hit new lowest low at $1.907 - $1.912. The chart structures seems Bearish Impulsive is near of the end of the road, and shift into bullish sign of movement. Once the price return to the new lowest low area and creates double bottom, I will open purchase orders at these spot.


Palladium Back At $2,000!Following the peak of the Covid pandemic in March 2020 when price declined by 48%,
price turned around and gradually moved back to the upside, eventually breaching
the all-time high 11 months later.
In May 2021, price created a new all-time high at $3,017 before heading back down
towards the weekly 50 simple moving average.
The 50 simple moving average was an important catalyst in the growth of price and
appeared as though is was going to hold as support again in August 2021.
Price breached this indicator and has since moved further down to the next obvious
level of support: the psychological $2,000 round number.
If this support zone holds strong, we should soon see a bounce back to the upside
and a bull trend resumption.
The bigger picture shows us that price is in a long-term period of consolidation,
which began in February 2020. The all-time high in May 2021 was just a fake breakout.
For now, this commodity will likely prove challenging to invest in, so the safest option
is to wait for a break and close above the all-time high at $3,017 before considering
any long opportunities.
See below for more information on our trading techniques.
As always, keep it simple, keep it Sublime.

Palladium: Loooks like a good time to rise.Reasons why I think this may well happen:
1. On the daily chart c=.62 x a (a fairly common event)
2. On the 2 hour chart .c=.a (a fairly common event)
3. On the weekly chart price is almost to the midline of the channel
4. On the weekly chart we have a positive reversal on the RSI.
5. On the daily chart we have positive reversal on the RSI followed by a bullish divergence.
Does this mean that for sure price will rise? No It means to me that there is a good chance it will. SO it is a good time to follow closely and watch for price action to confirm and also to give you a stop if it it reverses if you go long.
As Always: Process your way.
PALL is a stock which moves with Paltinum futures. If interested look it up.

PALLADIUM distribution schematics!Hello my beauties.
I believe Palladium is going to test the bottom of the range, come back up, and give us a nice markdown. This is a rough idea of what the price action will look like, in my opinion. My analysis is fully based on wyckoff distribution schematics.
If you find this idea to be helpful like, follow, and drop a comment below if you'd want me to analyse a different pair.
Consider supporting me if you think I am providing you with value.
Peace.
Luca, TrickleDownFX

PalladiumMonday, 13 September 2021
22:17 PM (WIB)
There is an unusual MACD's volumes that seen so Bearish in 1 hour trading session. This could attracting more sellers to join and lead the price into $2000 or even more to $1.800.
Best regards,
RyodaBrainless
"Live to Ride and Ride to Live"

PalladiumSunday, 12 September 2021
2:39 AM (WIB)
Palladium is so Bearish Downtrend that more possible to move downside to hit $1.500 at Monthly Trading Session. But tomorrow I expecting the price will retrace upside to 0.5 F or even more higher to 0.382 F. And monitor for Bullish reaction at this short term. The price won't breaks up 0.382 F. Let see when the market open.
Best regards,
RyodaBrainless
"Live to Ride and Ride to Live"

#palladium : support buy levelwe hit support and partial rebound today , despite low cars activity, it could be good entry for palladium 2200 level , my entry

PalladiumWednesday, 25 August 2021
3:39 AM (WIB)
Technical Analysis
I’ve been watching and trading Palladium in short time trading session. I was curious with Weekly and Monthly trading session, and found some very important clues about Palladium dynamic movement.
Strangely, since 2016 Palladium MACD lines always running and fly high above 0. And hard to see the Lines fall below 0. of MACD lines. This indicating Palladium have very strong of Bullish movement since 2016, or $524. Until it crashed from $2884 into $1500 area. From the crashed, Palladium developing Ascending Parallel Channel with top of resistance at $3000 area. And then fall again into $2258, which is the lowest support of ascending channel. Meanwhile, the Fibonacci Retracement show about 0.5 or 50% was the target from the Traders and Investors.
Although Palladium is trading inside the ascending channel, there was a sign of downtrend lines that could lead the price into the 2nd very strong support at $1500 again. While Monthly trading session show Palladium is on downtrend with Bears control in Weekly and Monthly frames. The downtrend resistance seems hard to breaks up by Bulls. This because the top of resistance is near $2565 area, or near below 0.236 F / 0.786 F.
For the continuation of downtrend, it has to breaks down the lowest support lines of ascending channel. So, in my view Palladium now trading from 0.236 F – 0.382 F into 0.5 F. With more possibility downtrend continuation.
Keep watch and keep notes.
Best regards,
RyodaBrainless
“Live to Ride and Ride to Live”

PalladiumWednesday, 18 August 2021
22:10 PM (WIB)
Palladium broke the support lines of ascending channel, and broke the lowest point at $2444.
I'm expecting the price continue to fall into the 1 F ($2200), according Oversold in daily trading session, and weekly trading session.
Keep watch intense and notes.
Best regards,
RyodaBrainless
"Live to Ride and Ride to Live"

PALLADIUM - Wait For It!Hello everyone, if you like the idea, do not forget to support with a like and follow.
Palladium is approaching around a support zone in green so we will be looking for buy setups.
on H4: Palladium formed a valid trendline in orange but it is not ready to go yet.
Before we buy, we want the buyers to prove that they are taking over again.
Trigger => Waiting for a momentum candle close above the last swing high in gray to buy.
Meanwhile, until the buy is activated, Palladium would be overall bearish can still trade lower till 2500 before going up.
Good luck!
All Strategies Are Good; If Managed Properly!
~Rich

