Palladium HammeredJune Palladium hammered today rejecting lower lows. We will see if it holds and a continued uptrend can happen. A bullish butterfly is in affect.
Palladium

Palladium: Multiple Bearish PatternsSo far Palladium has completed bearish 2618, AB=CD and Gartley Set-ups. The Gartley just triggered like 20 minutes ago and am pretty bummed I missed it. But there will be many more opportunities! Next I will be watching for a breakout of the wedge, or the formation of another bearish pattern.
Let me know your view!

Pallidium Head and shouldersPalladium has made the top of the last shoulder. Has tried three times to move higher, but has come under resistance. Major resistance is at 773.25 from back at position A of the Cypher pattern. Possible down day tonight and into tomorrow. Target down is 740. Full H&D target 700.

Palladium New kid on the block. First leg 0-1 complete. Now in need second phase 1-2 (717 support) and then 2-3 (825) and so on. I have no positions in this metal. Becoming more popular. Obviously not gold.

Palladium -- Missed Last Entry But Here Is Another ChanceI missed my entry on the past idea (linked below) as I was hoping to get in from the top of the potential Cypher rather than using the AB=CD for my entry. Oh well.
Here is a 2618 set-up after the double top it formed last week. It is also the completion of the faux AB=CD patterns shown on the chart . It seems to me a good place to short. I would love to hear your thoughts. Good luck!
(Don't use this as a trading signal -- I am rookie!)

PalladiumVery interesting market Palladium. Can make a lot of money fast, or loose it all. Been watching this for a couple of weeks now. If you don't know, Palladium is used in catalytic converters. Since the drop in oil prices for 2016, the car industry have seen an uptrend. 2017 may shape out that same way as there is too much anxiety that the OPEC agreement won't amount to much. Since Palladium is scarce, this market may continue to rise. March and June Palladium have been building out a head and shoulders pattern. Right now there is a bullish flag forming.
Unlike other markets, this market produces textbook signals. At least so far. The grid is based on a $2000 dollar move. If you had the courage and money to play this market since September 30, you would have reaped $54,000 per contract.


Palladium: Bearish AB=CD Into Bullish Cypher?I am looking to enter a short on Palladium in the near future for the completion of the AB=CD pattern shown on the chart. Today has been an extremely bullish day although it seems like it may have finally taken a breather around 782. I will likely be looking for entries on lower time frames which correspond with this longer time frame idea once I have seen rejection in the PRZ as the stop losses for these ideas when trading Palladium contracts is rather large. Be patient and always wait for additional confluences and confirmation!
Please do not regard this trade as a signal -- I am still relatively new to trading and these are only my personal views and ideas! Good luck!

PALLADIUM indecisive at the momentSomeone asked an advice in chat about Palladium LONG (with TP@756.00) and thought to provide my personal point of view with a more organic answer...
The instrument is uptrend on the long term, but it looks indecisive at the moment; from the chart we can see it is in a range between two Fibonacci levels (and one of them is a resistance as well).
If we entered LONG at the bottom of the retracement the trade would be risky might be somewhat safe (with a SL just below the Fibonacci line serving as support.
The price bounced a few times around the ~756.13 line as well: last but not least, the pin-bar reversal on Thursday (see the lower red line in the next chart, orange line in the others)
Note that there is also an historical support on the Daily/Weekly (the higher blue line ~767.99 in the chart).
If we bought it around 748 (I am just guessing an entry point) we would have a 1:1 risk-reward-ratio which is not ideal given the conditions.
If we really wanted a 1:1 risk-reward-ratio, the entry point should have been put just above the Fibonacci level where the price bounced and the SL accordingly.
I do not want to be dragged into the philosophical discussion if it is worth trading commodities for short-term, relatively little movements :)
I would just stick to the technical and say that not advise to enter a trade in the middle of a Fibonacci level or between two support/resistance levels (even more if one confirms the other).
Hope that helps

Palladium has established an up trend on the hourly
After 7 red days in a row & 3 red weeks, Fri saw an inside/doji HOD @ $660.35 that broke to the upside on the open last night.
In addition consolidated with a higher low on the Daily $652.15 and had previous support at that level in Sept
I am trying a swing for several days/possibly weeks, targeting 20DMA for starters @ $719.74 and will re-assess PA at that time.
Would feel better if Platinum came along, so far kind of stuck in the mud in comparison but green on the day as well.
Gold would certainly help both along as well one eye open on that progress during this trade but noting that Palladium has been known to have zero correlation w/gold at times this year like the Nov 4 - Nov 30th bull run. Seems more correlated w/copper as an industrial on that run... if precious metals happen to run same time look out ABOVE


Gold - Platinum Spread IndicatorHere is an indicator developed specifically for the gold - platinum spreaders out there.
Platinum is much rarer than both gold and silver — so rare, in fact, that all of the platinum ever mined could fit into your living room.
Still filling mine.
Peace.
Tarzan

Russell 2000 SHORT Positions stay frostyIf you are SHORT the Russell 2000 from 1333.65, Technical Trailing Stop is 1323.44.
There is divergence showing (TrendCycle), possible pullback pending/pause of SHORT trend.

Palladium SHORT Swing TradePalladium XPDUSD SHORT Trade in progress, 4 hour chart technicals.
Trailing Stop Loss is at 761.91.

XPDUSD: Monitoring the declinePalladium has an interesting chart, and bullish potential. Right now there's an active 'Time at mode' signal which points to a 7 bar decline which is already active. The time and price target implies that we will see 600.556 hit by November 3rd or sooner. If that doesn't happen, we get a bullish signal.
There's already a bearish failure, since bears didn't manage to replicate the range of the decline that happened 3 days ago, so it's likely to see a reversal here.
Keep an eye on it. I'll update it once it's safe to go long.
Good luck,
Ivan Labrie.

Palladium portfolio reloach after or 150$ a contract return, i propose a small reenter on palladium but target now 880 ;)

XPDUSD: Palladium, long dips with stops under 691.16Palladium is offering great potential here, with odds of getting you into a long term uptrend if you go long next weeek.
Risk is a drop under 616.16, so buy dips and add on a breakout of last week's high with the same stop loss.
The long term chart shows potential for a quarterly/6-month timeframe uptrend signal, so this makes Palladium particularly interesting.
Good luck,
Ivan Labrie.


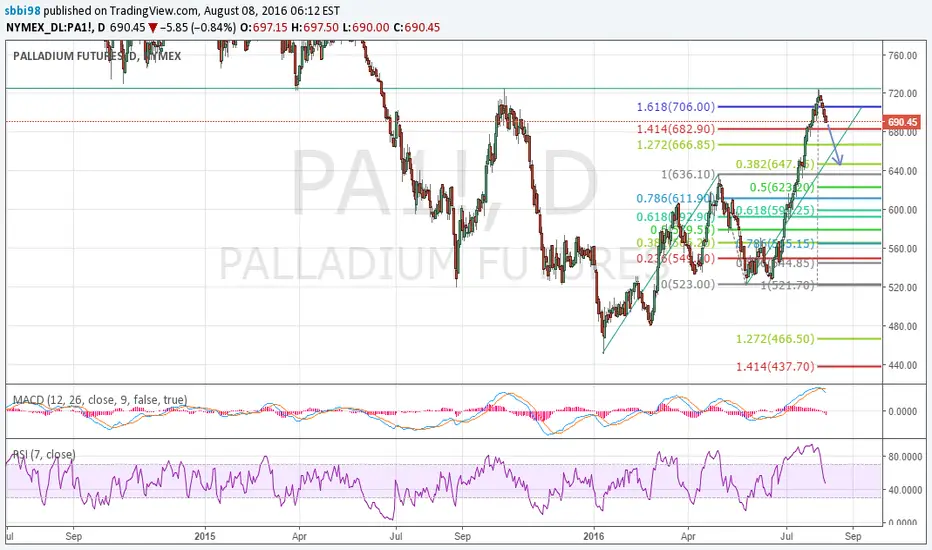
Bullish on PalladiumPalladium has broken out of a monthly downtrend and is in a strong up trend. However, this move can end anytime. Potential targets could be the 1.272 and 1.618 FE. Following a consolidation, it should give another move up.

