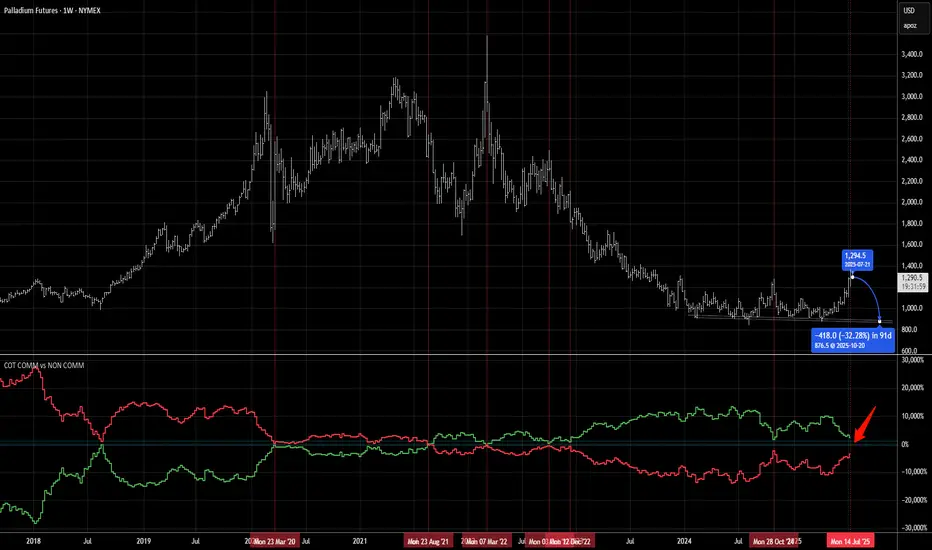
Palladium Crash Incoming; 30%+ Drop ExpectedPalladium is indeed a very small market and hence exhibits very unique and highly predictable COT patterns. When the producers begin to heavily sell after large price rallies, XPD is destined for a fall back down into its intermediate term supply/demand zone. Which in this case represents the $850-$900 range. So a nice 30%+ down swing over the course of several months can be predicted based on previous builds in the NYMEX COT report.
There is absolutely ZERO material reason for the PGMs to have staged such a large rally these last few months other then as a liquidity fueled move coupled with massive price divergence with gold. The PGM market could not have worse demand fundamentals, especially for Palladium which is mostly used for automotive use as catalytic converters in gasoline powered vehicles (ICE). With the largest customer of the metal being China who is in a secular economic slowdown, then the US/EU where vehicle prices have exploded. The market is well supplied especially as EVs take over in dominance across Asia and emerging more in western markets which require no such catalytic functions.
Market Call: We are scaling into short positions on XPD anticipating a market convergence back to its normally supplied price level of $875/oz.
Palladiumshort
PALLADIUM - In a significant resistance levelOANDA:XPDUSD is approaching a significant resistance level that has previously seen bullish momentum. This area aligns with a notable supply zone and could present a potential selling opportunity.
If bearish signals, such as rejection wicks or bearish candlestick patterns, appear, the price may decline toward 993,000. Crossing above this resistance zone would diminish the bearish perspective and indicate bullish continuation.
Key Takeaway: Monitor price action closely at this level and prioritize strong risk management. What’s your perspective on this setup? Share your thoughts in the comments!

PALLADIUM - Key zone to Watch for the Next MoveOANDA:XPDUSD is present in a key resistance zone, a level that has previously acted as a turning point for strong bearish reversals. The recent upward momentum leading into this zone increases the probability of heightened selling interest.
This could set the stage for a potential decline toward the 957.900 level. But If the resistance is decisively broken, it could mean further bullish advances, suggesting a continuation of the upward trend.
In other words, XPD/USD is at a critical point, with the resistance zone likely to determine the market's next direction.
-Price to watch 957.900,
-A breakout would indicate further bullish continuation.
Remain disciplined, wait for definitive confirmation before entering positions. This shows the importance of careful analysis and adherence to trading plans.

UPDATE: Palladium on track to $880.00Since our last update, Palladium broke below a Descending Triangle at $1,614 and is currently at $1,227.
The downtrend is strong and now there is a Rounding Top formation.
Break below and it could very well go to our first target of $880.
I'll let you know.

Palladium primary trend remains bearish.Palladium - Intraday
The primary trend remains bearish.
Preferred trade is to sell into rallies.
20 1day EMA is at 1397.
Trading has been mixed and volatile.
Daily signals for sentiment are at oversold extremes.
We look to Sell at 1397.8 (stop at 1421.8)
Our profit targets will be 1337.8 and 1327.8
Resistance: 1400 / 1415 / 1430
Support: 1380 / 1360 / 1340
Risk Disclaimer
The trade ideas beyond this page are for informational purposes only and do not constitute investment advice or a solicitation to trade. This information is provided by Signal Centre, a third-party unaffiliated with OANDA, and is intended for general circulation only. OANDA does not guarantee the accuracy of this information and assumes no responsibilities for the information provided by the third party. The information does not take into account the specific investment objectives, financial situation, or particular needs of any particular person. You should take into account your specific investment objectives, financial situation, and particular needs before making a commitment to trade, including seeking advice from an independent financial adviser regarding the suitability of the investment, under a separate engagement, as you deem fit.
You accept that you assume all risks in independently viewing the contents and selecting a chosen strategy.
Where the research is distributed in Singapore to a person who is not an Accredited Investor, Expert Investor or an Institutional Investor, Oanda Asia Pacific Pte Ltd (“OAP“) accepts legal responsibility for the contents of the report to such persons only to the extent required by law. Singapore customers should contact OAP at 6579 8289 for matters arising from, or in connection with, the information/research distributed.

The one and only commodity I am selling in May 2023!We’re looking at the weekly chart.
We can see palladium’s price has fallen since 2021 from $3,000 down to today at $1,424.
Then in 2022, palladium shot up to above $3,400, this has formed what’s known as a Descending Triangle.
This is where the price makes lower highs and bounces on the same floor level.
Now that the price has broken below the triangle, this tells me the sellers are winning and will continue to dominate the market.
This will bring down the price further. I expect the palladium’s price to drop to the 200MA (black line) and then further down to $880.
If this happens, this downside for the precious metal will ONLY be the beginning.
Considering all these factors, we need to brace for palladium’s next crash and at least try and profit from the fall.
FUNDAMENTALS:
Why Palladium’s demand is dropping
Experts from Norilsk Nickel, a major mining company, predict there could be only a small shortfall of 100,000 ounces.
This is less than what they thought in February when they expected a shortfall of 300,000 ounces.
This is mainly because the car industry is not recovering as quickly as they thought, so demand has not increased as expected.
Chip supply and the war in Ukraine have further slowed the car industries recovery.
And South African palladium producers have also contributed to this slowing as they have lowered their production goals and reduced their refining activities, largely due to loadshedding.
And this isn’t good for palladium and its price.
But as always I look to the charts for the overarching signal and this is what it’s telling me.

Is Palladium to extend its losses?Palladium - 24h expiry
There is no indication that the selloff is coming to an end.
We look for losses to be extended today.
Short-term oscillators have turned negative.
Expect trading to remain mixed and volatile.
The primary trend remains bearish.
We look to Sell a break of 1501.8 (stop at 1525.8)
Our profit targets will be 1441.8 and 1431.8
Resistance: 1513.5 / 1525 / 1540
Support: 1502.5 / 1480 / 1460
Risk Disclaimer
The trade ideas beyond this page are for informational purposes only and do not constitute investment advice or a solicitation to trade. This information is provided by Signal Centre, a third-party unaffiliated with OANDA, and is intended for general circulation only. OANDA does not guarantee the accuracy of this information and assumes no responsibilities for the information provided by the third party. The information does not take into account the specific investment objectives, financial situation, or particular needs of any particular person. You should take into account your specific investment objectives, financial situation, and particular needs before making a commitment to trade, including seeking advice from an independent financial adviser regarding the suitability of the investment, under a separate engagement, as you deem fit.
You accept that you assume all risks in independently viewing the contents and selecting a chosen strategy.
Where the research is distributed in Singapore to a person who is not an Accredited Investor, Expert Investor or an Institutional Investor, Oanda Asia Pacific Pte Ltd (“OAP“) accepts legal responsibility for the contents of the report to such persons only to the extent required by law. Singapore customers should contact OAP at 6579 8289 for matters arising from, or in connection with, the information/research distributed.

Palladium to breakdown?Palladium - 24h expiry -
The primary trend remains bearish.
Although the bulls are in control, the stalling positive momentum indicates a turnaround is possible.
Price action has posted a Doji candle and signals a possible reversal of the recent trend.
The bias is to break to the downside.
Our outlook is bearish.
We look to Sell a break of 1572.9 (stop at 1596.9)
Our profit targets will be 1512.9 and 1502.9
Resistance: 1590 / 1605 / 1625
Support: 1574 / 1555 / 1520
Risk Disclaimer
The trade ideas beyond this page are for informational purposes only and do not constitute investment advice or a solicitation to trade. This information is provided by Signal Centre, a third-party unaffiliated with OANDA, and is intended for general circulation only. OANDA does not guarantee the accuracy of this information and assumes no responsibilities for the information provided by the third party. The information does not take into account the specific investment objectives, financial situation, or particular needs of any particular person. You should take into account your specific investment objectives, financial situation, and particular needs before making a commitment to trade, including seeking advice from an independent financial adviser regarding the suitability of the investment, under a separate engagement, as you deem fit.
You accept that you assume all risks in independently viewing the contents and selecting a chosen strategy.
Where the research is distributed in Singapore to a person who is not an Accredited Investor, Expert Investor or an Institutional Investor, Oanda Asia Pacific Pte Ltd (“OAP“) accepts legal responsibility for the contents of the report to such persons only to the extent required by law. Singapore customers should contact OAP at 6579 8289 for matters arising from, or in connection with, the information/research distributed.

XPD selloff has no indication of coming to and end.Palladium - Intraday -
We are trading at oversold extremes.
Daily signals are bearish.
There is no indication that the selloff is coming to an end.
Previous support at 1405 now becomes resistance.
We look for a temporary move higher.
50 4hour EMA is at 1408.
We look to Sell at 1403.4 (stop at 1427.3)
Our profit targets will be 1343.3 and 1333.3
Resistance: 1350 / 1365 / 1380
Support: 1340 / 1320 / 1300
Risk Disclaimer
The trade ideas beyond this page are for informational purposes only and do not constitute investment advice or a solicitation to trade. This information is provided by Signal Centre, a third-party unaffiliated with OANDA, and is intended for general circulation only. OANDA does not guarantee the accuracy of this information and assumes no responsibilities for the information provided by the third party. The information does not take into account the specific investment objectives, financial situation, or particular needs of any particular person. You should take into account your specific investment objectives, financial situation, and particular needs before making a commitment to trade, including seeking advice from an independent financial adviser regarding the suitability of the investment, under a separate engagement, as you deem fit.
You accept that you assume all risks in independently viewing the contents and selecting a chosen strategy.
Where the research is distributed in Singapore to a person who is not an Accredited Investor, Expert Investor or an Institutional Investor, Oanda Asia Pacific Pte Ltd (“OAP“) accepts legal responsibility for the contents of the report to such persons only to the extent required by law. Singapore customers should contact OAP at 6579 8289 for matters arising from, or in connection with, the information/research distributed.

Palladium daily EMA keeps on attracting sellers.We are trading at oversold extremes.
20 1-day EMA is at 1494.
Bullish divergence can be seen on the daily (the chart makes a lower low while the oscillator makes a higher low), often a signal of exhausted bearish momentum, or at least a correction higher.
We look for a temporary move higher.
Preferred trade is to sell into rallies.
Palladium - Intraday - We look to Sell at 1496.9 (stop at 1520.9)
Our profit targets will be 1436.9 and 1430.9
Resistance: 1445 / 1459 / 1480
Support: 1420 / 1405 / 1385
Risk Disclaimer
The trade ideas beyond this page are for informational purposes only and do not constitute investment advice or a solicitation to trade. This information is provided by Signal Centre, a third-party unaffiliated with OANDA, and is intended for general circulation only. OANDA does not guarantee the accuracy of this information and assumes no responsibilities for the information provided by the third party. The information does not take into account the specific investment objectives, financial situation, or particular needs of any particular person. You should take into account your specific investment objectives, financial situation, and particular needs before making a commitment to trade, including seeking advice from an independent financial adviser regarding the suitability of the investment, under a separate engagement, as you deem fit.
You accept that you assume all risks in independently viewing the contents and selecting a chosen strategy.
Where the research is distributed in Singapore to a person who is not an Accredited Investor, Expert Investor or an Institutional Investor, Oanda Asia Pacific Pte Ltd (“OAP“) accepts legal responsibility for the contents of the report to such persons only to the extent required by law. Singapore customers should contact OAP at 6579 8289 for matters arising from, or in connection with, the information/research distributed.

Palladium at 60-week low.Palladium - Intraday - We look to Sell at 1588.5 (stop at 1611.9)
Trades at the lowest level in 60 weeks.
We are trading at oversold extremes.
There is no clear indication that the downward move is coming to an end.
Previous support at 1590 now becomes resistance.
We look for a temporary move higher.
Our profit targets will be 1530.1 and 1525.1
Resistance: 1531 / 1545 / 1560
Support: 1517 / 1500 / 1480
Risk Disclaimer
The trade ideas beyond this page are for informational purposes only and do not constitute investment advice or a solicitation to trade. This information is provided by Signal Centre, a third-party unaffiliated with OANDA, and is intended for general circulation only. OANDA does not guarantee the accuracy of this information and assumes no responsibilities for the information provided by the third party. The information does not take into account the specific investment objectives, financial situation, or particular needs of any particular person. You should take into account your specific investment objectives, financial situation, and particular needs before making a commitment to trade, including seeking advice from an independent financial adviser regarding the suitability of the investment, under a separate engagement, as you deem fit.
You accept that you assume all risks in independently viewing the contents and selecting a chosen strategy.
Where the research is distributed in Singapore to a person who is not an Accredited Investor, Expert Investor or an Institutional Investor, Oanda Asia Pacific Pte Ltd (“OAP“) accepts legal responsibility for the contents of the report to such persons only to the extent required by law. Singapore customers should contact OAP at 6579 8289 for matters arising from, or in connection with, the information/research distributed.

Palladium broke 2019 support. Descending TriangleSupport broken. Further Downside unless it reclaims the support and it proves as a deviation. Looking for shorts unless it reclaims the support.

Palladium setting a very big sell signal to $880Descending triangle has formed on the weekly chart for Palladium
Last week, was a breakout to the downside.
200 >21> 7 - Red background
RSI <50 lower highs
Bearish
Target $880
WHY WOULD Palladium go down?
I can't tell you with any certainties why it's coming down but I can think of a few potential factors like:
~ Lower demand for Palladium as an investor point of view
~ There is an increase in the supply of palladium - I assume with all of the automotive catalysts and with the higher confidence in electric vehicles (cough Tesla)
~ Interest rate changes with there talks about inflationary measures and interest rate drops, this can result in a drop in Palladium prices
~ Technological advancements reducing the need for palladium. For example, they may be using alternatives like Rhodium, Iron, PLatinum for catalysts in newer vehicles that contain less palladium.

Palladium rallies continues to attract sellers.Palladium - Intraday - We look to Sell at 1736.8 (stop at 1757.8)
Intraday rallies continue to attract sellers and there is no clear indication that this sequence for trading is coming to an end.
20 1day EMA is at 1739.
We look for a temporary move higher.
Preferred trade is to sell into rallies.
Daily signals are bearish.
Expect trading to remain mixed and volatile.
Our profit targets will be 1687.8 and 1677.8
Resistance: 1696 / 1710 / 1735
Support: 1680 / 1670 / 1655
Risk Disclaimer
The trade ideas beyond this page are for informational purposes only and do not constitute investment advice or a solicitation to trade. This information is provided by Signal Centre, a third-party unaffiliated with OANDA, and is intended for general circulation only. OANDA does not guarantee the accuracy of this information and assumes no responsibilities for the information provided by the third party. The information does not take into account the specific investment objectives, financial situation, or particular needs of any particular person. You should take into account your specific investment objectives, financial situation, and particular needs before making a commitment to trade, including seeking advice from an independent financial adviser regarding the suitability of the investment, under a separate engagement, as you deem fit.
You accept that you assume all risks in independently viewing the contents and selecting a chosen strategy.
Where the research is distributed in Singapore to a person who is not an Accredited Investor, Expert Investor or an Institutional Investor, Oanda Asia Pacific Pte Ltd (“OAP“) accepts legal responsibility for the contents of the report to such persons only to the extent required by law. Singapore customers should contact OAP at 6579 8289 for matters arising from, or in connection with, the information/research distributed.

Palladium with a double top formation.Palladium - Intraday - We look to Sell at 1820.8 (stop at 1842.3)
Daily signals are bearish.
Posted a Double Top formation.
1830 has been pivotal.
Rallies should be capped by yesterday's high.
We look for a temporary move higher.
Our profit targets will be 1767.7 and 1762.7
Resistance: 1780 / 1795 / 1815
Support: 1768 / 1755 / 1740
Risk Disclaimer
The trade ideas beyond this page are for informational purposes only and do not constitute investment advice or a solicitation to trade. This information is provided by Signal Centre, a third-party unaffiliated with OANDA, and is intended for general circulation only. OANDA does not guarantee the accuracy of this information and assumes no responsibilities for the information provided by the third party. The information does not take into account the specific investment objectives, financial situation, or particular needs of any particular person. You should take into account your specific investment objectives, financial situation, and particular needs before making a commitment to trade, including seeking advice from an independent financial adviser regarding the suitability of the investment, under a separate engagement, as you deem fit.
You accept that you assume all risks in independently viewing the contents and selecting a chosen strategy.
Where the research is distributed in Singapore to a person who is not an Accredited Investor, Expert Investor or an Institutional Investor, Oanda Asia Pacific Pte Ltd (“OAP“) accepts legal responsibility for the contents of the report to such persons only to the extent required by law. Singapore customers should contact OAP at 6579 8289 for matters arising from, or in connection with, the information/research distributed.

Selling XPD into trend of lower highs.Palladium - Intraday - We look to Sell at 1789.8 (stop at 1818.1)
Our short term bias remains negative.
Trend line resistance is located at 1787.
Preferred trade is to sell into rallies.
Prices expected to stall near trend line resistance.
Our profit targets will be 1722.2 and 1713.2
Resistance: 1755 / 1770 / 1790
Support: 1735 / 1720 / 1710
Risk Disclaimer
The trade ideas beyond this page are for informational purposes only and do not constitute investment advice or a solicitation to trade. This information is provided by Signal Centre, a third-party unaffiliated with OANDA, and is intended for general circulation only. OANDA does not guarantee the accuracy of this information and assumes no responsibilities for the information provided by the third party. The information does not take into account the specific investment objectives, financial situation, or particular needs of any particular person. You should take into account your specific investment objectives, financial situation, and particular needs before making a commitment to trade, including seeking advice from an independent financial adviser regarding the suitability of the investment, under a separate engagement, as you deem fit.
You accept that you assume all risks in independently viewing the contents and selecting a chosen strategy.
Where the research is distributed in Singapore to a person who is not an Accredited Investor, Expert Investor or an Institutional Investor, Oanda Asia Pacific Pte Ltd (“OAP“) accepts legal responsibility for the contents of the report to such persons only to the extent required by law. Singapore customers should contact OAP at 6579 8289 for matters arising from, or in connection with, the information/research distributed.

XPDNot financial advice.
The essence of investing & trading is the intelligent and patient preying on the greed, fear, impatience, addiction and ignorance of the majority. It's definitionally Darwinian.

PALLADIUM SellWe are creating a Bear Flag on 1h and 4h, we can see a resume of down move on Palladium, and targeting a down move.

SPPP-SPROTT PHYSICAL PALLADIUM AND PLATINUM PROFITSI made good profits with this in a short time swing trading this etf. I loved it. Why mess with bitcoin crypto or even gold when I can make money with this.. Anyway. Now its in a bear trend and looking to get back into this etf if it shows some promise. As you know the prices for Palladium and Platinum have skyrockted and have done even better than gold . Catalytic convertors are being stolen from cars at record numbers everywhere thorugh out the nation. Watch this video for details. Give me a thumbs up and feel free to subscribe to show support for my TA videos.
Disclaimer
I’m not a certified financial planner/advisor, a certified financial analyst, an economist, a CPA, an accountant, or a lawyer. I’m not a finance professional through formal education. The contents on this TA,(Technical Analysis) are for informational and educational purposes only and do not constitute financial, investment, trading, accounting, or legal advice. I can’t promise that the information shared on my posts is appropriate for you or anyone else. By using or reading this technical analysis or site, you agree to hold me harmless from any ramifications, financial or otherwise, that occur to you as a result of acting on information found on this analysis, or post.

Palladium - Short!Alternate View to the Previous Chart -->
Palladium - Weekly Chart - Correction wave C is expected to drag the price up to the $1370.00 range. TVC:PALLADIUM CURRENCYCOM:PALLADIUM CAPITALCOM:PALLADIUM OANDA:XPDUSD NYMEX:PA1! FX_IDC:XPDUSD PEPPERSTONE:XPDUSD EASYMARKETS:XPDUSD FX_IDC:XPDUSDG
given chart invalid if price exceeds 2698.61 in the short term.
Educational Purpose Only! Do Analys before taking a position!!!

Palladium - Incoming Wave 2 Correction - Short!Palladium completed its wave 1... Short-term Correction wave 2 is expected to drag the price up to the 1965.00 range.
given chart invalid if price exceeds 2698.61 in the short term. TVC:PALLADIUM CURRENCYCOM:PALLADIUM CAPITALCOM:PALLADIUM OANDA:XPDUSD NYMEX:PA1!
Educational Purpose Only! Do Analys before taking a position!!!

PALLADIUM to down 86%Have you noticed something? 1980 | 2001 years were the declining years for it. And the bearish period longed about 2 years with a 86% decline from it's ATH. As you noticed the bearish period comes in every 21 years! This year is: 2022 and tend to be the next 2 bearish years for Palladium with a target $400-$500 (86% decline from ATH, the last ATH was at 3000 price).
Good luck in trades, buddy.

Palladium - a small short before the move higherPalladium has just provided three reasons why I will look for a retracement before looking for the long.
1. Market has reached a trend line connecting tops - 9 month span
2. Market has hit the 1.272 from high 18th Nov (double top) - low 31th Dec - the 1.272 is the pink line. Note: We need to take in to account the larger swing from Dec15 - present.
3. Market has hit the 618 of the last big swing from high May 21 - 31 Jan - the black line is the 618
From here we look for a pullback to the 382 that happens to be a strong support zone - light blue line
After the pull back we go LONG with an ABCD pattern and the top of our range box to reach our target.
