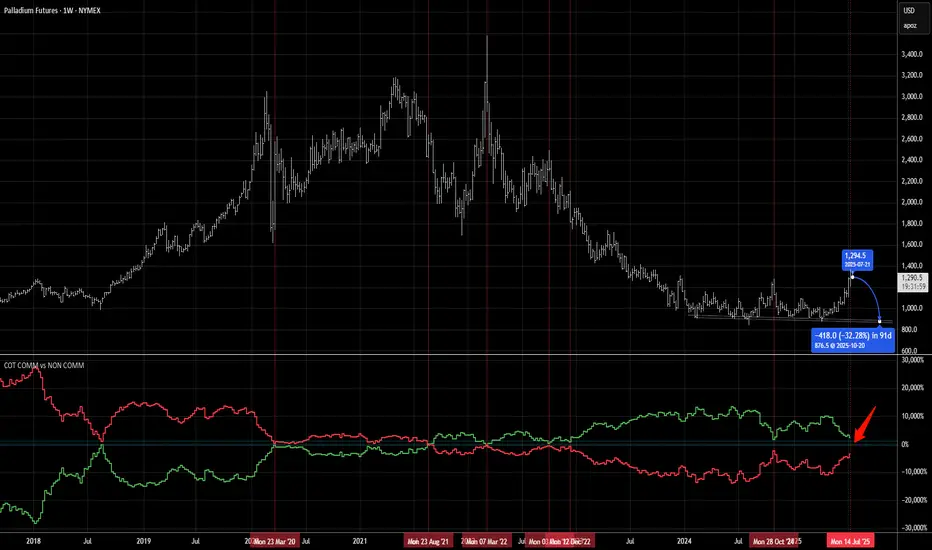
Palladium Crash Incoming; 30%+ Drop ExpectedPalladium is indeed a very small market and hence exhibits very unique and highly predictable COT patterns. When the producers begin to heavily sell after large price rallies, XPD is destined for a fall back down into its intermediate term supply/demand zone. Which in this case represents the $850-$900 range. So a nice 30%+ down swing over the course of several months can be predicted based on previous builds in the NYMEX COT report.
There is absolutely ZERO material reason for the PGMs to have staged such a large rally these last few months other then as a liquidity fueled move coupled with massive price divergence with gold. The PGM market could not have worse demand fundamentals, especially for Palladium which is mostly used for automotive use as catalytic converters in gasoline powered vehicles (ICE). With the largest customer of the metal being China who is in a secular economic slowdown, then the US/EU where vehicle prices have exploded. The market is well supplied especially as EVs take over in dominance across Asia and emerging more in western markets which require no such catalytic functions.
Market Call: We are scaling into short positions on XPD anticipating a market convergence back to its normally supplied price level of $875/oz.
Palladiumusd
PALLADIUM PRICE HIJACK! (XPD/USD Long Setup)🏦💰 PALLADIUM HEIST ALERT: XPD/USD Bullish Raid in Progress! (Long Setup) 💰🏦
🚨 Cops Waiting at Support? Here's How to Loot This Rare Metal Move! 🚨
🦹♂️ ATTENTION ALL MARKET BANDITS!
To the Elite Metals Raiders & Risk-Takers! 🔥💎
Using our 🔥Thief Trading Tactics🔥 (a lethal mix of supply shocks + industrial demand + institutional traps), we're executing a bullish heist on XPD/USD—this is not advice, just a strategic robbery plan for traders who play outside the rules.
📈 THE PRECIOUS METALS HEIST (LONG ENTRY PLAN)
🎯 Loot Zone: 1030.000 (or escape earlier if bears counterattack)
💣 High-Stakes Play: Overbought but squeezing higher - trap for palladium shorts
👮♂️ Cop Trap: Where bears get liquidated at support
🔑 ENTRY RULES:
"Vault Breach Confirmed!" – Grab bullish positions on pullbacks (15-30min TF)
Buy Limit Orders for optimal risk/reward
Aggressive? Enter at market but watch auto sector news
🚨 STOP LOSS (Escape Plan):
Thief SL at 1039.000 (3H swing low)
⚠️ Warning: "Ignore this SL? Enjoy your margin call."
🎯 TARGETS:
Main Take-Profit: 1130.000
Scalpers: Ride the London/NY overlap momentum
🔍 FUNDAMENTAL BACKUP (Why This Heist Works)
Before raiding, check:
✅ Auto Industry Demand (Catalytic converter needs)
✅ Russian Supply Risks (Sanctions impact?)
✅ Dollar Weakness (Commodities rally fuel)
✅ ETF Flows (Institutional accumulation)
🚨 RISK WARNING
Avoid NFP/CPI periods (Palladium loves volatility)
Trailing stops = your bulletproof vest
💎 BOOST THIS HEIST!
👍 Smash Like to fund our next raid!
🔁 Share to recruit more trading pirates!
🤑 See you at the target, outlaws!
⚖️ DISCLAIMER: Hypothetical scenario. Trade at your own peril.
#XPUSD #Palladium #MetalsTrading #Commodities #ThiefTrading
💬 COMMENT: "Long already—or waiting for deeper pullback?" 👇🔥
P.S. Next heist target: Platinum or Rhodium? You decide! 💰

"Stealing Profits: XPD/USD Long Setup (Risk-Reward Heist)"🚨 XPD/USD "Palladium" Metal Market Heist Alert: The Bullish Breakout Robbery Plan (Swing & Scalp Strategy) 🚨
🌟 Hi! Hola! Ola! Bonjour! Hallo! Marhaba! 🌟
Attention Money Makers & Market Robbers! 🤑💰💸
Based on the 🔥Thief Trading Style🔥, here’s our master plan to loot the XPD/USD "Palladium" Metal Market. Follow the strategy on the chart—focusing on LONG entries—and escape near the high-risk Red Zone. This area is overbought, consolidating, and a potential reversal trap where bears lurk. 🏆 Take profits fast—you’ve earned it! 💪
🎯 Heist Entries:
📈 Entry 1: "The Breakout Heist!" – Wait for Resistance (1,100.000) to break, then strike! Bullish profits await.
📈 Entry 2: "Big Players’ Pullback!" – Jump in at 1,1030.000+ buy above at any price for a safer steal.
🔔 Pro Tip: Set a chart alert to catch the breakout instantly!
🛑 Stop Loss Rules:
*"Yo, listen! 🗣️ If you’re entering with a buy-stop (or) limit orders in pullbacks, DON’T set your SL until AFTER the breakout. Place it at the nearest swing low (4H timeframe) or wherever your risk allows—but remember, rebels risk more! 🔥"*
🏴☠️ Target: 1,160.000
🧲 Scalpers: Only play LONG! Use trailing SL to lock in profits. Big wallets? Go all in. Small stacks? Join the swing heist!
📊 Market Pulse:
The XPD/USD "Palladium" is neutral but primed for bullish momentum. Watch:
Fundamentals (COT, Macro, Geopolitics)
Sentiment & Intermarket Trends
Positioning & Future Targets & Overall score
📌 Check our bioo linkks for deep analysis! 🔗🌍
⚠️ Trading Alert:
News = Volatility! Protect your loot:
Avoid new trades during major news
Use trailing stops to secure profits
💥 Boost This Heist!
Hit 👍 & 🔄 to strengthen our robbery crew! Let’s dominate the market daily with the Thief Trading Style. 🚀💵
Stay tuned—another heist drops soon! 🎯🐱👤

XPD/USD "Palladium" Metal Market Heist Plan (Swing/Day Trade)🌟Hi! Hola! Ola! Bonjour! Hallo! Marhaba!🌟
Dear Money Makers & Robbers, 🤑 💰💸✈️
Based on 🔥Thief Trading style technical and fundamental analysis🔥, here is our master plan to heist the XPD/USD "Palladium" Metal Market. Please adhere to the strategy I've outlined in the chart, which emphasizes long entry. Our aim is the high-risk Red zone area. It's a Risky level, overbought market, consolidation, trend reversal, trap at the level where traders and bearish robbers are stronger. 🏆💸"Take profit and treat yourself, traders. You deserve it!💪🏆🎉
Entry 📈 : "The heist is on! Wait for the MA breakout (960) then make your move - Bullish profits await!"
however I advise to Place Buy stop orders above the Moving average (or) Place buy limit orders within a 15 or 30 minute timeframe most recent or swing, low or high level for Pullback entries.
📌I strongly advise you to set an "alert (Alarm)" on your chart so you can see when the breakout entry occurs.
Stop Loss 🛑: "🔊 Yo, listen up! 🗣️ If you're lookin' to get in on a buy stop order, don't even think about settin' that stop loss till after the breakout 🚀. You feel me? Now, if you're smart, you'll place that stop loss where I told you to 📍, but if you're a rebel, you can put it wherever you like 🤪 - just don't say I didn't warn you ⚠️. You're playin' with fire 🔥, and it's your risk, not mine 👊."
📍 Thief SL placed at the nearest/swing low level Using the 4H timeframe (927) Day / Swing trade basis.
📍 SL is based on your risk of the trade, lot size and how many multiple orders you have to take.
🏴☠️Target 🎯: 1010 (or) Escape Before the Target
🧲Scalpers, take note 👀 : only scalp on the Long side. If you have a lot of money, you can go straight away; if not, you can join swing traders and carry out the robbery plan. Use trailing SL to safeguard your money 💰.
💰💵💸XPD/USD "Palladium" Metal Market Heist Plan (Swing/Day Trade) is currently experiencing a Bullish trend.., driven by several key factors.☝☝☝
📰🗞️Get & Read the Fundamental, Macro Economics, COT Report, Geopolitical and News Analysis, Sentimental Outlook, Intermarket Analysis, Supply and Demand Factors, Future trend targets with Overall outlook score... go ahead to check 👉👉👉🔗🔗
⚠️Trading Alert : News Releases and Position Management 📰 🗞️ 🚫🚏
As a reminder, news releases can have a significant impact on market prices and volatility. To minimize potential losses and protect your running positions,
we recommend the following:
Avoid taking new trades during news releases
Use trailing stop-loss orders to protect your running positions and lock in profits
💖Supporting our robbery plan 💥Hit the Boost Button💥 will enable us to effortlessly make and steal money 💰💵. Boost the strength of our robbery team. Every day in this market make money with ease by using the Thief Trading Style.🏆💪🤝❤️🎉🚀
I'll see you soon with another heist plan, so stay tuned 🤑🐱👤🤗🤩

XPD/USD "Palladium" Metals Market Bull Heist Plan (Swing Trade)🌟Hi! Hola! Ola! Bonjour! Hallo! Marhaba!🌟
Dear Money Makers & Robbers, 🤑 💰💸✈️
Based on 🔥Thief Trading style technical and fundamental analysis🔥, here is our master plan to heist the XPD/USD "Palladium" Metals Market. Please adhere to the strategy I've outlined in the chart, which emphasizes long entry. Our aim is to escape near the high-risk ATR Zone. Risky level, overbought market, consolidation, trend reversal, trap at the level where traders and bearish robbers are stronger. 🏆💸"Take profit and treat yourself, traders. You deserve it!💪🏆🎉
Entry 📈 : "The vault is wide open! Swipe the Bullish loot at any price - the heist is on!
however I advise to Place buy limit orders within a 15 or 30 minute timeframe most recent or swing, low or high level for Pullback entries.
Stop Loss 🛑:
📍 Thief SL placed at the recent/swing low level Using the 4H timeframe (930.000) Day trade basis.
📍 SL is based on your risk of the trade, lot size and how many multiple orders you have to take.
🏴☠️Target 🎯: 1020.000 (or) Escape Before the Target
🧲Scalpers, take note 👀 : only scalp on the Long side. If you have a lot of money, you can go straight away; if not, you can join swing traders and carry out the robbery plan. Use trailing SL to safeguard your money 💰.
💰💵💴💸XPD/USD "Palladium" Metals Market Heist Plan (Day / Swing Trade) is currently experiencing a bullishness🐂.., driven by several key factors.👆👆👆
📰🗞️Get & Read the Fundamental, Macro Economics, COT Report, Geopolitical and News Analysis, Sentimental Outlook, Intermarket Analysis, Supply and Demand Factors, Future trend targets with Overall outlook score... go ahead to check👉👉👉🔗🔗🌎🌏🗺
⚠️Trading Alert : News Releases and Position Management 📰 🗞️ 🚫🚏
As a reminder, news releases can have a significant impact on market prices and volatility. To minimize potential losses and protect your running positions,
we recommend the following:
Avoid taking new trades during news releases
Use trailing stop-loss orders to protect your running positions and lock in profits
💖Supporting our robbery plan 💥Hit the Boost Button💥 will enable us to effortlessly make and steal money 💰💵. Boost the strength of our robbery team. Every day in this market make money with ease by using the Thief Trading Style.🏆💪🤝❤️🎉🚀
I'll see you soon with another heist plan, so stay tuned 🤑🐱👤🤗🤩

XPD/USD "The Palladium" Metal Market Heist Plan (Swing/Day)🌟Hi! Hola! Ola! Bonjour! Hallo! Marhaba!🌟
Dear Money Makers & Robbers, 🤑💰✈️
Based on 🔥Thief Trading style technical and fundamental analysis🔥, here is our master plan to heist the XPD/USD "Palladium" Metal Market. Please adhere to the strategy I've outlined in the chart, which emphasizes short entry. Our aim is the high-risk Yellow ATR Zone. Risky level, oversold market, consolidation, trend reversal, trap at the level where traders and bullish robbers are stronger. 🏆💸"Take profit and treat yourself, traders. You deserve it!💪🏆🎉
Entry 📈 : "The vault is wide open! Swipe the Bearish loot at any price - the heist is on!
however I advise to Place sell limit orders within a 15 or 30 minute timeframe most nearest or swing, low or high level for Pullback Entries.
Stop Loss 🛑:
📌Thief SL placed at the nearest/swing High or Low level Using the 8H timeframe (950.000) Day/Swing trade basis.
📌SL is based on your risk of the trade, lot size and how many multiple orders you have to take.
Target 🎯: 800.000 (or) Escape Before the Target
⚙💿XPD/USD "Palladium" Metal Market Heist Plan (Swing/Day Trade) is currently experiencing a Neutral trend (there is a chance to move bearishness),., driven by several key factors.👇👇👇
📰🗞️Get & Read the Fundamental, Macro, COT Report, Quantitative Analysis, Sentimental Outlook, Intermarket Analysis, Future trend targets.. go ahead to check 👉👉👉🔗
Detailed Explanation ✍️
Fundamental Analysis 📊: Balances all factors, showing fragility at 900.000 ⚖️.
Macroeconomic 🌐: Slowdown 📉 and USD strength 💪 suppress prices.
Geopolitical ⚔️: Supply risks muted 🕊️, stabilizing levels.
Supply/Demand ⚖️: EV demand drop 🔋 outweighs supply issues ⛏️.
Technical 📈: 900.000 pivotal—support holds 🏞️, momentum flat 🚫.
Sentiment 😊: Cautious traders, no strong bias 🤷♂️.
Seasonal 🍂: Q2 softness reinforces price 📉.
Intermarket 🔗: Lags gold/platinum 🥇💿, tied to USD/equities 💵📉.
Market Sentiment 👥: Mixed, tepid across groups 😐.
Trend Prediction 🔮: Long-term bearish 📉 with short-term swings 🎢.
Outlook 🌟: Neutral now ⚖️, trending bearish 📉 unless disrupted ⚡.
⚠️Trading Alert : News Releases and Position Management 📰 🗞️ 🚫🚏
As a reminder, news releases can have a significant impact on market prices and volatility. To minimize potential losses and protect your running positions,
we recommend the following:
Avoid taking new trades during news releases
Use trailing stop-loss orders to protect your running positions and lock in profits
💖Supporting our robbery plan 💥Hit the Boost Button💥 will enable us to effortlessly make and steal money 💰💵. Boost the strength of our robbery team. Every day in this market make money with ease by using the Thief Trading Style.🏆💪🤝❤️🎉🚀
I'll see you soon with another heist plan, so stay tuned 🤑🐱👤🤗🤩

XPD/USD "The Palladium" Metals Market Heist Plan🌟Hi! Hola! Ola! Bonjour! Hallo! Marhaba!🌟
Dear Money Makers & Robbers, 🤑 💰💸✈️
Based on 🔥Thief Trading style technical and fundamental analysis🔥, here is our master plan to heist the XPD/USD "The Palladium" Metals market. Please adhere to the strategy I've outlined in the chart, which emphasizes long entry. Our aim is the high-risk Red Zone. Risky level, overbought market, consolidation, trend reversal, trap at the level where traders and bearish robbers are stronger. 🏆💸Book Profits Be wealthy and safe trade.💪🏆🎉
Entry 📈 : "The heist is on! Buy above (960.00) then make your move - Bullish profits await!"
however I advise to placing the Buy Stop Orders above the breakout Level (or) placing the Buy limit orders within a 15 or 30 minute timeframe, Entry from the most Recent or Swing low or high level should be in retest.
Stop Loss 🛑:
Thief SL placed at the recent / nearest low level Using the 4H timeframe (930.00) swing trade basis.
SL is based on your risk of the trade, lot size and how many multiple orders you have to take.
Target 🎯: 1010.00 (or) Escape Before the Target
🧲Scalpers, take note 👀 : only scalp on the Long side. If you have a lot of money, you can go straight away; if not, you can join swing traders and carry out the robbery plan. Use trailing SL to safeguard your money 💰.
XPD/USD "The Palladium" Metals Market is currently experiencing a bullish trend,., driven by several key factors.
📰🗞️Read the Fundamental, Macro Economics, COT Report, Seasonal Factors, Intermarket Analysis, Sentimental Outlook, Future trend predict.
Before start the heist plan read it.👉👉👉
📌Keep in mind that these factors can change rapidly, and it's essential to stay up-to-date with market developments and adjust your analysis accordingly.
⚠️Trading Alert : News Releases and Position Management 📰 🗞️ 🚫🚏
As a reminder, news releases can have a significant impact on market prices and volatility. To minimize potential losses and protect your running positions,
we recommend the following:
Avoid taking new trades during news releases
Use trailing stop-loss orders to protect your running positions and lock in profits
💖Supporting our robbery plan 💥Hit the Boost Button💥 will enable us to effortlessly make and steal money 💰💵. Boost the strength of our robbery team. Every day in this market make money with ease by using the Thief Trading Style.🏆💪🤝❤️🎉🚀
I'll see you soon with another heist plan, so stay tuned 🤑🐱👤🤗🤩

XPD/USD "Palladium vs US Dollar" Metal Market Bullish Heist Plan🌟Hi! Hola! Ola! Bonjour! Hallo!🌟
Dear Money Makers & Robbers, 🤑 💰
Based on 🔥Thief Trading style technical and fundamental analysis🔥, here is our master plan to heist the XPD/USD "Palladium vs US Dollar" Metal market. Please adhere to the strategy I've outlined in the chart, which emphasizes long entry. Our aim is the high-risk Red Zone. Risky level, overbought market, consolidation, trend reversal, trap at the level where traders and bearish robbers are stronger. Be wealthy and safe trade.💪🏆🎉
Entry 📈 : You can enter a Bull trade at any point.
however I advise placing Buy limit orders within a 15 or 30 minute timeframe. Entry from the most recent or closest low or high level should be in retest.
Stop Loss 🛑: Using the 2H period, the recent / nearest low or high level.
Goal 🎯: 956.000 (or) escape Before the Target
Scalpers, take note 👀 : only scalp on the Long side. If you have a lot of money, you can go straight away; if not, you can join swing traders and carry out the robbery plan. Use trailing SL to safeguard your money 💰.
Warning⚠️ : Our heist strategy is incompatible with Fundamental Analysis news 📰 🗞️. We'll wreck our plan by smashing the Stop Loss 🚫🚏. Avoid entering the market right after the news release.
Fundamental Outlook 📰🗞️
Based on the fundamental analysis, I would conclude that the XPD/USD (Palladium/US Dollar) pair is : Bullish
Reasons:
Growing demand from the automotive industry: Palladium is a key component in the production of catalytic converters, which are used to reduce emissions in vehicles. The growing demand for vehicles, particularly in China and other emerging markets, is expected to drive up demand for palladium.
Supply chain constraints: South Africa, the world's largest producer of palladium, has been experiencing supply chain disruptions due to labor strikes and power outages, which is expected to reduce global supply and drive up prices.
Investment demand: Palladium is also used as a store of value and a hedge against inflation, which is expected to drive up investment demand and prices.
Russian sanctions: The sanctions imposed on Russia, a major producer of palladium, are expected to reduce global supply and drive up prices.
However, it's essential to consider the following risks:
Global economic slowdown: A slowdown in global economic growth could reduce demand for palladium and drive down prices.
Substitution with other metals: The use of other metals, such as platinum or rhodium, in place of palladium could reduce demand and drive down prices.
New mining projects: The development of new mining projects could increase global supply and drive down prices.
Bullish Scenario:
Growing demand from the automotive industry and supply chain constraints drive up prices
Investment demand and Russian sanctions support prices
Please note that this is a general analysis and not personalized investment advice. It's essential to consider your own risk tolerance and market analysis before making any investment decisions.
Take advantage of the target and get away 🎯 Swing Traders Please reserve the half amount of money and watch for the next dynamic level or order block breakout. Once it is resolved, we can go on to the next new target in our heist plan.
Keep in mind that these factors can change rapidly, and it's essential to stay up-to-date with market developments and adjust your analysis accordingly.
💖Supporting our robbery plan will enable us to effortlessly make and steal money 💰💵 Tell your friends, Colleagues and family to follow, like, and share. Boost the strength of our robbery team. Every day in this market make money with ease by using the Thief Trading Style.🏆💪🤝❤️🎉🚀
I'll see you soon with another heist plan, so stay tuned 🫂

XPD/USD "Palladium" Market Money Heist Plan on Bullish Side.Hola! My Dear Robbers / Money Makers & Losers, 🤑 💰
This is our master plan to Heist XPD/USD "Palladium" Market based on Thief Trading style Technical Analysis.. kindly please follow the plan I have mentioned in the chart focus on Long entry. Our target is Red Zone that is High risk Dangerous level, market is overbought / Consolidation / Trend Reversal / Trap at the level Bearish Robbers / Traders gain the strength. Be safe and be careful and Be rich.
Entry : Can be taken Anywhere, What I suggest you to Place Buy Limit Orders in 15mins Timeframe Recent / Nearest Swing Low
Stop Loss 🛑 : Recent Swing Low using 4H timeframe
Attention for Scalpers : If you've got a lot of money you can get out right away otherwise you can join with a swing trade robbers and continue the heist plan, Use Trailing SL to protect our money 💰.
Warning : Fundamental Analysis news 📰 🗞️ comes against our robbery plan. our plan will be ruined smash the Stop Loss. Don't Enter the market at the news update.
Loot and escape on the target 🎯 Swing Traders Plz Book the partial sum of money and wait for next breakout of dynamic level / Order block, Once it is cleared we can continue our heist plan to next new target.
Support our Robbery plan we can easily make money & take money 💰💵 Follow, Like & Share with your friends and Lovers. Make our Robbery Team Very Strong Join Ur hands with US. Loot Everything in this market everyday make money easily with Thief Trading Style.
Stay tuned with me and see you again with another Heist Plan..... 🫂

XPD/USD "PALLADIUM" Robbery plan to steal the money in long SideHola ola My Dear,
Robbers / Money Makers & Losers,
This is our master plan to Heist XPD/USD "PALLADIUM" Mines based on Thief Trading style Technical Analysis.. kindly please follow the plan I have mentioned in the chart focus on Long entry. Our target is Red Zone that is High risk Dangerous level, market is overbought / Consolidation / Trend Reversal at the level Bearish Robbers / Traders gain the strength. Be safe and be careful and Be rich.
Note: If you've got a lot of money you can get out right away otherwise you can join with a swing trade robbers and continue the heist plan, Use Trailing SL to protect our money.
Entry : Can be taken Anywhere, What I suggest you to Place Buy Limit Orders in 15mins Timeframe Recent / Nearest Swing Low
Stop Loss : Recent Swing Low using 2h timeframe
Warning : Fundamental Analysis comes against our robbery plan. our plan will be ruined smash the Stop Loss. Don't Enter the market at the news update.
Loot and escape on the target 🎯 Swing Traders Plz Book the partial sum of money and wait for next breakout of dynamic level / Order block, Once it is cleared we can continue our heist plan to next new target.

Palladium XPDUSD Bullish Side Money Heist PlanMy Dear Robbers / Traders,
This is our master plan to Heist PALLADIUM XPDUSD Bank based on Thief Trading style Technical Analysis.. kindly please follow the plan I have mentioned in the chart. Our target is Red Zone that is High risk Dangerous level Police Force is waiting for our arrival, market is overbought / Consolidation / Trend Reversal at the level Bearish Robbers / Traders gain the strength. Be safe and be careful and Be rich.
Note: If you've got a lot of money you can get out right away otherwise you can join with a swing trade robbers and continue the heist plan,
Loot and escape on the target 🎯 Swing Traders Plz Book the partial sum of money Use Trailing Stop To Protect Looted Money and wait for next breakout of dynamic level / Order Block, Once it is cleared we can continue our heist plan to next new target it will update after the Breakouts.
support our robbery plan we can easily make money & take money 💰💵 Join your hands with US. Loot Everything in this market everyday.

XPDUSD Palladium Robbery Plan to make money 🤑💰Dear Indices Robbers/Traders,
This is our master plan to Heist XPDUSD Market based on Thief Trading style Analysis. I have two plans to heist this market please look at the chart I have mentioned in our heist plan whether Bull or Bear. My dear Robbers/Traders current condition is choppy market Don't get trap in this situation wait for breakout,. Please Look at the plan carefully before enter to Rob the money making.
support our robbery plan we can make money take money in every plan 💰💵 Join your hands with US. Loot Everything in this market everyday with my master Plan

⬆️⬆️⬆️💡Palladium Palladium. A rare opportunity to buy and stack at such a low price might not come around for a while. The last time we were at this price was August 2018. The technicals and fundamentals both suggest we are heading much higher.

Palladium to breakdown?Palladium - 24h expiry -
The primary trend remains bearish.
Although the bulls are in control, the stalling positive momentum indicates a turnaround is possible.
Price action has posted a Doji candle and signals a possible reversal of the recent trend.
The bias is to break to the downside.
Our outlook is bearish.
We look to Sell a break of 1572.9 (stop at 1596.9)
Our profit targets will be 1512.9 and 1502.9
Resistance: 1590 / 1605 / 1625
Support: 1574 / 1555 / 1520
Risk Disclaimer
The trade ideas beyond this page are for informational purposes only and do not constitute investment advice or a solicitation to trade. This information is provided by Signal Centre, a third-party unaffiliated with OANDA, and is intended for general circulation only. OANDA does not guarantee the accuracy of this information and assumes no responsibilities for the information provided by the third party. The information does not take into account the specific investment objectives, financial situation, or particular needs of any particular person. You should take into account your specific investment objectives, financial situation, and particular needs before making a commitment to trade, including seeking advice from an independent financial adviser regarding the suitability of the investment, under a separate engagement, as you deem fit.
You accept that you assume all risks in independently viewing the contents and selecting a chosen strategy.
Where the research is distributed in Singapore to a person who is not an Accredited Investor, Expert Investor or an Institutional Investor, Oanda Asia Pacific Pte Ltd (“OAP“) accepts legal responsibility for the contents of the report to such persons only to the extent required by law. Singapore customers should contact OAP at 6579 8289 for matters arising from, or in connection with, the information/research distributed.

Palladium: Bear market rally continuesThe daily palladium chart shows some interesting technical developments.
On September 8, the price action saw a 4.5% daily gain, which broke both the 50-day and 200-day moving averages. Previously, the same breakouts also occurred on July 7 and 8, but in two separate sessions.
With the September 6 lows, a short-term bullish channel may have formed, supporting the palladium bear market rally thesis.
The area between $2,190 and 2,193 is where buyers are now encountering some sellers’ resistance.
If this hurdle is broken, the next one is situated at $2,233 (15 August high), and after that $2,300 (11 August high).
The MACD exhibited a bullish crossover at the zero line. On July 22, the same signal occurred, which then served as a driving force behind the rally to mid-August highs.
Palladium is 37% lower than its March peak, indicating that the major trend remains bearish. To revert this trend, palladium prices must rise decisively above $2,612 (50% Fibonacci retracement of 2022 low-high).
Idea written by Piero Cingari, forex and commodity analyst at Capital.com

Geopolitical Analysis : Wild Palladium Rally [Ukraine Crisis]
A. Element
1. Palladium is a chemical element with the symbol Pd and atomic number 46.
2. It is a rare and lustrous silvery-white metal.
3. It is discovered in 1803 by the English chemist William Hyde Wollaston.
B. Platinum group metals (PGMs)
1. Palladium, platinum, rhodium, ruthenium, iridium, and osmium form platinum group metals (PGMs).
2. They have similar chemical properties.
3. But, palladium has the lowest melting point and is the least dense of them.
C. Application of palladium
1. Catalytic converters (convert as much as 90% of the harmful gases in automobile exhaust into harmless substances)
2. A key component of fuel cells in which hydrogen and oxygen react to produce electricity, heat, and water.
3. Dentistry
4. Medicine
5. Hydrogen purification
6. Chemical applications
7. Groundwater treatment
8. Jewelry
9. Electronics
D. Occurrence
1. Russia
- Norilsk Nickel: 39% of the world's production
2. South Africa
3. Canada
4. U.S
E. Palladium producers
1. Norilsk Nickel (MCX: GMKN, LSE: MNOD), palladium powder, and ingots
2. North American Palladium (NYSE: PAL), Canada's largest producer of palladium operating the Lac des Iles palladium mine near Thunder Bay, Ontario.
3. Stillwater Mining (NYSE: SWC), a major North American palladium miner in Montana.

Palladium - Short!Alternate View to the Previous Chart -->
Palladium - Weekly Chart - Correction wave C is expected to drag the price up to the $1370.00 range. TVC:PALLADIUM CURRENCYCOM:PALLADIUM CAPITALCOM:PALLADIUM OANDA:XPDUSD NYMEX:PA1! FX_IDC:XPDUSD PEPPERSTONE:XPDUSD EASYMARKETS:XPDUSD FX_IDC:XPDUSDG
given chart invalid if price exceeds 2698.61 in the short term.
Educational Purpose Only! Do Analys before taking a position!!!

Palladium - a small short before the move higherPalladium has just provided three reasons why I will look for a retracement before looking for the long.
1. Market has reached a trend line connecting tops - 9 month span
2. Market has hit the 1.272 from high 18th Nov (double top) - low 31th Dec - the 1.272 is the pink line. Note: We need to take in to account the larger swing from Dec15 - present.
3. Market has hit the 618 of the last big swing from high May 21 - 31 Jan - the black line is the 618
From here we look for a pullback to the 382 that happens to be a strong support zone - light blue line
After the pull back we go LONG with an ABCD pattern and the top of our range box to reach our target.

Is palladium okay? PALLADIUM There has been a massive drop on palladium (at least on this ticker) showing a pullback to about $900.

Formation of twin roof pattern and price correctionForm a twin roof pattern and modify it to the points specified in the diagram

PALLADIUM AnalysisAn idea suggesting bull continuation for palladium
Price can be seen to be sitting right on 4.618 of a trend that was drawn within the bull structure
This is a possible recovery point
It also aligns nicely when a trendline is drawn across the top of the two circles, providing a possible target
The green lines are strong support areas if the bull idea does not come to fruition

Amazing Opportunity to buy $PALL b4 precious metal goes BOOOOM!What is PALL ETF?
PALL is first in the space that focuses on palladium exposure in an ETF. The fund tracks the movements in palladium spot price, by providing focused exposure to palladium held in JPMorgan vaults in London and Zurich. ... PALL is structured as a grantor trust preventing trustees from lending the underlying metal.

PALLADIUM - XPDUSD BULLISH CONTINUATION ON THE CARDSPalladium - Monthly chart is making a come back after falling off the cliff in the past few months. The drop can be viewed as a much needed correction in the overall bullish trend in the metals market. Price action is telling me that palladium prices have found the floor and now price looks set to bounce back up to possibly new highs in the next coming months to years.
