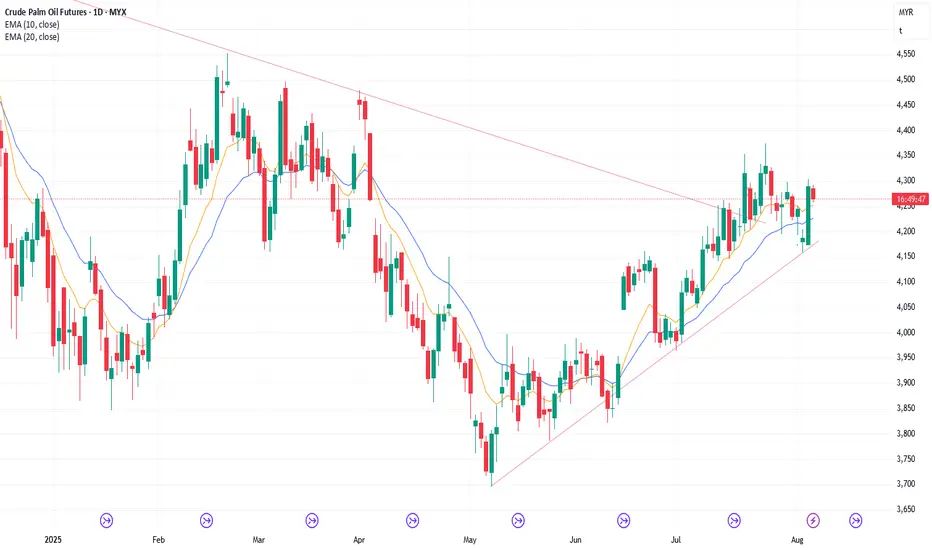
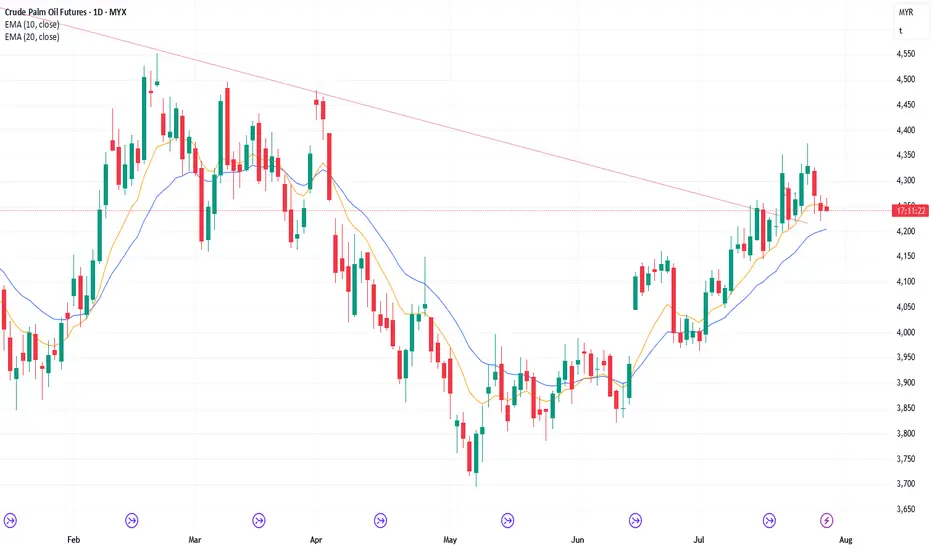
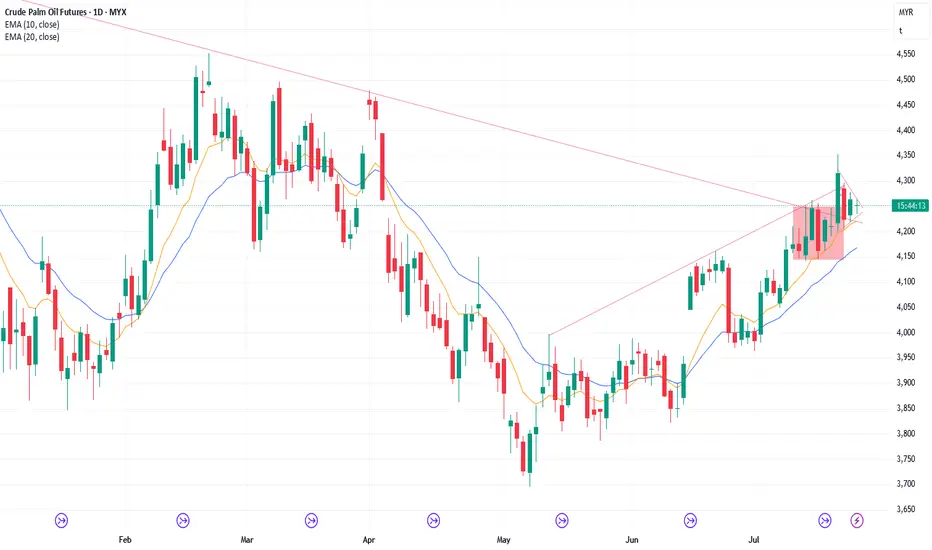
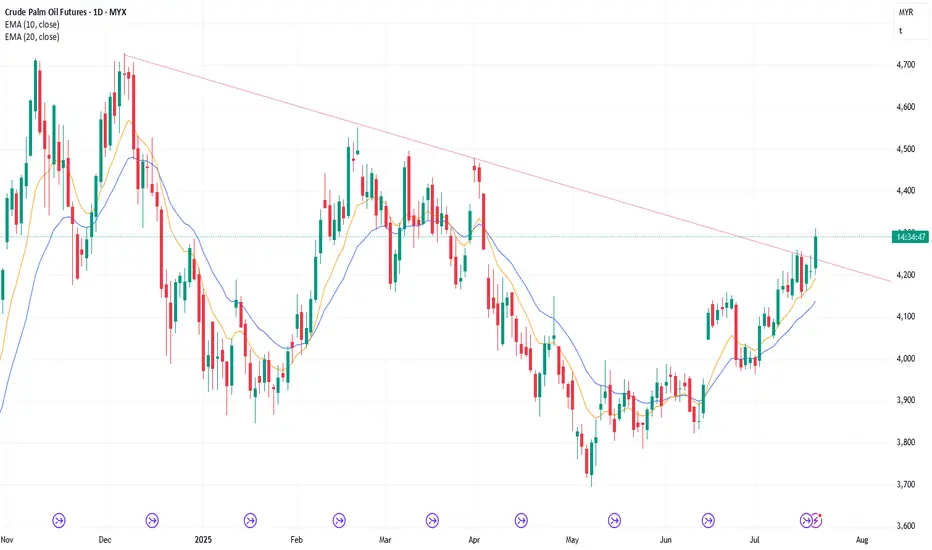
5/8/25 Can Bulls Get A Bull Bar Above 20-Day EMA?
Monday’s candlestick (Aug 4) was a bull doji closing around the middle of its range with prominent tails.
In our last report, we said the market may gap down at the open. Traders would see if the bears could create follow-through selling, closing the day near its low, or if the market would lack follow-through selling and close with a long tail below or a bull body instead.
The market gapped down and traded lower, but the follow-through selling was limited, closing the day with a bull body.
The bulls want any pullback to lack follow-through selling, similar to the last few pullbacks (July 7, July 11, July 15, and July 22).
They see the current move as a two-legged pullback. They want the 20-day EMA or the bull trend line to act as a support level. So far, this appears to be the case.
They want another strong leg up to form the wedge pattern, with the first two legs being Jun 20 and July 24.
They need to create follow-through buying over the next few days to increase the odds of higher prices.
The bears want a reversal from a large wedge pattern (May 15, Jun 20, and Jul 24) and an embedded wedge (Jul 14, Jul 18, and Jul 24).
Previously, the bears were unable to create follow-through selling in the last four selloff attempts (July 7, July 11, July 15, and July 22). Would it be the case again this time?
If the market trades higher, they want another leg down to form the wedge pattern (the first two legs being Jul 29 and Aug 4).
They need to create consecutive bear bars closing near their lows and trading below the 20-day EMA to show they are back in control.
Production for August may be flat or down.
Refineries' appetite to buy looks decent recently.
Export: August demand remains to be seen.
Previously, the buying pressure was slightly stronger than the selling pressure, but not in an overwhelming way yet (no strong consecutive bull bars closing near their highs).
The move up lasted a long time without a significant pullback. The market may have to form a pullback before it moves higher again. The pullback phase is still underway.
Traders will assess the strength of the pullback to determine whether it will be a minor correction or a more significant event. So far, the pullback appears to be minor.
The bears need to create follow-through selling to show they are back in control, something they couldn't do in the last few pullbacks (July 7, July 11, July 15, and Jul 22). So far, the follow-through selling still appears to be limited
For tomorrow (Tuesday, Aug 5), traders will see if the bulls can create a strong bull bar closing above the 20-day EMA.
Or will the market trade higher but close with a long tail above and below the middle of its range instead?
Andrew
Palmoil

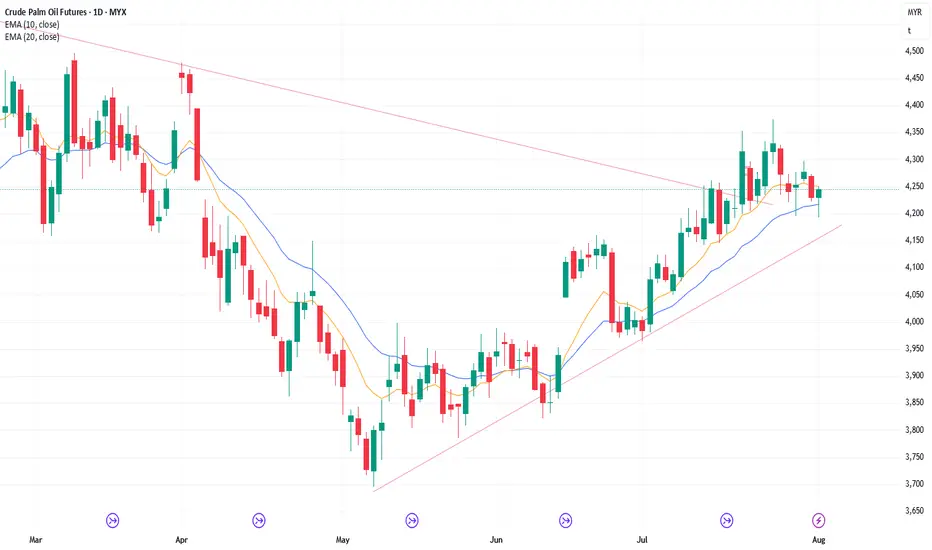
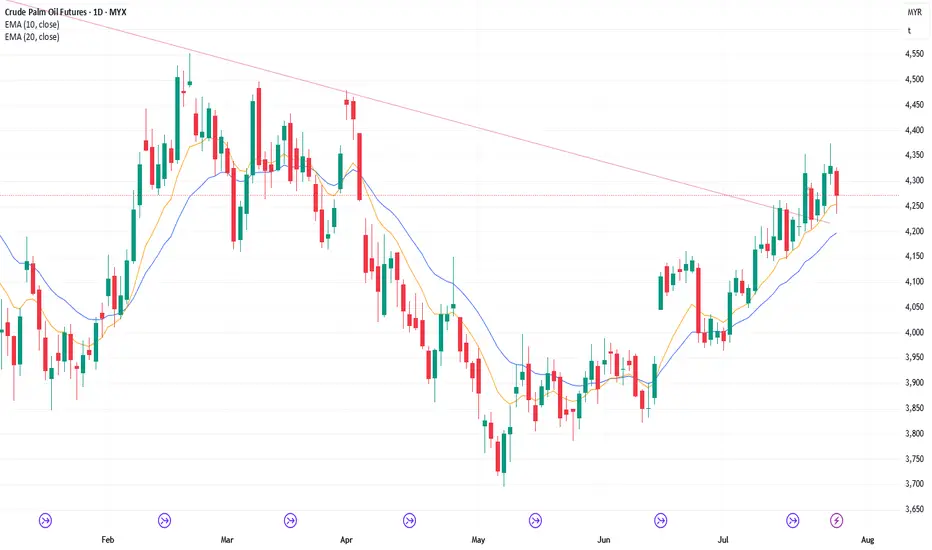
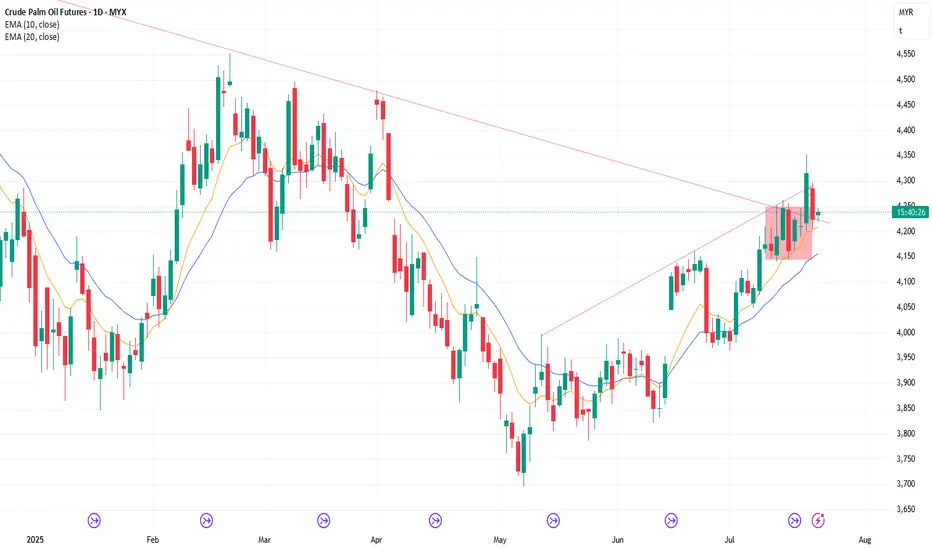
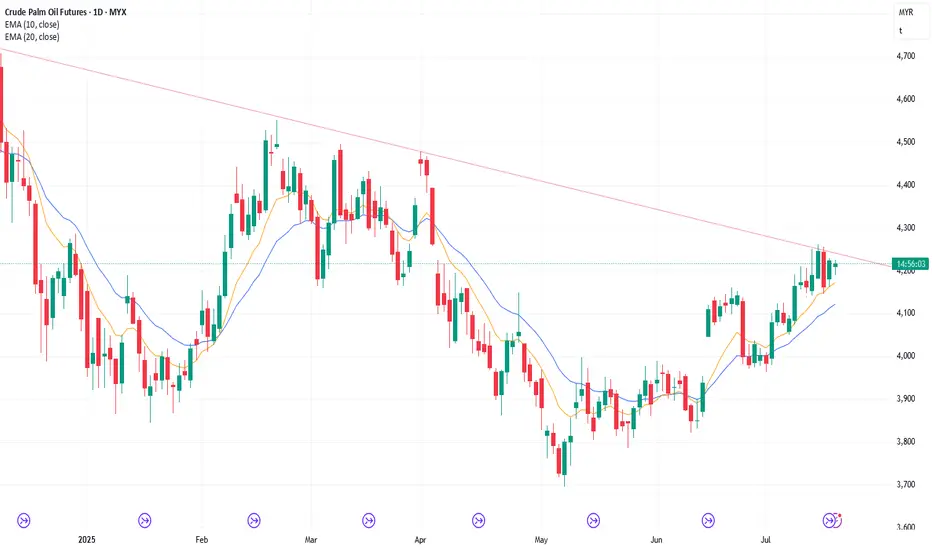
6/8/25 Follow-through Buying or Reverse Down?
Tuesday’s candlestick (Aug 5) was a big bull bar closing near its high and far above the 20-day EMA.
In our last report, we said traders would see if the bulls could create a strong bull bar closing above the 20-day EMA, or if the market would trade higher but close with a long tail above and below the middle of its range instead.
The market formed a strong rally for the day.
The bulls want any pullback to lack follow-through selling, similar to the last few pullbacks (July 7, July 11, July 15, and July 22). So far, this is the case. There is limited follow-through selling again.
They see the recent move as a two-legged pullback. They want the 20-day EMA or the bull trend line to act as a support level. So far, this appears to be the case.
They want a retest of the July 24 high followed by a strong breakout above.
They want another strong leg up to form the wedge pattern, with the first two legs being Jun 20 and July 24.
They hope the pullback has alleviated the recent overbought condition.
They need to create follow-through buying over the next few days to increase the odds of higher prices.
The bears got a pullback from a large wedge pattern (May 15, Jun 20, and Jul 24) and an embedded wedge (Jul 14, Jul 18, and Jul 24).
Previously, the bears were unable to create follow-through selling in the last four selloff attempts (July 7, July 11, July 15, and July 22). Seems to be the case again this time.
They want the market to form a lower high (vs Jul 24) and a double top bear flag (Jul 30 and Aug 5).
They need to create strong bear bars closing near their lows and trading below the 20-day EMA to show they are back in control.
Production for August may be flat or down.
Refineries' appetite to buy looks decent recently.
Export: August demand remains to be seen.
The market formed a pullback testing the bull trend line (Aug 4) and formed a higher low.
Traders will assess the strength of the pullback to determine whether it will be a minor correction or a more significant event. So far, the pullback appears to be minor.
Traders are wondering if the pullback has alleviated the prior overbought condition.
Will the market form a retest of the July 24 high and a breakout above? Or will the market form a lower high and a double top bear flag, followed by another leg down instead?
For tomorrow (Wednesday, Aug 6), traders will see if the bulls can create follow-through buying, even if it is just a bull doji.
Or will the market reverse down sharply below the 20-day EMA instead? If this is the case, it could mean the bulls are not as strong as they had hoped, and things can become dangerous.
Andrew
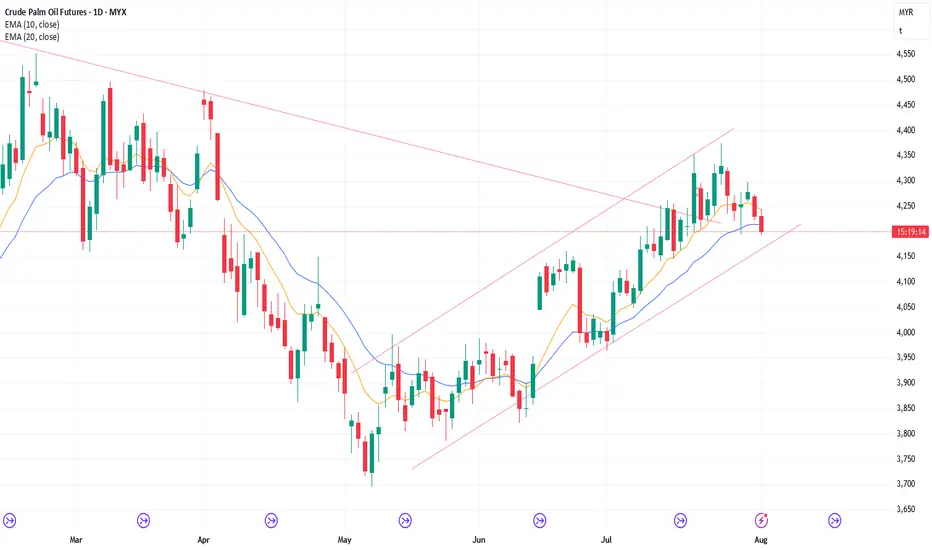
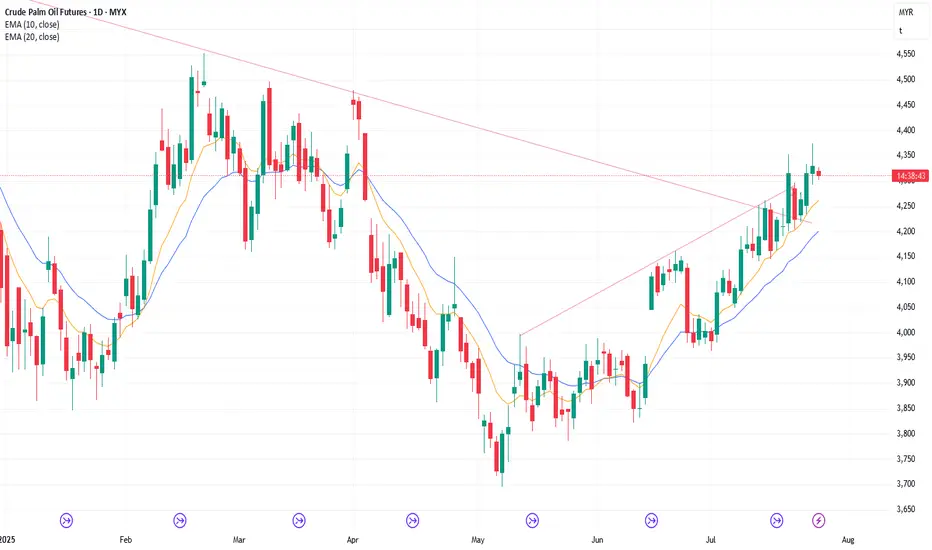
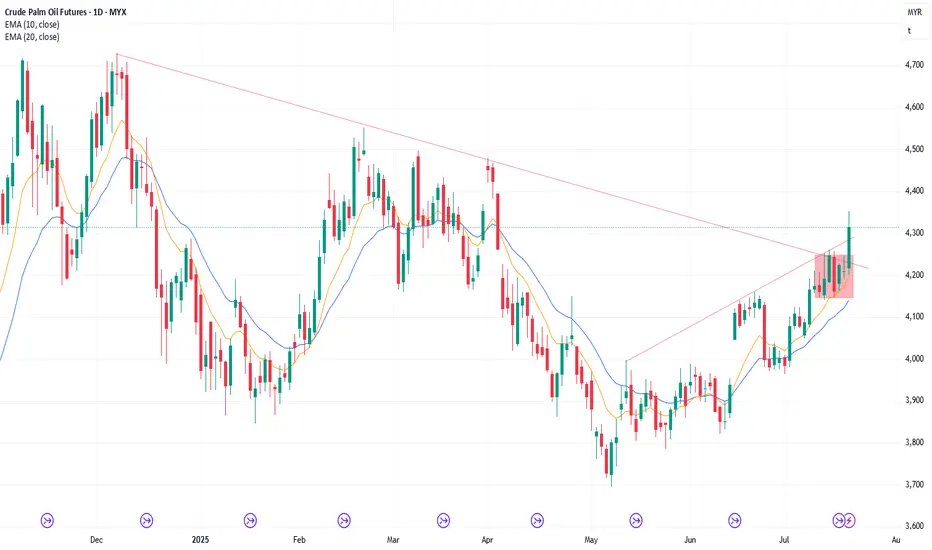
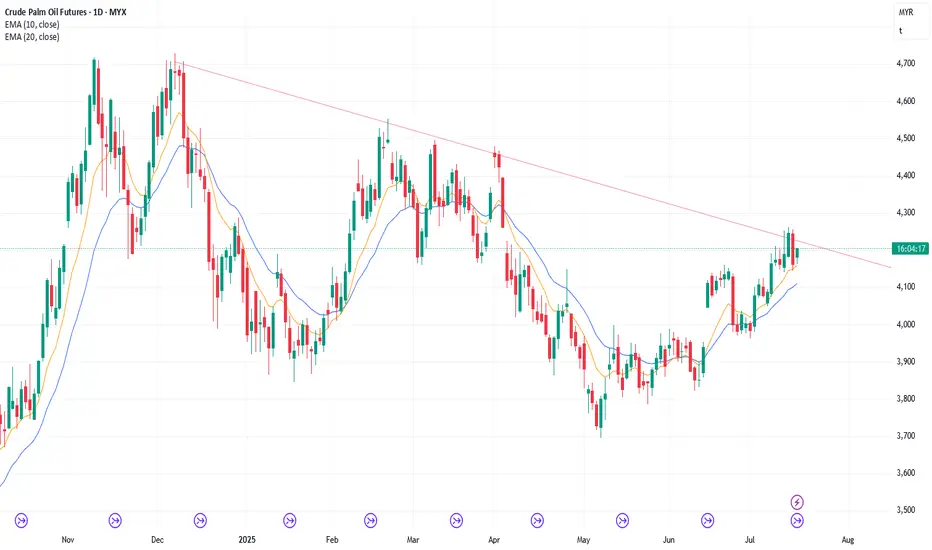
4/8/25 Can Bears Create FT Selling or Not?
Friday’s candlestick (Aug 1) was a bull bar closing bear its high with a long tail below.
In our last report, we said traders would see if the bears could create a strong follow-through bear bar closing near its low, or if the market would trade lower, but close with a long tail below or a bull body instead.
The market traded lower but reversed to close with a bull body and a long tail below.
The bulls want any pullback to lack follow-through selling, similar to the last few pullbacks (July 7, July 11, July 15, and July 22).
They see the current move as a two-legged pullback. If the market trades lower, they want it to lack follow-through selling.
They want the 20-day EMA or the bull trend line to act as a support level.
They want another strong leg up to form the wedge pattern, with the first two legs being Jun 20 and July 24.
The bears want a reversal from a large wedge pattern (May 15, Jun 20, and Jul 24) and an embedded wedge (Jul 14, Jul 18, and Jul 24).
Previously, the bears were unable to create follow-through selling in the last four selloff attempts (July 7, July 11, July 15, and July 22).
They want another leg down to form the wedge pattern (first two legs being Jul 29 and Aug 1). The market may open lower on Monday, creating the 3rd leg down.
They need to create consecutive bear bars closing near their lows and trading below the 20-day EMA to show they are back in control.
Production for August may be flat or down.
Refineries' appetite to buy looks decent recently.
Export: Perhaps about -9% in July. August demand remains to be seen.
So far, the buying pressure is slightly stronger than the selling pressure, but not in an overwhelming way yet (no strong consecutive bull bars closing near their highs).
However, the move up has lasted a long time without a significant pullback. The market may have to form a pullback before it moves higher again. The pullback phase is still underway.
Traders will assess the strength of the pullback to determine whether it will be a minor correction or a more significant event. So far, the pullback appears to be minor.
The bears need to create follow-through selling to show they are back in control, something they couldn't do in the last few pullbacks (July 7, July 11, July 15, and Jul 22).
For tomorrow (Monday, Aug 4), the market may gap down at the open. Traders will see if the bears can create follow-through selling, closing the day near its low.
Or will the market open lower, but lack follow-through selling and close with a long tail below or a bull body instead?
Andrew
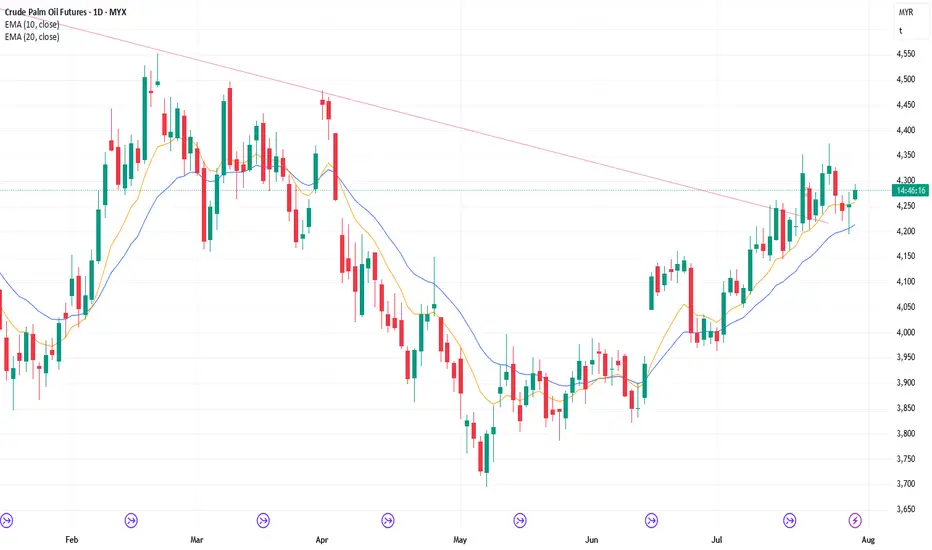
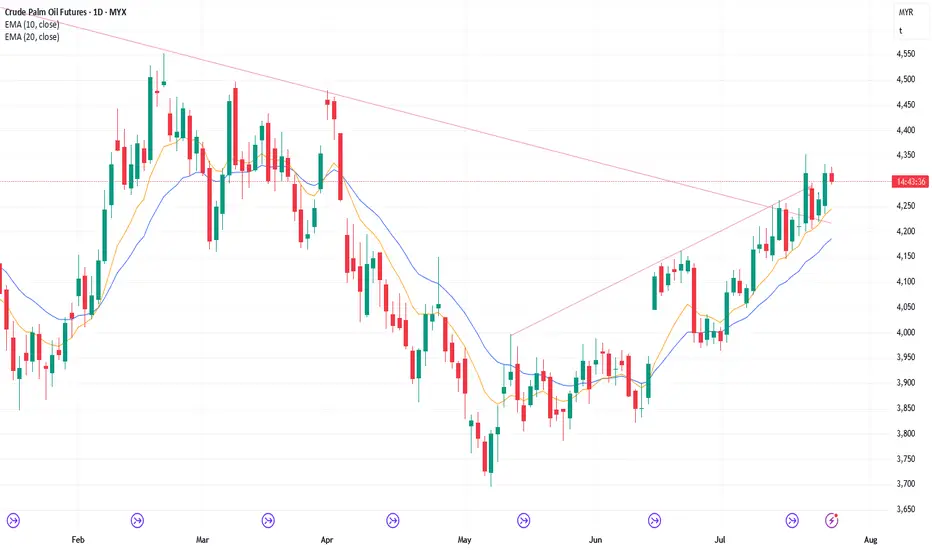
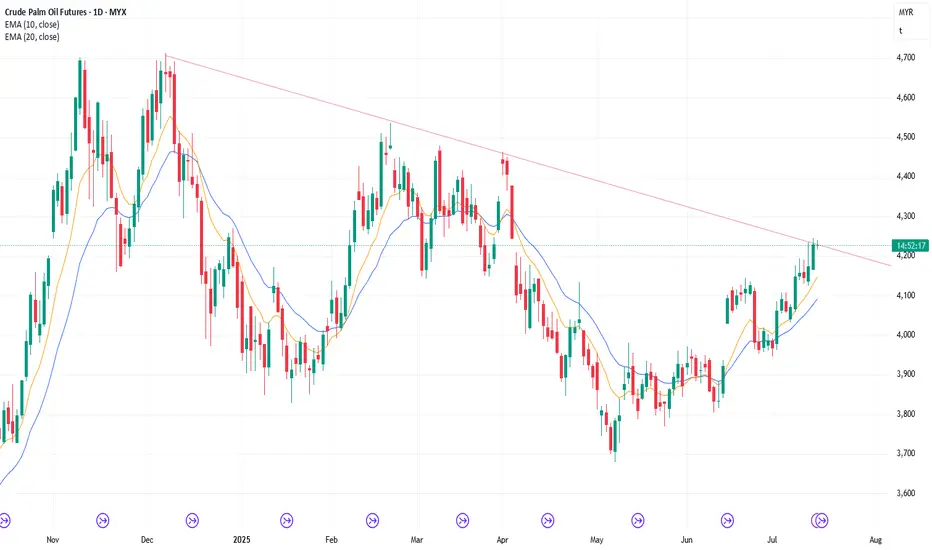
1/8/25 Will Weekly Candlestick Close Near Low or Long Tail Below
Thursday’s candlestick (Jul 31) was a bear bar closing near its low.
In our last report, we said traders would see if the bears could create a strong retest of the July 29 low, or if the market would trade slightly lower, but find support around the 20-day EMA instead.
The market traded lower and continued down in Thursday night's session, testing the 20-day EMA. The monthly candlestick closed in its upper half with a prominent tail above.
The bulls want any pullback to lack follow-through selling, similar to the last few pullbacks (July 7, July 11, July 15, and July 22).
They see the current move as a two-legged pullback.
They want the 20-day EMA or the bull trend line to act as a support level.
They want a double bottom bull flag with the July 29 low.
They want another strong leg up to form the wedge pattern, with the first two legs being Jun 20 and July 24.
The bears want a reversal from a large wedge pattern (May 15, Jun 20, and Jul 24) and an embedded wedge (Jul 14, Jul 18, and Jul 24).
They see Tuesday (July 30) as a pullback and want at least a small second leg sideways to down, retesting the July 29 low. The second leg sideways to down is underway.
Previously, the bears were unable to create follow-through selling in the last four selloff attempts (July 7, July 11, July 15, and July 22).
They need to create consecutive bear bars closing near their lows and trading below the 20-day EMA to show they are back in control.
Production for August may be flat or down.
Refineries' appetite to buy looks decent recently.
Export: Perhaps down -7% in July.
So far, the buying pressure is slightly stronger than the selling pressure, but not in an overwhelming way yet (no strong consecutive bull bars closing near their highs).
However, the move up has lasted a considerable amount of time. The market may have to form a pullback before it moves higher again. The pullback phase is still underway.
Traders will assess the strength of the pullback to determine whether it will be a minor correction or a more significant event. So far, the pullback appears to be minor.
The bears need to create follow-through selling to show they are back in control, something they couldn't do in the last few pullbacks (July 7, July 11, July 15, and Jul 22).
For tomorrow (Friday, Aug 1), traders will see if the bears create a strong follow-through bear bar closing near its low. If they do, the weekly candlestick will close near its low, which will increase the odds of next week trading at least a little lower.
Or will the market trade lower, but close with a long tail below or a bull body instead?
Andrew
31/7/25 Still Sideways to Down Pullback Phase
Wednesday’s candlestick (Jul 30) was a small bull bar with a prominent tail above.
In our last report, we said traders would see if the bulls could create a retest of the July 24 high and a breakout above, or if the market would trade slightly higher but stall around or below the July 24 high, forming bear bars instead.
The market traded slightly higher for the day.
The bulls want a retest of the April high.
They want any pullback to lack follow-through selling, similar to the last few pullbacks (July 7, July 11, July 15, and July 22).
They want the pullback to be shallow (overlapping candlesticks, bull bars and long tails below candlesticks). They want the 20-day EMA to act as a support level. So far, this appears to be the case.
If the market trades lower, they want it to form a double bottom bull flag with the July 29 low.
They want another strong leg up to form the wedge pattern, with the first two legs being Jun 20 and July 24.
The bears want a reversal from a large wedge pattern (May 15, Jun 20, and Jul 24) and an embedded wedge (Jul 14, Jul 18, and Jul 24). They want a major lower high vs the April high.
Previously, the bears were unable to create follow-through selling in the last four selloff attempts (July 7, July 11, July 15, and July 22). They were also unable to create follow-through selling on July 29.
They see Tuesday (July 30) as a pullback and want at least a small second leg sideways to down, retesting the July 29 low.
They need to create consecutive bear bars closing near their lows and trading below the 20-day EMA to show they are back in control.
If the market trades higher, they want it to stall around the July 24 high area, forming a double top.
Production for July is expected to be around the same level as June or slightly higher. August may be flat or down.
Refineries' appetite to buy looks decent recently.
Export: Perhaps down -8% for the month.
So far, the buying pressure is slightly stronger than the selling pressure, but not in an overwhelming way yet (no strong consecutive bull bars closing near their highs).
However, the move up has lasted a considerable amount of time. The market may have to form a pullback before it moves higher again. The pullback phase is still underway.
Traders will assess the strength of the pullback to determine whether it will be a minor correction or a more significant event. So far, the pullback appears to be minor.
The bears need to create follow-through selling to show they are back in control, something they couldn't do in the last few pullbacks (July 7, July 11, July 15, Jul 22, and Jul 29).
For tomorrow (Thursday, July 31), traders will see if the bears can create a strong retest of the July 29 low.
Or will the market trade slightly lower, but find support around the 20-day EMA, closing the day with a long tail below or a bull body instead?
Andrew

30/7/25 Weak Selling Pressure So Far
Tuesday’s candlestick (Jul 29) was a bull doji bar closing in its upper half with a long tail below.
In our last report, we stated traders would see if the bears could create follow-through selling, or if the pullback phase would be weak and sideways, holding above or around the 20-day EMA instead.
The market opened lower but traded sideways to up for the rest of the day, holding above the 20-day EMA.
The bulls want a retest of the April high.
They want any pullback to lack follow-through selling, similar to the last few pullbacks (July 7, July 11, July 15, and July 22). They want the 20-day EMA to act as support. So far, this appears to be the case.
If there is a deeper pullback lasting more than a week, they want it to be shallow (overlapping candlesticks, bull bars and long tails below candlesticks).
They want another strong leg up to form the wedge pattern, with the first two legs being Jun 20 and July 24.
The bears want a reversal from a large wedge pattern (May 15, Jun 20, and Jul 24) and an embedded wedge (Jul 14, Jul 18, and Jul 24). They want a major lower high vs the April high.
Previously, the bears were unable to create follow-through selling in the last four selloff attempts (July 7, July 11, July 15, and July 22).
They need to create consecutive bear bars closing near their lows and trading below the 20-day EMA to show they are back in control.
If the market trades higher, they want it to stall around the July 24 high area, forming a double top.
Production for July is expected to be around the same level as June or slightly higher. August may be flat or down.
Refineries' appetite to buy looks decent recently.
Export: Down 10% in the first 25 days.
So far, the buying pressure is slightly stronger than the selling pressure, but not in an overwhelming way yet (no strong consecutive bull bars closing near their highs).
However, the move up has lasted a long time. The market may have to form a pullback before it moves higher again. The pullback phase is underway.
Traders will assess the strength of the pullback to determine whether it will be a minor correction or something more significant.
So far, the pullback appears to be minor.
The bears need to create follow-through selling to show they are back in control, something they couldn't do in the last few pullbacks (July 7, July 11, July 15, and Jul 22).
For tomorrow (Wednesday, July 30), traders will see if the bulls can create a retest of the July 24 high and a breakout above.
Or will the market trade slightly higher but stall around or below the July 24 high, forming bear bars instead?
Andrew
29/7/25 Pullback Underway, Minor or Something More?
Monday’s candlestick (Jul 28) was a bear doji bar closing around the middle of its range with prominent tails.
In our last report, we stated traders would see if the bears could create follow-through selling, or if the pullback phase would be weak and sideways instead.
The market traded slightly lower. The bears got some follow-through selling, albeit still weak.
The bulls want a retest of the April high.
They want any pullback to lack follow-through selling, similar to the last few pullbacks (July 7, July 11, July 15, and July 22).
If there is a deeper pullback lasting more than a week, they want it to be shallow (overlapping candlesticks, bull bars and long tails below candlesticks).
They want the 20-day EMA to act as support.
They want another strong leg up to form the wedge pattern, with the first two legs being Jun 20 and July 24.
The bears want a reversal from a large wedge pattern (May 15, Jun 20, and Jul 24) and an embedded wedge (Jul 14, Jul 18, and Jul 24). They want a major lower high vs the April high.
Previously, the bears were unable to create follow-through selling in the last four selloff attempts (July 7, July 11, July 15, and July 22).
They need to create consecutive bear bars closing near their lows and trading below the 20-day EMA to show they are back in control.
Production for July is expected to be around the same level as June or slightly higher. August may be flat or down.
Refineries' appetite to buy looks decent recently.
Export: Down 10% in the first 25 days.
So far, the buying pressure is slightly stronger than the selling pressure, but not in an overwhelming way yet (no strong consecutive bull bars closing near their highs).
However, the move up has lasted a long time. The market may have to form a pullback before it moves higher again.
The pullback phase could be underway.
Traders will assess the strength of the pullback to determine whether it will be a minor correction or something more significant.
The bears need to create follow-through selling to show they are back in control, something they couldn't do in the last few pullbacks (July 7, July 11, July 15, and Jul 22).
For tomorrow (Tuesday, July 29), traders will see if the bears can create follow-through selling.
Or will the pullback phase be weak and sideways, holding above or around the 20-day EMA instead?
Andrew
28/7/25 Minor Pullback or Something Stronger?
Friday’s candlestick (Jul 25) was a bear bar closing slightly below the middle of its range with a long tail below.
In our last report, we stated that traders would assess whether the bulls could generate follow-through buying or if the bears would create a strong pullback, which would close the weekly candlestick with a bearish body, thereby creating more doubts and uncertainty.
The bears got a pullback, and the weekly candlestick closed as a bear doji, creating uncertainty.
The bulls want a retest of the April high.
The current move up is in a bull channel with overlapping candlesticks. The bulls are slightly stronger but not yet as strong as they hoped for.
They want any pullback to lack follow-through selling, similar to the last few pullbacks (July 7, July 11, July 15, and July 22).
They want the 20-day EMA to act as support.
If there is a deeper pullback lasting more than a week, they want it to be shallow (overlapping candlesticks, bull bars and long tails below candlesticks).
They want another strong leg up to form the wedge pattern, with the first two legs being Jun 20 and July 24.
The bears want a reversal from a large wedge pattern (May 15, Jun 20, and Jul 24) and a trend channel line overshoot. They want a major lower high vs the April high.
They view the current move as a retest of the prior high (Jul 18), and want it to form a higher high and a double top with July 18.
The problem with the bear's case is that they have not been able to create follow-through selling in the last four selloffs (July 7, July 11, July 15, and Jul 22). The bears are not as strong as they hoped for.
They need to create consecutive bear bars closing near their lows and trading below the 20-day EMA to show they are back in control.
Production for July is expected to be around the same level as June or slightly higher. August may be flat or slightly lower.
Refineries' appetite to buy looks decent recently.
Export: Down 10% in the first 25 days.
So far, the buying pressure is slightly stronger than the selling pressure. The bulls have a slight edge in buying pressure, but not in an overwhelming way yet (no strong consecutive bull bars closing near their highs).
However, the move up has lasted a long time. The market may have to form a pullback before it moves higher again.
If there is a pullback, traders will see the strength to decide whether it will be a minor pullback or something stronger.
The bears need to create follow-through selling to show they are back in control, something they couldn't do in the last few pullbacks (July 7, July 11, July 15, and Jul 22).
For tomorrow (Monday, July 28), traders will see if the bears can create follow-through selling.
Or will the pullback phase be weak and sideways instead?
Andrew
25/7/25 Follow-through Buying or Pullback Instead?
Thursday’s candlestick (Jul 24) was a bull doji closing slightly below the middle of its range with a long tail above.
In our last report, we said the odds slightly favor sideways to up. Traders would see if the bulls could create follow-through buying, breaking above the July 18 high, or if the market would stall around or below the July 18 high area and trade lower instead.
The market broke above the July 18 high, but reversed to close off the day's high.
The bulls want a retest of the April high.
The current move up is in a bull channel with overlapping candlesticks. They want the bull channel to continue.
If there is a pullback, they want it to lack follow-through selling, similar to the last few pullbacks (July 7, July 11, July 15, and July 22).
The bulls need to create a strong breakout above the July 18 high with follow-through buying to increase the odds of a sustained move.
The bears want a reversal from a large wedge pattern (May 15, Jun 20, and Jul 24) and a trend channel line overshoot. They want a major lower high vs the April high.
They view the current move as a retest of the prior high (Jul 18), and want it to form a higher high and a double top with July 18.
The problem with the bear's case is that they have not been able to create follow-through selling in the last four selloffs (July 7, July 11, July 15, and Jul 22). The bears are not as strong as they hoped for.
They need to create consecutive bear bars closing near their lows to show they are at least temporarily back in control.
Production for July is expected to be around the same level as June or slightly higher. August may be flat or slightly lower.
Refineries' appetite to buy looks decent recently.
Export: Down 3% in the first 20 days.
So far, the buying pressure is slightly stronger than the selling pressure. The bulls have a slight edge in buying pressure, but not in an overwhelming way yet (no strong consecutive bull bars closing near their highs).
The bears need to create strong bear bars with follow-through selling to show they are back in control.
For now, I reckon odds slightly favor sideways to up.
For tomorrow (Friday, July 25), traders will see if the bulls can create follow-through buying. If they can, the weekly candlestick will close near its high, which will increase the odds of next week trading at least a little higher.
Or will the bears be able to create a strong pullback instead? If this is the case, the weekly candlestick may close with a bear body, which will create more doubts and uncertainty.
Andrew
24/7/25 Buying Pressure Is Slightly Stronger
Wednesday’s candlestick (Jul 22) was a bull bar closing near its high.
In our last report, we said traders would see if the bulls could create follow-through buying and test near the July 18 high, or if the market would form a breakout below the triangle and ii (inside-inside) pattern instead.
The market formed a breakout of the triangle to retest the July 18 high.
Previously, the bulls got another leg up to form the wedge pattern (Jul 3, Jul 9, and Jul 18).
They want a retest of the April high.
The bulls need to create a strong breakout above the July 18 high with follow-through buying to increase the odds of a sustained move.
The bears want a reversal from a large wedge pattern (May 15, Jun 20, and Jul 18) and a trend channel line overshoot. They want a major lower high vs the April high.
They view the current move as a retest of the prior high, and want it to form a lower high or double top with July 18.
The problem with the bear's case is that they have not been able to create follow-through selling in the last four selloffs (July 7, July 11, July 15, and Jul 22). The bears are not as strong as they hoped for.
They need to create consecutive bear bars closing near their lows to show they are at least temporarily back in control. Currently, they haven't been able to do so.
Production for July is expected to be around the same level as June or slightly higher. August may be flat or slightly lower.
Refineries' appetite to buy looks decent recently.
Export: Down 3% in the first 20 days.
So far, the buying pressure is slightly stronger than the selling pressure. The bulls have a slight edge in buying pressure, but not in an overwhelming way yet (no strong consecutive bull bars closing near their highs).
For now, I reckon odds slightly favor sideways to up.
For tomorrow (Thursday, July 24), traders will see if the bulls can create follow-through buying, breaking above the July 18 high.
Or will the market stall around or below the July 18 high area and trade lower instead?
Andrew
23//7/25 No FT Selling Again. Market in Breakout Mode
Tuesday’s candlestick (Jul 22) was an inside bull bar closing near its high.
In our last report, we said traders would see if the bears could create follow-through selling, or if the market would trade higher and retest the July 18 high instead.
The market traded higher for the day, and the bears failed to get follow-through selling, again.
Previously, the bulls got another leg up to form the wedge pattern (Jul 3, Jul 9, and Jul 18).
They want a retest of the April high.
They see the pullback on Monday (Jul 21) as a retest of the breakout point (bear trend line).
They want the move to lack follow-through selling, like on July 7, July 11, and July 15. So far, this is the case.
The bulls need to create more bull bars to increase the odds of a sustained move.
The bears want a reversal from a large wedge pattern (May 15, Jun 20, and Jul 18) and a trend channel line overshoot. They want a major lower high vs the April high.
They hope that the recent 8-day small trading range will be the final flag of the move.
They want the market to reverse below the bear trend line and the July 14 high within 5 trading days.
If the market trades higher in the next few days, they want it to form a lower high or double top with July 18.
They were unable to create follow-through selling in the last three selloffs (July 7, July 11, and July 15). They failed to create follow-through selling again today (Jul 22). The bears are not as strong as they hoped for.
Production for July is expected to be around the same level as June or slightly higher. August may be flat or slightly lower.
Refineries' appetite to buy looks decent recently.
Export: Down 3% in the first 20 days.
The market is forming another triangle and an ii (inside-inside) pattern. The market is in breakout mode.
The bulls want a breakout above, while the bears want a breakout below the inside bar. The first breakout can fail 50% of the time.
For tomorrow (Wednesday, July 23), traders will see if the bulls can create follow-through buying and test near the July 18 high.
Or will the market form a breakout below the triangle and ii pattern instead?
Andrew
22/7/25 Can Bears Finally Create Follow-through Selling?
Monday’s candlestick (Jul 21) was a big inside bear bar closing in its lower half with a prominent tail below.
In our last report, we said traders would see if the bulls could create follow-through buying, or if the follow-through buying over the next 1-2 days would be limited. If this is the case, it can indicate that the bulls are not as strong as they had hoped.
The market sold off, reversing a big portion of Friday's rally. The bulls did not get follow-through buying.
Previously, the bulls got another leg up to form the wedge pattern (Jul 3, Jul 9, and Jul 18).
They want a retest of the April high.
They see the pullback on Monday (Jul 21) as a retest of the breakout point (bear trend line).
They want the move to lack follow-through selling, like on July 7, July 11, and July 15.
The bulls need to create sustained follow-through buying following the breakout above the bear trend line to increase the odds of a sustained move.
The bears want a reversal from a large wedge pattern (May 15, Jun 20, and Jul 18) and a trend channel line overshoot. They want a major lower high vs the April high.
They hope that the recent 8-day small trading range will be the final flag of the move.
They want the market to reverse below the bear trend line and the July 14 high within 5 trading days.
If the market trades higher, they want it to form a lower high to July 18.
They must create follow-through selling to show they are back in control, something they were unable to do in the last three selloffs (July 7, July 11, and July 15).
Production for July is expected to be around the same level as June or slightly higher. August may be flat or slightly lower.
Refineries' appetite to buy looks decent recently.
Export: Down 3% in the first 20 days.
Traders will be looking to see if the bears can create follow-through selling, something they were unable to do in the last pullback attempts (July 7, July 11, and July 15).
For tomorrow (Tuesday, Jul 22), traders will see if the bears can create follow-through selling.
Or will the market trade higher and retest the July 18 high instead? If this is the case, it will indicate that the bears are not as strong as they had hoped.
Andrew
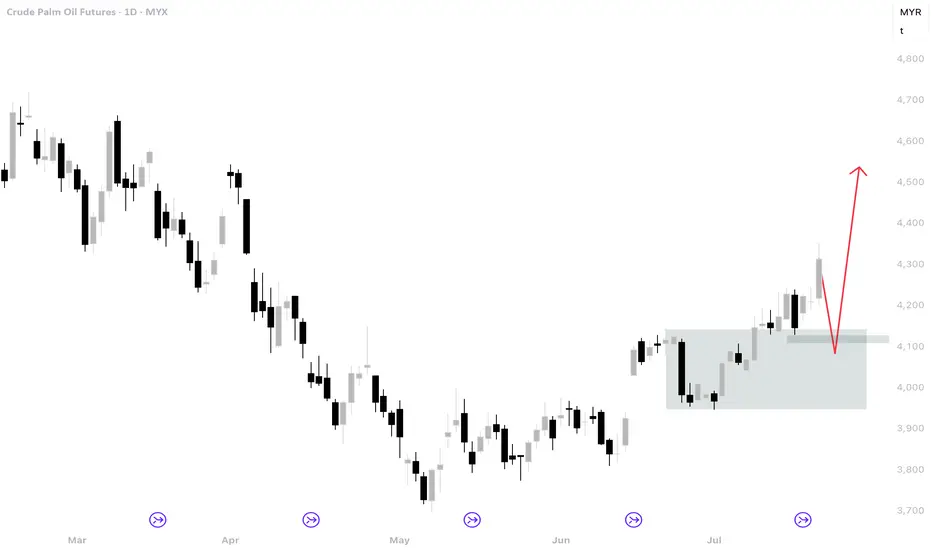
FCPO Week 30 2025: 4500?It took a very long time to reach 4300. The next target is 4500. However it won't be easy because there are a few resistance above 4300. Expecting that price might retrace a bit before continuing higher.
21/7/25 Can Bulls Create FT Buying Over Next Few Days?
Friday’s candlestick (Jul 18) was a big bull bar closing in its upper half with a prominent tail above.
In our last report, we said traders would see if the bulls could close the day's candlestick near its high, or if the daily candlestick would close with a long tail above or below the middle of its range instead.
The market broke above the bear trend line and the July 14 high. The market did not close near its high, indicating some profit-taking activity.
The bulls got another leg up to form the wedge pattern (Jul 3, Jul 9, and Jul 18).
They want a retest of the April high.
The bulls need to create sustained follow-through buying following the breakout above the bear trend line to increase the odds of a sustained move.
The bears want a reversal from a large wedge pattern (May 15, Jun 20, and Jul 18) and a trend channel line overshoot. They want a major lower high vs the April high.
They hope that the recent 8-day small trading range will be the final flag of the move.
They want the market to reverse below the bear trend line and the July 14 high within 5 trading days.
If the market trades higher, they want it to form a double top bear flag with the April high.
They must create strong bear bars to show they are back in control.
Production for July is expected to be around the same level as June or slightly higher.
Refineries' appetite to buy looks decent recently.
Export: Down 6% in the first 15 days.
So far, the bulls created a breakout above the 8-day small trading range in Thursday night's session.
The buying pressure is currently stronger than the selling pressure (no follow-through selling).
For tomorrow (Monday, Jul 21), traders will see if the bulls can create follow-through buying.
Or will the follow-through buying over the next 1-2 days be limited? If this is the case, it can indicate that the bulls are not as strong as they had hoped.
Andrew
18/7/25 Weekly Candlestick To Close Near Its High or Tail Above?
Thursday’s candlestick (Jul 17) was a doji bar with a long tail above.
In our last report, we said traders would see if the bulls could create a follow-through bull bar testing the July 14 high, or if the market would form a lower high (versus July 14) and be followed by some selling pressure instead.
The market traded above Wednesday's high, but the follow-through buying was limited.
The bulls got another leg up to form the wedge pattern (Jul 3, Jul 9, and Jul 18).
They want a retest of the July 14 high, followed by a breakout above the bar trend line. They got it in Thursday night's session.
The bulls need to create sustained follow-through buying above the bear trend line to increase the odds of a sustained move.
The bears want a higher high major trend reversal and a reversal from a large wedge pattern (May 15, Jun 20, and Jul 18). They want a major lower high vs the April high.
They hope the bear trend line will act as resistance. They want the market to reverse below the bear trend line and the July 14 high within 5 trading days.
The bears were unable to create follow-through selling in the last few pullbacks (July 7, July 11, and July 15), which indicates they are not yet as strong as they had hoped to be.
They must create strong bear bars to show they are back in control.
Production for July is expected to be around the same level as June or slightly higher.
Refineries' appetite to buy looks decent recently.
Export: Down 6% in the first 15 days.
So far, the bulls created a breakout above the 8-day small trading range in Thursday night's session.
Traders will see if the bulls can create follow-through buying tomorrow. If they do, the weekly candlestick will close near its high, which will increase the odds of next week trading at least a little higher.
For tomorrow (Friday, Jul 18), traders will see if the bulls can close the day's candlestick near its high.
Or will the daily candlestick close with a long tail above or below the middle of its range instead?
Andrew
17/7/25 Retest Jul 14 High or Weak Follow-through Buying?
Wednesday’s candlestick (Jul 16) was an inside bull bar closing near its high.
In our last report, we stated that traders would observe whether the bears could create a follow-through bear bar, even if it were just a bear doji, or if the market would trade higher to retest the July 14 high. If this is the case, it will indicate the bears are not yet strong.
The market is forming a retest of the July 14 high, currently a lower high.
Recently, the bulls got another leg up to form the wedge pattern (Jul 3, Jul 9, and Jul 14) and a measured move to around the 4250 area.
They see the current move as a pullback and want a retest of the July 14 high, followed by a breakout above the bar trend line.
The bulls need to create more follow-through buying to increase the odds of a sustained move.
The bears want a higher high major trend reversal and a reversal from a large wedge pattern (May 15, Jun 20, and Jul 14). They want a major lower high vs the April high.
They hope the bear trend line will act as resistance.
They see the current move as a retest of the July 14 high and want it to form a lower high.
The bears were not able to create follow-through selling today (Wednesday), which indicates they are not yet as strong as they hope to be.
They must create strong bear bars to show they are back in control.
Production for July is expected to be around the same level as June or slightly higher.
Refineries' appetite to buy looks decent recently. Slightly quieter on Tuesday and Wednesday.
Export: Down 6% in the first 15 days.
So far, the market has traded sideways in the last 7 trading days around the bear trend line area.
Wednesday was an inside bar, which means the market is in breakout mode. The bulls want a breakout above, while the bears want a breakout below the inside bar. The first breakout can fail 50% of the time.
For now, traders will see if the bulls can create follow-through buying to retest the July 14 high, or if the market continues to trade sideways within the small trading range.
For tomorrow (Thursday, Jul 17), traders will see if the bulls can create a follow-through bull bar testing the July 14 high.
Or will the market form a lower high (versus July 14) and be followed by some selling pressure instead?
Andrew
16/7/25 Can Bears Create A Follow-through Bear Bar?
Tuesday’s candlestick (Jul 15) was a big bear bar closing in its lower half with a prominent tail below.
In our last report, we said traders would see if the bulls could create a strong breakout above the bear trend line, or if the market would trade sideways and stall around the bear trend line area (4250-70) in the next few days instead.
The market stalled at the bear trend line and reversed lower, closing below Monday's low.
The bulls got another leg up to form the wedge pattern (Jul 3, Jul 9, and Jul 14).
They want a measured move based on the first leg up (July 1 to July 3), which will take the market to around the 4260 area.
So far, the market is forming a pullback following the wedge pattern at the measured move area.
They see Tuesday as a pullback and want it to have weak follow-through selling. They want a retest of the July 14 high.
The bulls need to create a strong breakout above the bear trend line with follow-through buying to increase the odds of a sustained move.
The bears want a higher high major trend reversal and a large wedge pattern (May 15, Jun 20, and Jul 14). They want a major lower high vs the April high.
They hope the bear trend line will act as resistance. So far, this is the case.
The next target for the bears is the 20-day EMA.
They must create follow-through selling to show they are back in control.
Production for July is expected to be around the same level as June or slightly higher.
Refineries' appetite to buy so far looks decent recently. A bit quiet on Tuesday.
Export: Down 6% in the first 15 days.
So far, the market could be forming a pullback following the wedge pattern.
For now, traders will see if the bears can create follow-through selling. Or will they fail to do so again, as they did on July 7 or July 11?
For tomorrow (Wednesday, Jul 16), traders will see if the bears can create a follow-through bear bar, even if it is just a bear doji.
Or will the market trade higher to retest the July 14 high instead? If this is the case, it will indicate the bears are not yet strong.
Andrew
15/7/25 Bulls Need Strong FT Buying Above Bear Trendline
Monday’s candlestick (Jul 14) was a bull bar closing near its high around the bear trend line area.
In our last report, we said traders would see if the bulls could create a retest of the July 11 high or if the market would trade sideways and stall around the bear trend line area (4230-50) in the next few days instead.
The market traded higher to test the July 11 high, closing slightly below Friday's high.
The bulls got another leg up to form the wedge pattern (Jul 3, Jul 9, and Jul 14).
They want a measured move based on the first leg up (July 1 to July 3), which will take the market to around the 4260 area. The market tested the 4245 today.
The bulls need to create a strong breakout above the bear trend line with follow-through buying to increase the odds of a sustained move.
The bears want a higher high major trend reversal and a large wedge pattern (May 15, Jun 20, and Jul 14).
They want a major lower high vs the April high.
They hope the bear trend line will act as resistance. They must create strong bear bars to show they are back in control.
Production for July is expected to be around the same level as June or slightly higher.
Refineries' appetite to buy so far looks decent.
Export: The data is mixed, and the outcome remains to be seen—estimates down 6% in the first 15 days.
So far, the follow-through selling by the bears is still limited. The buying pressure is stronger.
For now, traders will see if the bulls can create more follow-through buying, or if the move will start to stall around the bear trend line area.
For tomorrow (Tuesday, Jul 15), traders will see if the bulls can create a strong breakout above the bear trend line.
Or will the market trade sideways and stall around the bear trend line area (4250-70) in the next few days instead?
Andrew
14/7/25 Bulls Need Strong Breakout Above Bear Trend Line
Friday’s candlestick (Jul 11) was a bull bar closing slightly below the middle of its range with a long tail above.
In our last report, we said traders would see if the bears can create a strong bear bar closing near its low, or if the market would continue to trade sideways with limited follow-through selling and trade higher to retest Jul 9 high instead.
The market traded slightly below Thursday's low but had limited follow-through selling. The market opened higher during the day but the follow-through buying was limited and closed off its high.
The bulls want another leg up to complete the wedge pattern, with the first two legs being Jul 3 and Jul 9. They got what they wanted.
They want a measured move based on the first leg up (July 1 to July 3), which will take the market to around the 4260 area. The market tested the 4235 area but found some sellers above the swing high (Jun 20).
The bulls need to create a strong breakout above the bear trend line with follow-through buying to increase the odds of a sustained move.
The bears want a higher high major trend reversal and a large wedge pattern (May 15, Jun 20, and Jul 11).
They want a major lower high vs the April high.
If the market trades higher, they want it to form a double top with the July 11 high.
They must create sustained follow-through selling to show they are back in control.
Production for July is expected to be around the same level as June or slightly higher.
Refineries' appetite to buy so far looks decent.
Export: The data is mixed, and the outcome remains to be seen.
So far, the follow-through selling by the bears is still limited. The buying pressure is stronger.
For now, traders will see if the bulls can create more follow-through buying, or if the move will start to stall around the bear trend line area.
For tomorrow (Monday, Jul 14), traders will see if the bulls can create a retest of the July 11 high.
Or will the market trade sideways and stall around the bear trend line area (4230-50) in the next few days instead?
Andrew

11/7/25 FT Selling or, Sideways and Another Leg Up?
Thursday’s candlestick (Jul 10) was a bear doji closing slightly below the middle of its range.
In our last report, we said traders would see if the bears could create a strong bear bar closing near its low, or if the market would trade lower, but close with a long tail below or above the middle of its range instead.
The market traded lower in the night session but there was no strong follow-through selling during the day.
The bulls see the current move forming a small bull flag (a double bottom bull flag on the 60-minute chart).
They want it to form a higher low vs Jul 7.
They want a measured move based on the first leg up (July 1 to July 3), which will take the market to around the 4260 area.
They want another leg up to complete the wedge pattern, with the first two legs being Jul 3 and Jul 9.
The bears see the current move as a retest of the prior high (Jun 20) and want a higher high major trend reversal and a double top bear flag (with the Jun 20 high).
They see the move from June 11 as a large two-legged move. They want a lower high vs the April high.
They must create sustained follow-through selling to show they are back in control.
Production for July is expected to be around the same level as June.
Refineries' appetite to buy so far looks decent.
Export: data is mixed, remain to be seen.
So far, the follow-through selling by the bears is still limited. They are not yet as strong as they hoped for.
For now, traders will see if the current move is simply a pullback, to be followed by another leg up after the pullback, or if the bears can start creating sustained follow-through selling.
For tomorrow (Friday, Jul 11), traders will see if the bears can create a strong bear bar closing near its low.
Or will the market continue to trade sideways with limited follow-through selling, and trade higher to retest Jul 9 high instead?
Andrew

10/7/25 Can The Bears Create Sustained FT Selling?
Wednesday’s candlestick (Jul 9) was a bull doji closing in its lower half with a long tail above.
In our last report, we stated that traders would observe whether the bulls could create a follow-through bull bar above the June 20 high, or if the market would trade slightly higher but close with a long tail or a bearish body instead.
The bulls got some follow-through buying in the morning but the market reversed to close with a long tail above and closing below yesterday's low.
The bulls hope to get a retest of the July 4 high and the Jun 20 high. They got what they wanted.
They want a measured move based on the first leg up (July 1 to July 3), which will take the market to around the 4260 area.
They see the current move as a pullback and want it to form a higher low vs Jul 7.
They want another leg up to complete the wedge pattern, with the first two legs being Jul 3 and Jul 9.
The bears see the current move as a retest of the prior high (Jun 20) and want a higher high major trend reversal and a double top bear flag (with the Jun 20 high).
They see the current move from June 11 as a large two-legged move. They want a lower high vs the April high.
They must create sustained follow-through selling to show they are back in control.
Production for July should be around June's level.
Refineries' appetite to buy so far looks decent.
Export: Up 31% in the first 5 days of July.
Inflation expectations subsiding slightly with the U.S. 10-Year Yield down 1% currently.
For now, the market is trading slightly in the night market. Traders will see if this is simply a pullback, to be followed by another leg up or if the bears can create sustained follow-through selling.
For tomorrow (Thursday, Jul 10), traders will see if the bears can create a strong bear bar closing near its low.
Or will the market trade lower, but close with a long tail below or above the middle of its range instead?
Andrew

9/7/25 Can Bulls Create More FT Buying?
Tuesday’s candlestick (Jul 8) was a big bull bar with a small tail above and closing above Jun 20 high.
In our last report, we said traders would see if the bulls could create a follow-through bull bar testing the July 4 high, or if the bears would be able to create a strong bear bar closing below Monday's low instead.
The market formed a strong follow-through bull bar testing the Jun 20 high.
The bulls hope to get a retest of the July 4 high and the Jun 20 high. They got what they wanted.
They want a measured move based on the first leg up (July 1 to July 3), which will take the market to around the 4260 area.
They must create follow-through buying above the Jun 20 high to increase the odds of a sustained move.
The bears see the current move as a retest of the prior high (Jun 20) and want a higher high major trend reversal and a double top bear flag (with the Jun 20 high).
They see the current move from June 11 as a large two-legged move. They want a lower high vs the April high.
The problem with the bear's case is that the follow-through selling has been limited still.
They must create strong bear bars to show they are back in control.
Production for July should be around June's level.
Refineries' appetite to buy so far looks decent.
Export: Up 31% in the first 5 days of July.
The Trump Tariffs have increased inflation expectations as reflected in the rising US Government Bond 10 Year Yield. Rising inflation expectations can cause commodities to rise.
The bulls need to create follow-through buying above the Jun 20 high for a sustained move higher.
For tomorrow (Wednesday, Jul 9), traders will see if the bulls can create a follow-through bull bar above the Jun 20 high.
Or will the market trade slightly higher but close with a long tail or a bear body instead?
Andrew

8/7/25 No FT Selling, Can Bulls Create FT Buying or No?
Monday’s candlestick (Jul 7) was a bull bar closing near its high.
In our last report, we said traders would see if the bears could create a strong bear entry bar, or if the market would trade slightly lower but close with a long tail below or with a bull body instead. If this is the case, it could indicate the bears are not yet strong.
The market opened lower with limited follow-through selling followed by sideways to up trading into the close.
The bulls hope to get a retest of the July 4 high and the Jun 20 high.
They must continue to create follow-through buying to show they are back in control.
The bears see the current move as a retest of the prior high (Jun 20) and want a lower high major trend reversal and a double top bear flag (with the Jun 20 high).
They want a resumption of the broad bear channel.
They must create strong bear bars to show they are back in control.
Production for July should be around June's level.
Refineries' appetite to buy so far looks decent.
Export: Up 31% in the first 5 days of July.
The market is forming a retest of the Jun 20 high and so far, it is a lower high.
The bulls need to do more to show they are back in control by creating follow-through buying trading above the Jun 20 high for a sustained move higher.
If the market continues to stall around or below the Jun 20 high, the odds of a double top bear flag (with Jun 20) will increase.
For tomorrow (Tuesday, Jul 8), traders will see if the bulls can create a follow-through bull bar testing the July 4 high.
Or will the bears be able to create a strong bear bar closing below Monday's low instead?
The market continues to exhibit frequent reversals and poor follow-through buying and selling, which are the hallmarks of trading range price action.
Andrew
