Direction of FCPO #3So now the price are at the confluence, waiting for tomorrow either the market will continue going up or it still can't break that area and make rebound go downwards. We will see tomrrow. only trade what u see and not what u hear. #HTYT
Palmoil

Direction of FCPO #2As the previous chart, we predict the market will rebound at the support. But turns out it break the support already and heading towards to the line channel. From there we can see which direction we can focus. either bear or bull. we can make decision from there. but from now. we can go for short

FCPO bullish for a while nowLast week closed at significant zone. Monthly trendline. Today open as change month candle push the price towards bullish as well.
Target may be around 4050 - 4100

Palm and crude oil long term bullish? R u sure?! 21/June/221)On Charts : Charts consist of 3-Dimensions - The X-factor ( Time or Cycle ), The Y- factor ( Price Geometry ), AND The Z-factor ( The Speed ).. 2)On Elliot Wave / Market Structure : Unlike Textbook written rule : ALL Impulsive wave comprise of ONLY a-b-c sub-waves NOT 1,2,3,4,5 waves.. AND there is NO Truncated 5th wave BUT ONLY wrong wave counts...
Disclaimer

FCPO - Bear taking breathAfter a series of 8th falling trading days, price of FCPO constructed a short term bullish AB=CD pattern in daily TF. It's been oversold but not in extreme way yet.
Current price is hovering around 5477 (the neck line of a bigger pattern) and may have a small rebound before a continuation.
May focus on the price action along with confirmation of oscillator especially the neck line region for a the 1st TP of 6070. If the price manage to piercing thru the red dash trendline, the 2nd TP would be 6512.
-Signing Out-

FCPO view AS per the charts - the FCPO contract is expected to take a support at 5050-5100 and then bounce to 5900-6000 before falling down to 4100 leves

FCPO Enters reversal zone?There might be a short bullish run as price reaches reversal zone and Weekly trendline.
Current momentum shows some fading of bearish momentum.
Short-term bulls may run for a while before the bearish momentum can push - broke through the reversal zone.

CPO Unstoppable Rocket? Or…. Ranging?What’s other factors would continue to move palm oil prices?
1. India imports hit 12-months low on sky high prices in CPO. This may led to demand further decline as buyers are price sensitive as it relies on imports for 60% of its needs. Currently, India rely on existing stockpiles and incoming domestic rapeseed crop to meet domestic demand
2. Revision of export restriction from Indonesia as food protectionism grows. Companies need to allocate 30% of exports for home market. Government are taking steps to safeguard domestic food supplies after Russia’s invasion of Ukraine.
3. Malaysia announced, the border restrictions is entering endemic phase start from 1st of April 2022 , which also means that more foreign workers arrive in May and June.
4. Soybean oil lower after USDA (United States of Department Agriculture) monthly forecasts showed world soybean supplies above expectations.
5. Declined in crude oil prices reduce demand for biodiesel blending.
Technical View:
1. Again shooting star formed as profit taking after touched on historical high at 7268 which indicate sell signal.
2. Stochastic K% line is moving up in weekly and crossed up in daily chart which indicates market likely to resume its uptrend
We have mixed signals this week. We expect market may move within range of 6500-7100.
Suggestion Trade:
Short if stay below 6600
Target Stop Loss (resistance level) 6783
Target Profit level (support level)
TP1 6417 TP2 6051
Long if stay above 7000
Target Stop Loss (support level) 6817
Target Profit level (resistance level)
TP1 7183 TP2 7549
** DISCLAIMER: FOR INFO ONLY. TRADING CARRIES RISK **

CPO Continue above 7000? Or Ready for Correction?FCPO declined by nearly 8% on last Friday and closed at 6276 as profit taking took place, but posted 2nd weekly gains after touched on historical high at 7108.
So, what’s make palm oil now the costlier edible oil among the 4 major edible oils?
Global commodities rallied following EU bans certain Russian banks from SWIFT bank payment system which aimed to stuttering the Russia economy and introduces further restrictions.
The war expected to disrupt the processing and export of Ukraine oilseeds crops for at least 1 month and curb flow of sunflower seed to the European Union.
2. India’s reserve is facing a depletion in stocks levels with a lack of shipments of sunflower oil from the Black Sea Region.
India requested Indonesia temporary reduce their biodiesel blending rules and increase the exports to mitigate disrupted supplies of sunflower oil.
3. Rising concerns on adequate palm supply levels for post-Ramadan restocking.
While expectations of higher productions in coming months as high output cycle kicks in and government also announced new migrant workers to work in plantation sector capped gains.
4. Soybean oil prices closed lower as profit taking and rainfall in Brazil and Argentina eased dry weather conditions.
Technical View:
1. Shooting star formed at resistance level of 7100, which indicates market losing uptrend momentum and also a reversal signal
2. Stochastic K% line is crossing down in both weekly and daily chart which indicates downtrend signal
We expect market may have short term retracement with immediate support level at 5825
Suggestion Trade:
Short if stay below 6200
Target Stop Loss (resistance level) 6365
Target Profit level (support level)
TP1 6035 TP2 5705
Long if stay above 6800
Target Stop Loss (support level) 6635
Target Profit level (resistance level)
TP1 6965 TP2 7295
**Disclaimer: Trading Carries Risks**

FCPO continue 6400 or Short Term Correction?FCPO set their biggest weekly gains in more than 9 months despite a sharp drop on Friday, as Russia’s attack on Ukraine stoked worries about global edible oil supply.
I believe who traded last week hopefully you were enjoy the roller coaster ride in the market.
For your information, Ukraine is a major key supplier of grains and oilseeds globally, any further threats to trade will shift demand for other vegetable oil such as SBO and CPO.
As we all knew that the unresolved Ukraine crisis may further erode the supply of vegetable oil, grains, crude and natural gas due to the grain flows disruption in Black Sea export region with all transportation avenue were disrupted by military operation.
Besides, India stopped buying sunflower oil following ports suspended operation on Russia’s invasion of Ukraine. India pivot to alternate oils could further support Malaysian palm oil and US soyoil.
On the other hand, surging in COVID cases also keep palm oil prices elevated for 1H2022 as shortage of labour and supplies.
Furthermore, worsening yields in Argentina and Brazil pushed importers to buy from alternative supplier.
Technical View:
Market uptrend remains with immediate support at 5825.
Stochastic K% line is crossing down at overbought zone in both weekly and daily chart which indicates reversal signal
We expect market may have short term retracement with immediate support level at 5625
Suggestion Trade:
Short if stay below 5885
Target Stop Loss (resistance level) 6023
Target Profit level (support level)
TP1 5747 TP2 5471
Long if stay above 6200
Target Stop Loss (support level) 6062
Target Profit level (resistance level)
TP1 6338 TP2 6614
** DISCLAIMER: FOR INFO ONLY. TRADING CARRIES RISK **


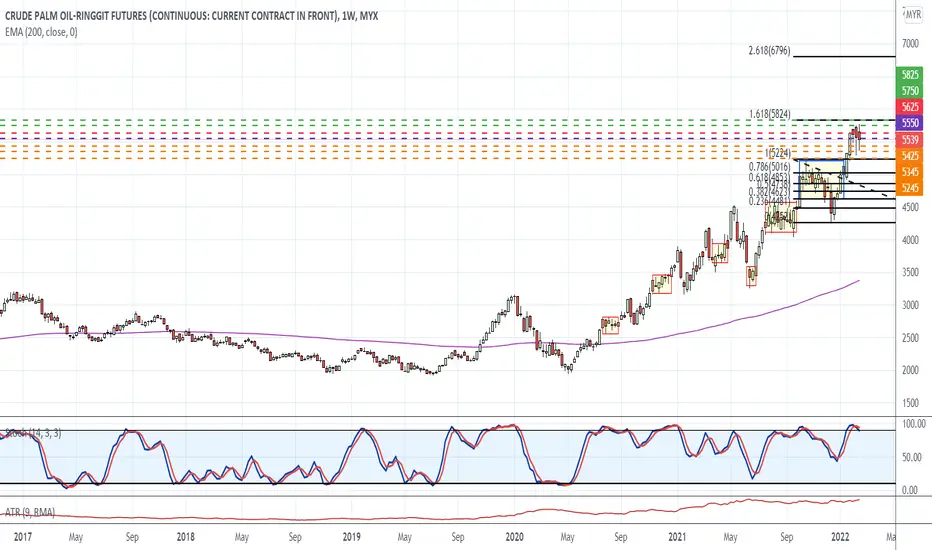
Reversal Signs Continue in Palm Oil MarketFCPO closed higher at 5539 after gap filled at 5612 by last Friday but posted weekly losses.
What were the factors that caused crude palm oil prices struggling to maintain above 5800?
1. India reduce farm infrastructure tax on CPO to 5%, which will effective until Sept 30, with the objective to increase gap between CPO and refined palm oil to benefit the domestic refining industry.
2. Uncertainties over Ukraine crisis lead market to stay vigilant on possible rising tensions.
3. Better production forecast for 1st half of Feb limited the upside of palm oil prices
4. Soybean Oil continue to move higher as concerns over weather forecast and fire incident broke in US biodiesel plant at Claypool, Indiana. Furthermore, India acquire massive purchase on soybean oil as high soybean price for local crushers to reduce output.
5. Crude Oil prices extended losses as prospects of extra supply from Iran. Weaker crude make palm less attractive option for biodiesel feedstock.
6. Near month spread widen as traders foresee East Malaysia production remains weak for Feb.
Technical View:
Market reversal signs remains. Gravestone doji formed in Daily Chart after market tried to move higher but sell down by the market.
Stochastic K% line is crossing down at overbought zone in both weekly and daily chart
We expect market may have short term retracement with immediate support level at 5350.
Suggestion Trade:
Short if stay below 5550
Target Stop Loss (resistance level) 5625
Target Profit (support level)
TP1 5425 TP2 5345 TP 5245
Reversal Signs in Palm Oil Market?Market closed slightly higher at 5573 last Friday after tighter range move.
Some key factors continue to weigh on palm oil prices:
1. Indonesia had expanded its export permit requirement for palm oil products where exporters must sell 20% of their exports at home and with price cap to other derivatives. This further raising fears of global supply disruptions. The regulation valid from Feb 15.
2. Latest Malaysia Palm Oil Board data showed lower inventories and production due to labor shortage and flooding; lower exports due to rising palm oil prices
However, analysts’ expectations that current high price not sustainable
3. some participants expecting production to pick up in March as Malaysia Government targeting full scale reopening of international border
4. . Soybean oil continued uptrend, as LaNina brought in hot weather across key South America growing areas and strong demand on US soybean
5. Strong crude oil prices amid ongoing worries about supply disruptions from the Russia and Ukraine crisis
Technical View:
1. Market uptrend paused with hanging man formed at resistance level of 5750, indicates reversal signal
2. Stochastic reached overbought level and K% line is crossing down which signalled reversal signal
We expect market may have short term retracement if market unable to stay above 5500.
Suggestion Trade:
Short if stay below 5365
Target Stop Loss (resistance level) 5478
Target Profit (support level)
TP1 5252 TP2 5026
Long if stay above 5685
Target Stop Loss (support level) 5572
Target Profit (resistance level)
TP1 5798 TP2 6024

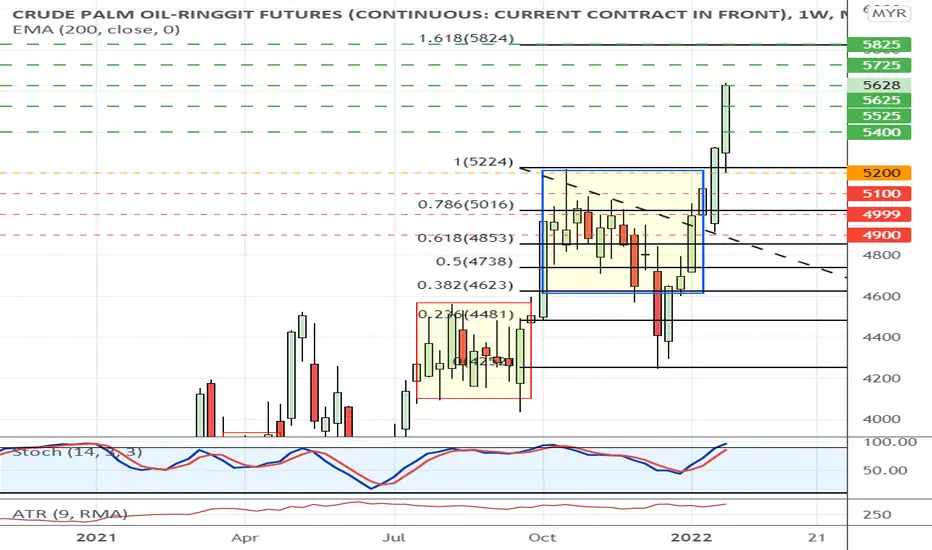
Palm Oil Hit Historical High 5639Palm oil prices closed higher at 5628 after hit historical high at 5639.
Factors continue to affect palm oil prices:
1. Indonesia finalize their export restriction plan which set 20% local supply rule for palm oil exporters effective from last Thursday (27 Jan 2022). Government also implement price cap on local sales of CPO and palm olein, effective from 1st Feb 2022.
2. Soybean oil stayed firm on Ukraine Crisis amid fears of potential supply disruption due to military action from Russia to Ukraine.
3. Traders selling in far months and shipments from India and China dropped likely to limit the upside of the market.
Technical View:
1. Market remained bullish.
2. Stochastic reached overbought level
We expect market may face some profit taking activities due to shortened week and thin trading volume.
Suggestion Trade:
Long if stay above 5625
Target Stop Loss (support level) 5400
Target Profit (resistance level)
TP1 5725 TP2 5825
FTSE FCPO Palm Crude Oil Futures #FCPO #FCPO1!Palm Crude Oil Futures FCPO short-term still looking bullish.
Profit Chip of PFT indicator at 38%, if surpass 50% greater chance to reach upper trend line resistance @5500
Bull Bear Energy (BBD) indicator show Dark Green bar turning into Light Green (momentum turns weak) - short term correction on way.
#fcpo #fcpo1! #bursasaham #palmoilfutures #commodities #tradingfutures #ftseklci
#technicalanalysis #technicalindicator #technicalchart #mcdx #bbd #trendline #chartpattern
Disclaimer:
This published Idea is solely for the purpose of opinion sharing only, and should not be used as investment advice or recommendation to buy or sell any security.
Get your trade advise from a legit broker, your trade is solely your own responsibility.
Thank you.

CPO Extended Gains to Record HighPalm oil prices gone up higher as expected and closed at 5322 after posted record high at 5327.
Factors continue to affect palm oil prices:
1. New export permit policy in Indonesia which required exporters of vegetable oil to gain approval for their shipments and declare their domestic sales with the objective to ensure that sufficient supply of cooking oils in domestic market. New regulation may curb supplies from Indonesia and led buying spree in Malaysia. Besides, India likely to shift their imports to soybean and sunflower oils as replacement.
2. Bullish sentiment in global oil market continue to support palm oil prices.
3. Strong gains in soybean oil following latest weather forecast that turned into hot and dry weather in Argentina and Southern Brazil which may result further yield deterioration.
Technical View:
1. Market break new high and closed above 5300
2. Stochastic remains uptrend signal
Suggestion Trade:
Long if stay above 5300
Target Stop Loss (support level) 5100
Target Profit (resistance level)
TP1 5425 TP2 5525 TP3 5625

FCPO Continue RallyPalm oil prices posted gains and closed at 5123, after touched on resistance at 5164. For your information, FCPO January contract expired last Friday. Next Monday onwards will be started to trade on FCPO April contract.
Factors continue to affect palm oil prices:
1. Market remained concerns over labour shortages which caused lower palm oil production.
2. Price movement in related vegetable oils as they compete for a share in global vegetable oils market.
3. India edible oil imports in 2022 expected to fall by 2% as the country boost domestic production, said Malaysian Palm Oil Council at an industry conference.
4. Malaysia Biodiesel Association urged industry officials to come to terms with steady decline in imports of palm-based biofuels in European Union following its decarbonization agenda.
5. Stronger Ringgit Malaysia pressured as overseas buyers find it costlier to purchase Malaysia CPO.
Technical View:
1. Market closed above 4900
2. Stochastic shows K% line crossed up which indicates uptrend signal.
Suggestion Trade:
Long if stay above 5000
Target Stop Loss (support level) 4850
Target Profit (resistance level)
TP1 5100 TP2 5200 TP3 5300
Happy Trading!! Cheers.
** DISCLAIMER: FOR INFO ONLY. TRADING CARRIES RISK **

CPO Breaking Historical High 5220Palm Oil prices extended gains and closed sharply higher at 4993. As market eyeing on upcoming MPOB data to assess the impact on production from flooding in recent weeks disrupting harvesting activities . MPOB data is scheduled to release its Dec data on Monday.
Factors continue to affect palm oil prices:
1. Ongoing flash floods in several states continue to weigh on palm oil prices
2. Seasonal low production cycle during the 1st half year with higher demand expected ahead of Chinese New Year.
3. Labor Shortage remained key issue
4. Higher CPO prices raising worries over stiff competition from Indonesia
5. Persistent supply concerns in Soybean Oil due to hot and dry weather in South America served support in palm oil prices
Technical View:
1. Market closed sharply higher at 4993, right below level of 5000
2. Stochasctic shows K% line is crossing up which indicates market turning up and resume uptrend.
We expect market continue to move higher if market stays above level of 5000.
Suggestion Trade:
Long if stay above 5000
Target Stop Loss (support level) 4850
Target Profit (resistance level)
TP1 5100 TP2 5250 TP3 5350

Palm Oil Upside Continue?Palm oil prices extended gains and closed higher at 4697
Technical view:
Market holding well at 4600
Market likely to move within the range of 4600-5220
Stochastic level: Market move towards mid level which indicates sideway range signal in the market
Suggestion Trade:
Market expect to move in range to upward bias ahead of Malaysia Palm Oil Board data release (10 Jan 2022)
Initial Long if market stays above or near support level at 4600
Stop Loss (Support level) 4465
Target Profit (Resistance level) TP1 4900 TP2 5000 TP 5100
Initial Short if near resistance level at 5100
Stop Loss (Resistance level) 5230
Target Profit (Support level) TP1 4700 TP2 4600 TP 4500
Disclaimer: Trading Carries Risks.
Happy Trading!! Cheers.

Can Palm Oil Prices Hold at 4000?Palm oil prices slumped and closed at 4408. Last week palm oil prices broken support level at 4700 and touched on weekly low at 4245.
There were several factors we can look into:
1. Market plunged about 4.5% on Wed after cargo surveyor reported larger than expected drop in export
2. Price movement in global vegetable oils market also affected palm oil prices
3. Stronger crude oil prices has make palm oil prices more attractive
4. Tightening production due to labor shortage continue serve support to palm oil prices
5. Stronger dollar and weakening Ringgit Malaysia also helps in palm oil prices
Technical view:
1. Long Black bar formed which indicates bearish signs
2. support level at 4500 broken, market further test support level at 4200
3. Stochastic level= remain bearish sign
Suggestion Trade:
maintain bearish view for FCPO next week with immediate resistance level at 4545
Initial Short if market below 4545
Stop Loss (Resistance level) 4845
Target Profit (Support level)
TP1 4200 TP2 4025 TP 3875

Can CPO Sustain Above 4500?Palm oil plunged as expected last week. Market hit weekly low at 4567 and closed at our 1st resistance level.
Main reason of the weakness in CPO market due to the uncertainties over the impact Omicron coronavirus variant which dented demand for CPO.
Technical view:
1. Immediate resistance level: 4700-4730
2. Stochastic level= Sell Signal remain
Suggestion Trade:
Initial Short position
Stop Loss at resistance level: 5000-5100
Target Profit level (support level)
S1 4500 S2 4385-4400 S3 4200
Disclaimer: Trading Carries Risks.
Happy Trading, Cheers.

Palm Oil Breaking Ranging level 4700-5220?Palm Oil market has been ranging for the past few weeks:
Reasons behind as below:
1. Rising in new COVID-19 cases in Europe (- export demand= price drop)
2. Weakness in Crude Oil and Soybean Oil (- demand= price drop)
3. Weather concerns (- supply = price up)
4. Labor shortage (- supply = price up)
5. RM weakening (+ demand = price up)
Technical View:
1. Strong resistance level at 5000
2. Stochastic at Overbought level, K% & D% line cross down (Sell sign)
Suggestion Trade:
Short
Stop Loss (Resistance level) 5220
Target Profit (Support level) 4650, 4500, 4385-4400
Happy Trading!! Cheers.
** DISCLAIMER: FOR INFO ONLY. TRADING CARRIES RISK

When will FCPO STOP Ranging 4750-5220?Palm oil markets has been ranging between 4750-5220 since Oct 2021, topics remained hot within the palm oil industry including
1. labor force shortage,
2. global supply and demand concerns amid resurgence in COVID-19 cases especially in Europe.
Uncertainty in
3. related edible oil due to weather concerns and
4. OPEC+ decisions to maintains its output
which continued to serve support in palm oil industry.
Furthermore,
5. dollar strengthened helped to made palm oil prices more attractive compare to other vegetables oils.
Palm oil market likely to continue maintain its ranging until weightage in issues mentioned above showed unbalance.
Trading Strategies remained neutral, or you may initiate ranging trading strategies.
Long when near support 4750-4850
Short when near resistance 5100- 5220
Good Luck & Happy Trading.
Cheers
