🔥 CAKE Underperforming: Bearish ChannelCAKE was, untill recently, one of my favorite tokens on the market. It had a very active community, great website and staking possibilities.
However, since CAKE topped late August, CAKE is one of the few tokens that lagging the market. Either this has to do with the staking rewards being sold in huge numbers, or that there's just better alternatives in the market now.
In any case, CAKE's bearish channel is definitely a thing. With the recent dump from BTC, CAKE followed and bounced off the top of the channel.
In case of a prolonged bearish move from BTC, I'm looking at the bottom trend line for a potential bounce.
Happy trading!
Pancakeswap

Breakout incoming in Cake daily temporaryA beautiful triangule is forming in the Cake chart, the price seems so backwarded becoause it's been lateralizing for more than a month while other alts are flying and an altcoin season incoming.
My actual target is at least o.78 in fib extension taking us to 30usd.

Cake king termThis year cake will grow up a lot
Still good to be bought it can go up to 30$ until beginning of December

CAKEUSDT (PancakeSwap) - Coin of the WeekPancakeSwap is an automated market maker (AMM) — a decentralized finance (DeFi) application that allows users to exchange tokens, providing liquidity via farming and earning fees in return. It launched in September 2020 and is a decentralized exchange for swapping BEP20 tokens on Binance Smart Chain. PancakeSwap uses an automated market maker model where users trade against a liquidity pool. These pools are filled by users who deposit their funds into the pool and receive liquidity provider (LP) tokens in return.
Technically, PancakeSwap is in a big consolidation on the daily timeframe that started at the end of August this year. When we look at the 4h chart we see that the price is consolidating below the blue trendline marked on the chart. We have 2 working scenarios for this cryptocurrency right now, the first would be a break of the blue trendline and a continuation to the upside and second a retest of the support area and then a reversal to the upside. Although a total downside with a retest of the lows of May is possible, the probability for this scenario is low.
Trade with care.
Best regards,
Financial Flagship
Disclaimer: The analysis provided is purely informative and it should not be used as financial advice. Remember that you need a plan before you start trading; so, take this knowledge and use it as a guidebook that will ultimately help you understand the market and easily predict your next move.

CAKE BULL RUNhi , our general opinion for cake is long in the longterm (when alt season begin),as you know in fib retracement between 0,786 and 0,618 zone is golden packet it means we should test it one day and our weakly strong support is 30$ and also 0,618 retracement is 30$ so our first target for cake is 30$ , second target is 44$ because its ATH . and as you see in the chart , cake make a descending chart pattern ( descending chart pattern in old market is a bearish but in new market like cryptocurrency is a bullish chart pattern) and it broke the pattern and our target based by pattern is 54,92$

CAKE - TRADE SETUP - LIVE TA$CAKE has been in accumulation zone for so long now and it this video I have discussed why I think CAKE is going to give massive gains in the next few weeks!
The best entry is at the market price till $18 and the targets are mentioned.
I have gone through each and every details and have done all the analyses so you guys can copy the idea and learn it from my strategies as well :-).
If you liked this video guys make sure to give a thumbsup and share :-)

CAKE 4Hcake is moving in symmetrical triangle almost near breakout. if we see successful breakout and retest we could see good bounce in cake. NFA

CAKE/USDTEverything is clear in the picture. Ask your questions in the comments section. Please like, good luck🙏♥️


PancakeSwap 2 Possible Buying ScenariosHello Friends!
Looking at the Daily graph, it looks like there are two possible buy entry scenarios for PankcakeSwap.
Scenario 1:
==========
It may reverse from around the same area where it is trading at the moment with a proper price action.
Scenario 2:
It may bounce back strongly from the tested support zone coming ahead.
In both cases, I am with buy and would not consider SELL. So I suggest if you have already bought it, then hodl. It shall regain upward momentum soon.
Good Luck!
Happy trading
Regards,
CrypFo Trader

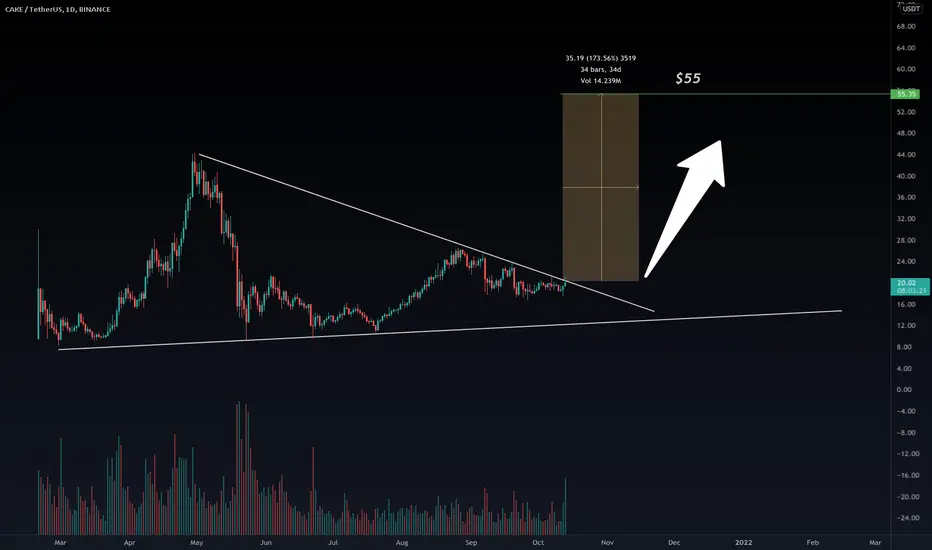
CAKE, Bitcoin, Daily Chart, Trading signal, BTC $Cake daily timeframe set up for a breakout from resistance. Waiting for a confirmation to flip resistance to support. Target 55
CAKE MASSIVE GAINS INCOMING? BUY HERE$CAKE has been in a down trend since April and it is now breaking out with volume. All the indicators are showing bullish signs with every tf flipping into bullish from all smaller timeframes to the htfs till 12 hours are now bullish.
OBV turning green, MACD bullish, RSI holding and breaking downtrend, trendline broken and bullish harmonics.
I am taking entry here at market price $20.7 and will tp it till 22.65 - $34
Also, alot of developments has been going on CAKE with their NFT marketplace launchin I was expecting this breakout to happen soon and looks like we're ready now!
Good Luck.
If you liked this idea give a like and a follow :-)

last change to buy xoxo 2 confirmations and it's in the 60 of fibo. Also, hammer-pinbar just made and an old envolve candle. enjoy ur earnings in 3 weeks.

PancakeSwap (CAKE) - October 12Hello?
Welcome, traders.
By "following", you can always get new information quickly.
Please also click "Like".
Have a nice day.
-------------------------------------
(CAKEUSD 1W Chart) - Mid-Long-Term Perspective
Above the 9.0760290 point: the uptrend expected to continue
15.1757179-16.1961041 or more: Expected to create a new wave.
(1D chart)
First resistance section: 19.0812658-20.0044522
Second resistance section: 29.5050311-32.1525450 (psychological resistance section)
First support section: 15.1757179-16.1961041
Second support section: 9.0760290-10.8786252
It is important to maintain the price above the first resistance section.
Therefore, it is necessary to check if the price can be maintained above the first support level.
If it falls from the first support zone, it may touch the second support zone, so trade cautiously.
-----------------------------------------------------
(CAKEBTC 1W Chart) - Mid- to long-term perspective
1652 Satoshi-2070 Satoshi or more: Expected to continue upward trend
2687 Satoshi-2903 Satoshi or higher: Expected to create a new wave.
(1D chart)
First support section: 2687 Satoshi-2903 Satoshi section
Second support section: near the 1652 Satoshi point
First resistance section: 4174 Satoshi-4837 Satoshi section
Second resistance section: 6578 Satoshi-7068 Satoshi section
------------------------------------------
We recommend that you trade with your average unit price.
This is because, if the price is below your average unit price, whether it is in an uptrend or in a downtrend, there is a high possibility that you will not be able to get a big profit due to the psychological burden.
The center of all trading starts with the average unit price at which you start trading.
If you ignore this, you may be trading in the wrong direction.
Therefore, it is important to find a way to lower the average unit price and adjust the proportion of the investment, ultimately allowing the funds corresponding to the profits to regenerate themselves.
------------------------------------------------------------ -----------------------------------------------------
** All indicators are lagging indicators.
Therefore, it is important to be aware that the indicator moves accordingly with the movement of price and volume.
However, for the sake of convenience, we are talking in reverse for the interpretation of the indicator.
** The MRHAB-O and MRHAB-B indicators used in the chart are indicators of our channel that have not yet been released.
(Because it is not public, you can use this chart without any restrictions by sharing this chart and copying and pasting the indicators.)
** The wRSI_SR indicator is an indicator created by adding settings and options to the existing Stochastic RSI indicator.
Therefore, the interpretation is the same as the traditional Stochastic RSI indicator. (K, D line -> R, S line)
** The OBV indicator was re-created by applying a formula to the DepthHouse Trading indicator, an indicator disclosed by oh92. (Thanks for this.)
** Support or resistance is based on the closing price of the 1D chart.
** All descriptions are for reference only and do not guarantee a profit or loss in investment.
(Short-term Stop Loss can be said to be a point where profit and loss can be preserved or additional entry through split trading. It is a short-term investment perspective.)

CAKE/USDT cooking up a good rallyAnalysis of CAKE/USDT showing that if resistance (green line) does break, we could see much higher prices.
Entry price = $18.15
Stop Loss = $16.35
Take Profit Levels (TPs):
1st = $26.28
2nd = $30.05
3rd = $36.90
4th = $42.70

CAKE: breakout very soonBINANCE:CAKEBUSD
BINANCE:CAKEUSDT
Just now, BTC broke out from a mid-term resistance line, retested, then pumped hard to 55555usd. I see similar pattern on CAKE. The breakout is imminent. I don't predict price of few days. Let's see the real bull run target.
Now CAKE is in a half-year correction. It finished a classic Wyckoff re-accumulation phase and entered phase E. A new uptrend is coming. My first target is the previous high of 44, then 100. Price around 150 is very like in altseason.
Fundamentally, Pancakeswap is the most important application on BSC. Its token CAKE, unlike the solely reward token (UNI, CRV, et al.), is extremely useful. CAKE's single asset pools have the highest and most stable yields among DeFis. It is also a distribution platform of other tokens, and an NFT marketplace. I'm expecting CAKE entering Top 10 rank at least for a short while.
And there is a secret behind CAKE: Why does Binance not open futures trading for CAKE? Because CZ has his plan.
NFA.

BTCUSD long ideaHello traders, today I'm going to post an interesting wave is unfolding in BTC/USD.
At the price we are now, it looks like the bears are not done with the bulls yet.
We should be bottoming arround 38k-37k where I set my buys with a huge potential to the upside and a very low risk opportunity.
SL for this entry should be up to 36600 and the target is set at 59k.
Let the market go to you.
If you like my content and would like to support me here is my BUSD BEP20 Address:
0x66a39a58d46f21fd61ced8ce11c7420f5b977182

Ascent or descentIf we look at the chart, we see that a long-term downtrend line is pushing the price down . But in the meantime, we see a support.The trend line and the support form a descending triangle Trading volume also confirms that it will be a downtrend.If this happens and the price goes down, the most important support will be in the range of 11.09 , But if buyers perform a miracle and break the downtrend line, the price can rise significantly.
This is not a financial recommendation.
This is just a technical analysis.

CAKE TIME ! PANCAKE SWAP BULLISH PHASE ?Look for the current range developing to breakout for the next bullish phase to ensue towards the former ATH.

🔥 CAKE Reversal: Bullish Move Continued?Since my last CAKE call, CAKE has gained over 20% in value. The reversal area did indeed mark the low for the short term and the $21.5 target was reached with ease.
As of now, we're trading near the 0.236 Fibonacci retracement. CAKE is trying to pierce through it, but facing strong selling pressure.
We either pierce through the resistance in the coming couple of hours, or we might re-test the 0.382 retracement to try again later.
Target for the next week is placed at $26.
Happy trading!

CAKEUSDT HIGH TIME FRAMESo here are the resistances and supports of cake usdt on higher time frames. it is a bit laggy then the rest of the market but will perform better in the coming days as NFT market place will be launched on pancakeswap. hope you like my idea.

Cake to 36.86 $ USD?In my last analysis we were able to observe a triangle that was invalidated as a result of the market crash, however not everything is negative. This fall managed to show us a bullish channel in #CAKE which is very positive.
Within this new bullish channel we have a new triangle that should break no later than the beginning of October and would have as its main target $ 31 and then $ 36.86.
If the market remains bullish, I have no doubt that Cake will have a big rally, assuming that we are days away from its first anniversary and that every Monday there is a burning of tokens that represents 1% / 3% of the current supply. #Cake #Pancakeswap

my analisys of cakethe new wave is coming ! i'm new to tech analysis and crypto in general but i keep the hard work done .
this charting was made in 13/9/21 05:00 ULT
