$MINE Golden cross on the 1 hour chartThe hourly chart looks like we have a golden cross coming the next day or two. A golden cross is extremely bullish and price goes parabolic.
#goldencross #mine
Give the chart a like if you like what you see!
Parabolic

NZDUSD LONG OPWe see rejection from 91.6 on our DXY chart. Giving us confirmation of possible bounce of support and trendline line for the NZD. As you can also see our Stoch shows we are oversold quite a bit. We want to see a break of 200EMA if not collect profits at rejection of 200EMA.

Long Term Investments💫❤️💎❤️💫 Long term investments: $UAVS $BANT $OEG $GEVO $SIRC $SBE $BLNK $OPTT $MARA $XSPA and $IBIO 💫❤️💎❤️💫
SPACs: $CCIV $RMG $LGVW $APXT $NGA $GIK $TPGY $CGRO $FII $AMCI $THBR $BTWN $FTOC $PSTH $THC
(from everyone in room, cumulative efforts)

HEXO Parabolic SetupNice upward channel, with a falling wedge - featuring as the function of the recent cup & handle formed on NYSE:HEXO .
Macroscopically, this is acting as the right shoulder of an Inverse Head and Shoulders, which takes this to $6 if this very obvious technical confluence fulfills.

SRMUSDT is in Parabolic Curve (Cup)!2.0264 entry
Stop Lose 1.438
TP1: 2.69
TP2: 3.2290
TP3: 3.6689
According to technical analysis, SRMUSDT is in the parabolic move and is making a parabolic curve. Cup in making!

$AMC PT 250-378 within 4 months$AMC PT 250-378 within 4 months
Multi-leg:
1) Mar 19th 2021 $40 Calls
2) Jan 21st 2022 $40 Calls


SPX's Angle sets at 67, we are getting close to "Vertical Angle"***Shorts are down 91 Billion $ just in January, who could blame them wish such " Steep Angle"

OEG - more upsideOEG broke out of a 2 year basing formation @ 1.80 on 28 Dec and went on to more than double in just 2 weeks. It hit into the resistence @ 4.45 (zoom out 3-5 years to see these resistences) before consolidating in a bull flag.
The chart has the anatomy of a multi-bagger hence I'm still bullish on it and expect it could go quite a bit higher in the longer run. However, watch out for some resistences on the way up and expect some consolidating along these levels. Stop loss needs to be placed wide enough in order to catch a bigger move hence position size accordingly.
Disclaimer: This is just my own analysis and opinion for discussion and is not a trade advice. Kindly do your own due diligence and trade according to your own risk tolerance. Thank you. Feel free to give me your thoughts ! :)

FRSX - Bought the DipFRSX first broke out of a 2.5 year base resistence @ $2.96 on 22 December last year and began a parabolic move that saw it's price more than tripled in just one month.
Profit taking that began 2 days ago after hitting a hight of 11.22 brought it down to 8.05 today (briefly breaching the 38% fibonacci retracement level) before appearing to find support. Consolidations has been on smaller volumes which is a sign that most of the bulls are still holding on to this stock.
I longed the dipped @ about 8.20 today, but considering the high volatility of penny stocks, I shall have my intial stop loss placed slightly below the 50% fib retracement level @ 7.49.
This stock has a LAST resistence @ 11.70. A close above this level eventually will improve it's odds of a sustainable trend once it gets into All-Time-High.
Let's see if it plays out!
Disclaimer: This is just my own analysis and opinion for discussion and is not a trade advice. Kindly do your own due diligence and trade according to your own risk tolerance. Thank you. Feel free to give me your thoughts ! :)

Chart is worthless when Parabolic...Instead of a channel I prefer a trend line thru the heart of the chart. Huge catalysts coming up, could be $20+ in a blink... GL to all.


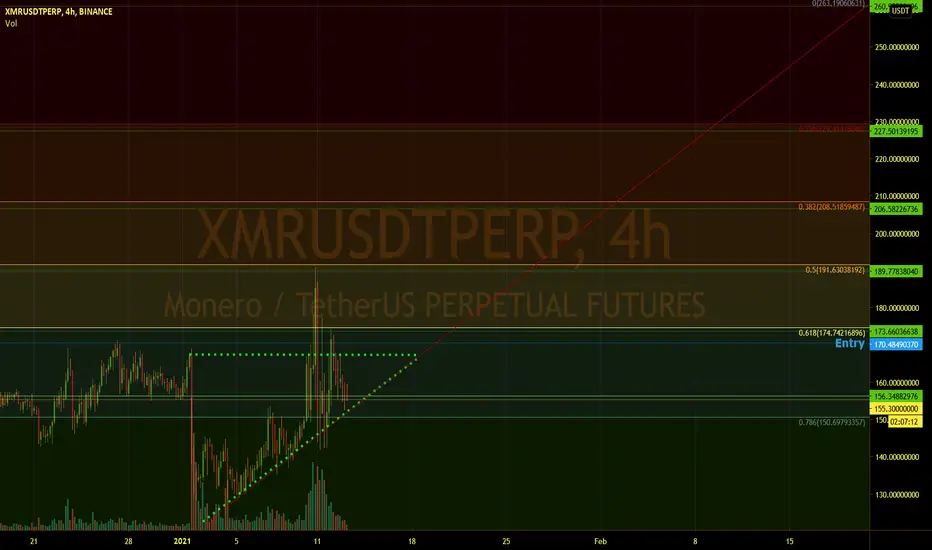
XMR/USDT 4 Hour Ascending triangleIn this idea we see XMR has reached the ascending triangle at the end of my parabolic fractal. It seems to have pumped out the triangle, found support on top, fell through to apex of triangle (probably due to bitcoin movement) and should now start heading to the upside if Bitcoin cooperates. Right now we are about to see Bitcoin go up and make what I believe will be a double top. This will give XMR a bit of room to run and even if these targets are not hit completely before the correction on Bitcoin we will see a return to these levels in the resulting altseason. If you agree throw me a like and follow me for more unique ideas and concepts that keep you in the gains.
Bullish Case For BTCUSDIt looks to me that higher prices are once again in our future. Just when all hope had been lost, BTC has regained its footing. We have reclaimed our strong uptrend active since Dec-16-2020, that briefly turned to resistance this week. The giant H&S everyone has been talking about is still technically active, but in my experience, patterns that all participants can see plainly often fail.
Anyway, there is clearly massive buy side pressure. Every dip is quickly bought. Hence I feel a break to new ATH's is imminent. Failing that, the previous uptrend active since March-2020 will be what I am looking at, putting us at around $28,000.


Bitcoin correction to parabola like in years past. The longer it takes to correct, the higher the bottom price will be. If the correction occurred this month, the bottom could be around $16k. If the correction occurred in February, the bottom could be around $18k-$21k. If the correction occurred in March, the bottom could be around $21k-$26k. This is assuming Bitcoin respects the parabola like it has in past Bitcoin runs. If it went below the parabola to challenge the bottom trend line, don't expect a $100k Bitcoin this year as Bitcoin has historically followed the parabolic bull run line to peak at the top trend line in years past and would ultimately require a lot of investor confidence to climb back to new all time highs, imo. If it went below the bottom trend line, expect extreme panic and sell off.. but this won't happen though ;)
Keep in mind I am not taking in to account institutional buying this bull run, strictly going off of what the chart implies. Best case scenario Bitcoin doesn't correct and we just go ham to the moon but this is unlikely.

Bitcoin Parabolic Hypertrend v2Eine Analyse des Hypertrends von Bitcoin, welches alle 4 Jahre durch das Halving hervorgeruft wird.

BTC H&S Setup4 hour Head and Shoulders pattern starting to form. Bitcoin is still in a bullish trend. Waiting to see if price can close and below previous higher low to complete pattern and move to the downside.
If price manages to close above strong support at 34.5k, we could be looking for ATH's.

BTC is dog piling too quicklyBITSTAMP:BTCUSD Has moved parabolically from 20k to 40k in less than a month. This type of growth has been maintained with uncertainty in the United States over the dollar and montary policy and a strong Alpha for institutions. However, Bitcoin has entered a greedy euphoric stage of the market where participants are continuing to pour money into it pushing prices to extreme highs. It would be healthy for Bitcoin to come possibly consolidate between 38k-41k and prehaps retrace down to 29k when this huge run started only 5 days ago. With a high demand and limited supply, inflated prices make sense, but to what extent? Will buyers continue to look for limit sells sitting at 41k-45k-48k and higher? Or will profit taking finally take place at 40k?

$NIO looking for a parabolic move here.$NIO looking for a parabolic move here. $NIO already established support above the 50 Simple Moving Average. With the news that came out over the weekend this might create a parabolic move to the upside.
Short Term Target Area: 64
Short Term Target Area 2: 75


