Bitcoin - Breakout to 36kBitcoin is currently going parabolic. My next price target is 36k. It could go further, but I think 36k will be the top.
Parabolic moves are typically followed by an 80 percent correction (roughly). If Bitcoin pulls back 80 percent from bottom (10k) to top (36k), that would mean Bitcoin corrects to 15k. This is a rough estimate. It may not correct that far.
Thanks
Parabolic

EDUCATION: Parabolic Growth PatternHello, dear subscribers!
Today's topic is parabolic growth pattern (PGP). This pattern can be applied for the current BTC price analysis.
What is the parabolic growth pattern?
This is a price growth pattern which is formed by the sequence of the bases and price pumps. The base is the price consolidation period after the price growth period.
How to draw it?
The main rule for PGP formation is that the parabola have to touch at least two points from the different bases. You can use arc to apply it on the chart.
How to analyze with PGP?
You can obtain some useful information for the price movement analysis when two bases have already formed and the third base formation is in progress. The main feature of PGP is that when the base 3 is completed the massive growth with a high probability there will be. This growth can be equal to the price change from the beginning of the formation of the parabola, but this growth is much more rapid.
After the last huge price move we should wait the pullback to the base 3 level. This pullback can be sharp or smooth but it is inevitable.

Binance Coin (BNB) - About to go Parabolic?Hello guys, my third analysis here, and I expect really good profits from BNB! My theory is that by seeing BTC correcting a little bit, alt seasons are just starting, and people will be wanting to hold good coins, and BNB is one of them due to this utility. As you can see on the chart, a Cup & Handle is just about to be formed, which means that when it reaches the upper line, it will go parabolic!
So keep your eyes close and don't miss this chance!

NOIA/USDT - Parabolic AdvanceGo check out my first post on NOIA if you haven't already.
Noia looks really strong. Even against BTC.
Its on its second leg of a parabolic advance.

Graph again,okay, if the parabola holds then it's buy for me !
*the parabolas were drawn on the line graph.
comment what do you think,
and Merry Christmas !

LTCUSD Litecoin about to TAKE OFF!!Looking at the monthly chart, we can clearly see the two strong bottom formations creating higher lows. This is a monthly chart and has been in a downtrend since 2017. A close above the $130 level by 2021 would indicate a beautiful pattern that should take us up to test the all time highs. Volume is already picking up in the last 2 months as you can see illustrated. This is not a pump and dump play, so don't expect instant rewards. This is one to sit back and relax and ride it up. Good luck!!!!!!

NEO/USDT 4 HOUR CHART PARABOLIC MOVEMENT INCOMINGNeo is throwing the same fractal that Btc did prior to going parabolic. If you agree throw me a like and follow me for more unique concepts and ideas that keep you in the gains.

BITCOIN: What's driving it? Is 30,000 in sight?In this video I show my theory on what's probably happening with BTCUSD.
It appears that Bitcoin is being used to hedge against the US Dollar crashing.
$22,000 is certain in sight and who knows it could get to $30,000 sooner than anyone might imagine.
I still think that BTC is too volatile for my liking and therefore I've stayed out. I've been happy to avoid FOMO. I've lost nothing.
I think that many will profit from a possible further charge north. But there is also still a risk that it BTC could reverse significantly.
Best wishes for the Christmas period 🎅and have a Happy Prosperous New Year. 🥂🎁

btcusd parabolic grow ends at 24000 will another big 80% crushLike the previous parabolic grows, this one will also end soon at about 25000 USD pet BTC with another 80 % Crush with bottom at 5000 USD

Short ACN (Accenture). Violation of Parabolic Advance I'm expecting a 70% decline from highs at least


PLTR – is the party over?? whats next ?From 10$ to 33.49$ in 22 days - why ? I think its called … FOMO!
Company has big contracts with the Gov and feds, ok we know but those contracts are NOT new .. and earnings are about 9 cents a share .. 9 cents a share.
Ok lets cover company basics first to make sure we understand what all the noise is about
Palantir is a data analytics platform with one major distinction from the rest – it includes everything meaning the software is front end, back end, data base and server. It has 2 main products :
Gotham : used mainly by the government in the intelligence sector and its main purpose is to identify patterns in the data and serve it to the end user.
Foundry : Central operating system for integration of data from several platforms to one main one, and enables the end user to reach a much faster analytics point. It is used mainly in the commercial sector.
The company currently has 131 customers which are about 50% growth in one year which is impressive. The business model is to acquire new clients based on “free trail” period which is costing the company loses and slowing their growth, but once the client is in -Palantir software takes over the whole process and keeps expanding with apps, software and other add on that increase the profit margin -but this is a very slow and long process, unlike Splunk or other data and analytics software.
So back to my point - is the stock worth 30+$ ? NO its not even worth 25$, we are just seeing a severe case of market FOMO (prob has to do with the 20 mil new robin hood traders joining in 2020 – welcome guys😊), so we must stay alert because we just had the second corrective wave to 21 (62% drop from H/H), and I presume the stock will rally once more and this will all tumble down like a house of cards – stocks are valued by profits, EPS, expansion, innovation or being a company that is one step ahead and until I get a clear sign of one of those + growth from PLTR I will take the profits we made on it so far and wait for the storm to pass
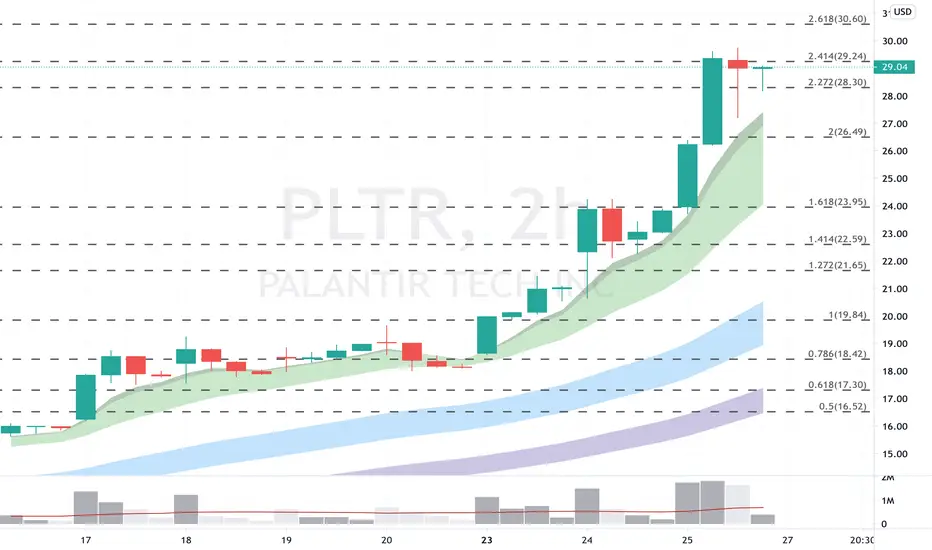
Technical:
208% rise in 22 days of trading ,highest high is about 33.5$ and lowest point of the correction is 21$, the blue square(below graph) is showing us that we are between the 618 to 50 line in a bit of renewed convergence.
stock finished its 4th wave -the correction wave and we are going into the fifth wave and the final one - after that we will have some brutal correction days ahead, its important to note I put the 5th wave lower than the 3rd one which is not reasonable but because the 3rd wave was so massive I have hard time to believe the 5th wave will cross the 33$ in the upcoming month or two.
THE BOTTOM LINE : after saying some negatives on the company the technical show us a preparation for a second rally (fifth stage of the impulse wave) that will probably reach the 30 line but this time it will be a bit healthier as the stock retraced and rested. After that we will have a lot of retracement – volatility at its finest – BE CAREFULL!
Happy Xmas and trade safe!
Closer look (1H chart):

Support levels for PLTRYou can be bullish and still see that this run needs a correction. Some trend-based fib extensions acting as support below.
Bitcoin Thanksgiving Sell OffWe are seeing just consistent sell volume on BTC today, as the market as a whole sells off a bit. Shaking out the weak hands near ATH is frankly not unreasonable to expect. How low the price goes is anyone's guess. I have been hitting some very small buys on its way back in the $16k range. Next chart will display long term weekly MA support levels, and following that pivot levels.

XRP Potential $1.15 Target In The Next 2 DaysXRP Has been growing immenslly since a few days. Luckily for us, XRP is following a clear pattern.
The pattern appears to take around 2.5 days to complete, resulting in a ~65% increase in USDT value.
Whether we will see the pattern unfold a third time will be clear in less than a day. If XRP manages to break out of the upper wedge, I expect the price to reach $1.00 at the very minimum, with potential upside towards $1.15.
Consider $1 as a major resistance. A lot of bullish pressure needs to build up in order to break this resistance. If the price manages to close above $1 on a daily candle, expect the price to rise even further, potentially with the All-Time-High as its new target.

$21,000 - BITCOIN BY NOVEMBER 30THHey traders, in this chart we took a short term parabolic view on Bitcoin , i tried to make the chart self-explanatory and detailed. However if you still have some questions do leave a comment below and if you find it helpful hit a thumbs-up 👍🏻.
Also share your idea below and let me know how you think the market would react.
I'd like to give some credits to @trading-guru picked up the short term insights from his ideas.

Ethereum will go parabolic agaist BitcoinETh will broke the fib gold pocket and it is apparantly will do a parabolic move

Ethereum's Massive Bull Run Has Just StartedEthereum is rising very rapidly in the last few weeks. Whereas the rising was more gradual at the start, it's starting to show signs of parabolic behaviour since a few days. This parabolic move blasted the price through the upward sloping channel, signaling more bullish movement to come.
Since there aren't any big resistances in the vicinity, the price has a lot more room to grow. Resistance 1 and Resistance 2 are the first major areas of big selling pressure, therefore it would be wise to reduce your long position around there. If both resistances were to be beaten, nothing will stop Ethereum from reaching the $1000 mark or even targeting a new All-Time-High.

CUP and HANDLE?Hey guys,
Technical Analysis is a thing which represents the past and allows predictions for the future.
Since Cryptocurrencies are a phenomenon and instituionals have not entered the market yet, it has hard to adapt such indicators and fractals into bitcoin.
Even in classic markets like the stocks market, bonds & derivates, Technical Analysis is something which works, because people believe in it. And since everybody believes it, it works out for everyone!
Nevertheless, we can try it out in crypto as well! :-)
The Cup and Handle formation:
As a stock forming this pattern tests old highs, it is likely to incur selling pressure from investors who previously bought at those levels; selling pressure is likely to make price consolidate with a tendency toward a downtrend trend for a period of four days to four weeks, before advancing higher. A cup and handle is considered a bullish continuation pattern and is used to identify buying opportunities.
It is worth considering the following when detecting cup and handle patterns:
Length - Generally, cups with longer and more "U" shaped bottoms provide a stronger signal. Avoid cups with a sharp "V" bottoms. (IS GIVEN)
Depth - Ideally, the cup should not be overly deep. Avoid handles that are overly deep also, as handles should form in the top half of the cup pattern. (IS GIVEN)
Volume - Volume should decrease as prices decline and remain lower than average in the base of the bowl; it should then increase when the stock begins to make its move higher, back up to test the previous high. (IS GIVEN)
As you can see, this formation works! But careful, it does not mean it works out, because only some lines match with the idea od a Cup and Handle!
I Hope you enjoyed this idea, let me know if you think this is actually good or absolutely garbage,
your quality-trader

BTC/USD- $30,000 (Dec-Jan) - $100,000 (Sep-Dec 2021)Hey traders, in this chart we highlighted the halving effect observing the the time to major ATHs after the halving event.
After first halving on chart we could see it took bitcoin about 500 Days to reach an all time high of about $1000.
After second halving same thing repeated we had another 500> days to hit an ATH of $20,000
Currently we sitting on the third halving and just est. 200days after last halving event, inasmuch as i believe
we will surpass previous ATH of $20,000 before year end and a possible hit of $30,000 by January 2021
My expectations for a new ATH will be by next Autumn/Winter come September to December 2021.
Do share your thoughts and let me know what you think.

DOGE/USDT Massive Parabolic Break-OutToday, DOGE has finally broken through the upward channel that it has been following for a few weeks. Not only did it break through, but it did so with a very strong few candles, accompanied with high volume.
In the snapshot below you can see that the upper trend line was decimated, signaling a strong bullish move in the coming days.
I expect Dogecoin to behave like it did in the past: strong bullish daily candle to start the parabolic movement, followed by even greater bullish daily candles. A move like this can keep going anywhere between two to five days. Consider taking some profits at either Resistance 1 or Resistance 2, since selling pressure is prone to be strong there. Tread very cautious when the price reaches above Resistance 2, it might reverse very strongly within the blink of an eye.

Text-Book Quality Parabolic Rise on BTC/USD! - By Trading-GuruThis fantastic parabolic ascending on BTC/USD is simply of text-book quality. In this analysis I will walk you through the narrative of how this parabola was formed. I will show to you in retrospect the things we can learn from the price behavior at that time, so that we can take lessons from it and recognize such a pattern more quickly in the future.
Furthermore, I show the bullish scenario of what will happen when this parabola holds. You can see that the price will increase exponentially, giving us a $19,000 prospect still within November of this year.
Lastly, I want to highlight what can happen if the parabola breaks. I did some research into other historical parabolas along with the text-book explanation of what will happen in those cases. And the results aren't pretty, if it does break the price can go down very very rapidly. As exponential as it has increased. So tread carefully everyone.
Here is the order of touchpoints on this parabola that with every step gave us slightly more evidence about the incoming increase in price:
The first of the touchpoints on this parabola were from the 5th of September. We see that the price has hit a temporary low near the $10,000 mark after a big hit in the price coming from $12,000
The second touchpoint happened on October 8th. We can already see here that every time the price dips the bottom is a bit higher than it used to be. For the first time, you can start to see a bullish trend.
From the 19th of October it becomes more evident that the price is rising, the touchpoint here was enough to let the price jump into the air. BTC is officially taking off, in just two days the price increased by 10%!
Early November we see multiple interesting touchpoints. The price is still bullish but struggling. It reached around $14,000 three times in a row and it got rejected on every attempt. Then, when it hit the parabola the price jumped up again!
And finally, the incoming last touchpoint in a few days. If the parabola holds we can expect the price to struggle around the $16,000 level for another 1.5 days. Then if it touches the parabola and it holds, we can expect the next jump in price.
By end November this parabola predicts a price of over $19,000 for BTC! Bringing it close to the resistance of the all-time-high. If you're going in with a long position I suggest to take profit below the ATH as it is very unpredictable what will happen near that level
Follow me for consistent high quality updates, with clear explanations and charts.
Please like this post to support me.
- Trading Guru
--------------------------------------------------------------
Disclaimer!
This post does not provide financial advice. It is for educational purposes only!
