XRP = Inverted Bart PatternXRP going to 77c ... very fast
weekly and monthly time frames still fuel left in the tank!
Expect some sort of correction to 40c before that !
Parabolic

$O.X Childhoods End entry PTs 0.0000166364-ish Next Target PT .0$O.X Childhoods End ✨ 🌹
what does your heart tells you
$O.X Childhoods End ✨ is the center and mixes and matches the best of all worlds 💫
O Price Today
Childhoods End price today is $0.000027098549 with a 24-hour trading volume of $233,887. O price is down -10.7% in the last 24 hours. It has a circulating supply of 0 O coins and a total supply of 369 Billion. If you are looking to buy or sell Childhoods End, Uniswap (v2) is currently the most active exchange.
What was the highest price for Childhoods End?
Childhoods End hit an all time high of $0.001734160188 on Sep 15, 2022 (6 days).
What was the lowest price for Childhoods End?
Childhoods End had an all time low of $0.000006160960 on May 27, 2022 (4 months).
What was the 24 hour trading volume of Childhoods End?
The 24 hour trading volume of Childhoods End is $233,887.
Where can Childhoods End be traded?
You can trade Childhoods End on Uniswap (v2). Popular trading pairs for Childhoods End in the market includes O/USD, O/CAD, O/AUD, O/GBP, O/INR, and O/PHP.
Freedom and Stability

BTC steady climb to a 300k+ parabolic take off in November Patterns repeat, patterns from previous cycles repeat, fractals repeat, hive psychology repeats, fear and greed repeat, trading instruments repeat, economics repeat, world events repeat, fake FUD repeats.. Find the puzzle pieces and separate the signal from the noise. Headed to 75k then likely a 20% drop to 60k region between 7th-14th before a parabolic shot to vastly new territory. These are my opinions, do your own research.

ENSUSDT 💎GEM💎 Parabolic Potential !Hi Traders, Investors and Speculators 📈📉
Ev here. Been trading crypto since 2017 and later got into stocks. I have 3 board exams on financial markets and studied economics from a top tier university for a year. Daytime job - Math Teacher. 👩🏫
In today's analysis, another undervalued crypto with great potential that is currently trading in consolidation and looking ready for a breakout - ENSUSDT.
ENS is a Blockchain domain naming protocol built specifically for the Ethereum Blockchain. Using it allows customers to create human-friendly and readable usernames for their Ethereum-based crypto wallet, and decentralized websites and apps. A first of its kind and simply put, ENS is a decentralized, open-source and permissible naming system running on Ethereum smart contracts. This is another gem in the rough that I believe may have parabolic potential during the next bull cycle.
It is my belief that this time of the season / cycle is the best time to accumulate and look for new opportunities in the market. If you're interested in the TOP altcoins I'm watching, check out this idea 👀
Have a great weekend 🥂
_________________
📢Follow us here on TradingView for daily updates and trade ideas on crypto , stocks and commodities 💎Hit like & Follow
We thank you for your support !
CryptoCheck

LRCUSDT Loopring - CRAZY?? +1000% Potential*Hi Traders, Investors and Speculators 📉📈
Ev here. Been trading crypto since 2017 and later got into stocks. I have 3 board exams on financial markets and studied economics from a top tier university for a year. Daytime job - Math Teacher. 👩🏫
Another altcoin that I am bullish on for the near future, is Loopring LRCUSDT. This microcap is trading at 1000% under it's ATH, and considering the fact that we are evidently trading in the accumulation phase, between now and perhaps a little lower would make for some great distributed entry points.
Want to know a little more on how to do distributed entry's / dollar-cost-average? See HERE:
*Before you leave a comment, please make sure to watch the video all the way to the end, as there are some "t's and c's" mentioned about the upside potential.
I hope you enjoyed this post today! Please give us a thumbs up 👌
_________________
👀 Follow us here on TradingView for daily updates and trade ideas on crypto , stocks and commodities 💎
👍Hit like & Follow 🔔
We thank you for your support !
CryptoCheck

These 3 Microcaps are RALLYING Now 🚀 Hi Traders, Investors and Speculators 📉📈
Ev here. Been trading crypto since 2017 and later got into stocks. I have 3 board exams on financial markets and studied economics from a top tier university for a year. Daytime job - Math Teacher. 👩🏫
Here's a look at 3 altcoins that are surprisingly bullish while the rest of the market is trading bearish - WNXMUSDT , OPUSDT , BONDUSDT . Note that these are all fairly new coins and microcap coins, therefore your risk significantly increases when you participate in trading these coins. However, it is also true that diversity significantly decreases your risk. So take a look at these 3 microcap altcoins that are busy making gains whilst the rest of the markets are trading lower.
I hope you enjoyed this post today! Please give us a thumbs up 👌
_________________
👀 Follow us here on TradingView for daily updates and trade ideas on crypto , stocks and commodities 💎
👍Hit like & Follow 🔔
We thank you for your support !
CryptoCheck

XRPUSDT - Parabolic FRACTAL shows +700%Hi Traders, Investors and Speculators 📉📈
Ev here. Been trading crypto since 2017 and later got into stocks. I have 3 board exams on financial markets and studied economics from a top tier university for a year. Daytime job - Math Teacher. 👩🏫
XRP is an underrated altcoin with massive upside potential. It's one of very few long-existing coins trading far underneath ATH. Fundamentally, it's also one of the altcoins with the highest selling points to make for a strong argument in investing. I've identified a macro parabolic fractal on XRPUSDT that shows great potential of +700% if we go back to the 0 Fibonacci Retracement level, currently also the next major support zone at 28c. Watch this quick 5min video to find out how we get to 700%.
Want to know a little more about buying at the bottom? Watch this quick educational idea on Ethereum and the Dollar-Cost-Average method:
Into Bitcoin? Here's my ultimate speculation to $100K:
_________________
👀 Follow us here on TradingView for daily updates and trade ideas on crypto , stocks and commodities 💎
👍Hit like & Follow 🔔
We thank you for your support !
CryptoCheck

AERC has started to build momentum towards the end of the day!AERC has been building momentum towards the end of the day which has it poised for a pullback rally in the following few days just before the weekend!
It has freshly broken the SAR on the Daily Chart with strong upside volume.
I'm looking for continuation to the $17.77 marker in the next couple days.

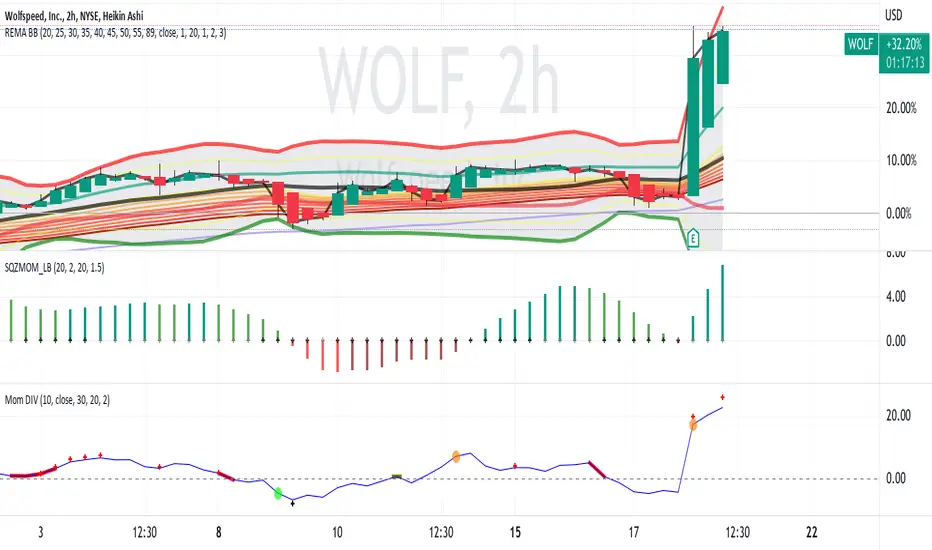
WOLF rises on earnings Is it ready to fall SEMICONDUCTOR STOCKNYSE:WOLF
The chart and indicators show the dramatic rise after earnings.
The squeeze indicator is rising while the momentum divergence is
increasing.
What do you think- will WOLF continue on the uptrend or reverse?
MMAT Goes Parabolic?It looks like MMAT is forming a parabolic curve. Wouldn't it be fun if MMAT ran back to $2 as quickly as it dropped? Wouldn't it be more fun if it formed a cup and handle after rejecting off of $2, then ran to some ungodly number?
Answer: Yes.

3 ALTS to Watch in Q4 👀Hi Traders, Investors and Speculators📈📉
Ev here. Been trading crypto since 2017 and later got into stocks. I have 3 board exams on financial markets and studied economics from a top tier university for a year.
In this 5min video, I discuss 3 altcoins that have good upside potential and good risk-reward ratios. I highlight my first (modest) target for each that I'm expecting as the first stop during the next mark-up cycle.
As Images:
BATUSDT , Basic Attention Token
CRVUSDT
And lastly, XRPUSDT / XRPUSD
If you're curious about Cardano , take a look here:
__________________________
👀Follow us here on TradingView for daily updates and trade ideas on crypto , stocks and commodities 📉
Hit like & Follow 🔔
We thank you for your support !
CryptoCheck

UBX ( NASDAQ BIOTECH PENNY) crushes earnings and news catalystNASDAQ:UBX
and rises over 100 % in premarket, Has a new product
for macular degeneration, a widespread medical problem
affecting vision in the elderly which is increasing
in incidence. The earning beat was significant.
Chart demonstrates the uptrend and midrange
RSI but does not show today's premarket.
40 % rise in the week leading up to earnings and now parabolic.
doubling overnight.
* Get in the party now, don't be late. If you are
late stay home"
( not a recommendation to buy only education)

BTC/USDTBTC starting parabolic movements, how to enter this point? at the breaking of a flag! wait for breakout and confirm with volume or candle close
IT IS NOT FINANCIAL ADVICE!

parabolic banana monkey the monkey sees bitcoin dropping to 16000, then rich saudis will call Bryan Armstrong on their gold lated sat phones and buy all the bitcoin

BNT Parabolic inverse BART moving SOONJust take a look for yoru self. ATH on this $10 its now just $0.60 cents. Its broken the down trend and the 50d moving address is now below the price. Its about to swoop back underneath and push this up. When this moves it'll move so fast market orders will be all that works. Best to get in now before it rises instead chasing the pump. Buy some a sit on it.

MC/USDT... Must Be in your Watchlist..!* Set your alarm for the breakout of the downtrend. (once it breakout, it's game time..!)
* Volume looking amazing imo. Supply looks like being absorbed.
*MCBTC pair shows more demand in a TR. (do your analysis)
Must keep an eye on this one. Once it break,.... we will see.
DYOR with SL and Targets
note: am just sharing ideas that i think has potential and am keeping an eye on.
Let's see how this plays out,,, BINANCE:MCUSDT

BNT Huge H&S breakout potential on 1D. Low float, ATH $9.70A great oppertunity on a forgotten coin. this coin has made me some good money in the past. It's primed for another run. It just broke the long downtrend, and it has an immeditly reversal incomoing and when it does, it pumps FAST. Dont play catchup, grab coins while its still low. H&S also appears on the weekly!

EGLD Parabolic Move Coming Soon.... EGLD parabolic move coming soon.... Check this out, its repeating its old behavior right before the big breakout. Anything can happen.

$QOM Shiba Predator $CAW A Hunters Dream $O Childhoods End✨$QOM.X Shiba Predator $CAW.X A Hunters Dream $O.X Childhoods End
QOM is the Shiba Predator, it is a community token whose function is to flip the Shiba Market cap.
^ 0.000000037086
A Hunters Dream is a decentralized financial payment network that rebuilds the traditional payment stack on the blockchain. It utilizes a basket of fiat-pegged stablecoins, algorithmically stabilized by its reserve currency CAW, to facilitate programmable payments and open financial infrastructure development.
^ 0.000000058909
Freedom and Stability
^ 0.00001363

CSCW 200%+ from hereIts time for CSCW To make or break stay tuned
Very high risk high reward ticker
Entry at 0.12$
Stop at 0.1
Trade safe

2 Halving CycleIN past each bitcoin parabolic cycle has 1 halving
this time bitcoin cycle has 2 hlaving
If blue curve line break then long Bear cycle occur...BTC will likely go to $10000 or below...

VITE about to Cross the 100day SMA on the Daily chartBIG move is coming very soon. This move fast as theres not many coins. Only 509m in circulation. This can easily reach $0.06 and double your money with its low float. All the other coins with 500m or less coins are at least worth $0.20 this is worth the hold as it will print as $$ if you get in now while its really early. Also as a tip try not to put all your money in one coin, stay diversified.

VITE low float 509m will go parabolic now that BTC is running. VITE low float 509m will go parabolic now that BTC is running. It broke its ribben channel on the D and was 0.32c in the recent past. Only $0.03 now. Double your money in no time.
