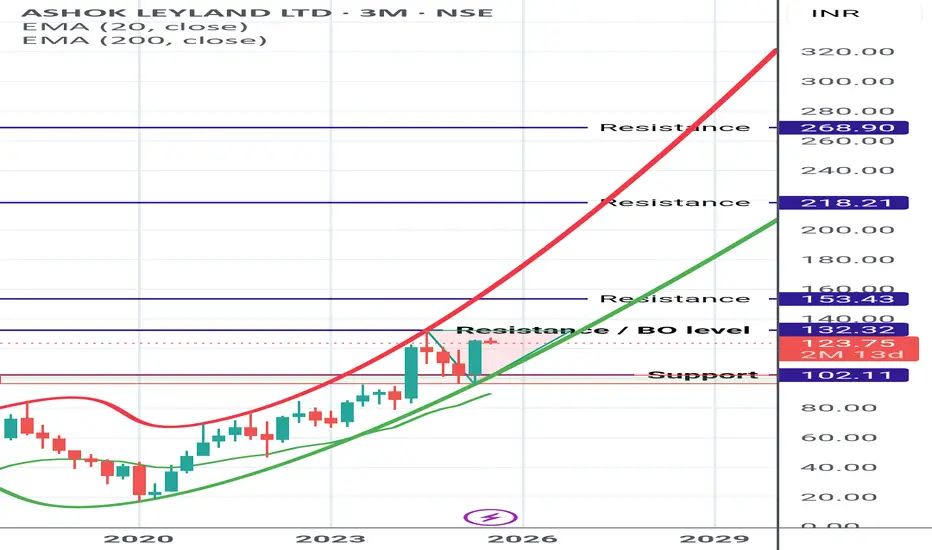
Ashok Ley land updated view Ashok ley land chart updated after price adjustment of bonus.
Currently trading in Parabolic uptrend pattern and inside Triangular zone.
On closing above the triangular marked zone (Breakout level) rest of the marked Resistance can be expected
Paraboliccurve
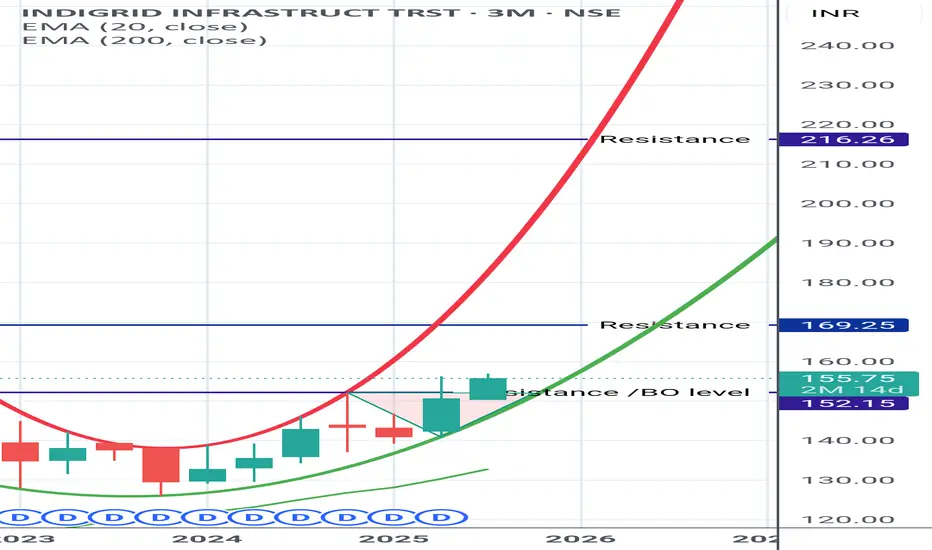
INDIGRID (REIT) INDIGRID - (REIT)
Dividend and Growth (Almost like investing in a BOND)
*At Present they are giving Rs. 4/- as dividend every quarter.*(here it is called as Distribution)
Slow and steady moving stock.
Can have a Small portion.
Technical view is *BULLISH*
Shared it for Reference purpose based on chart pattern and My STUDY.
Do Your analysis from your side before taking the ENTRY.
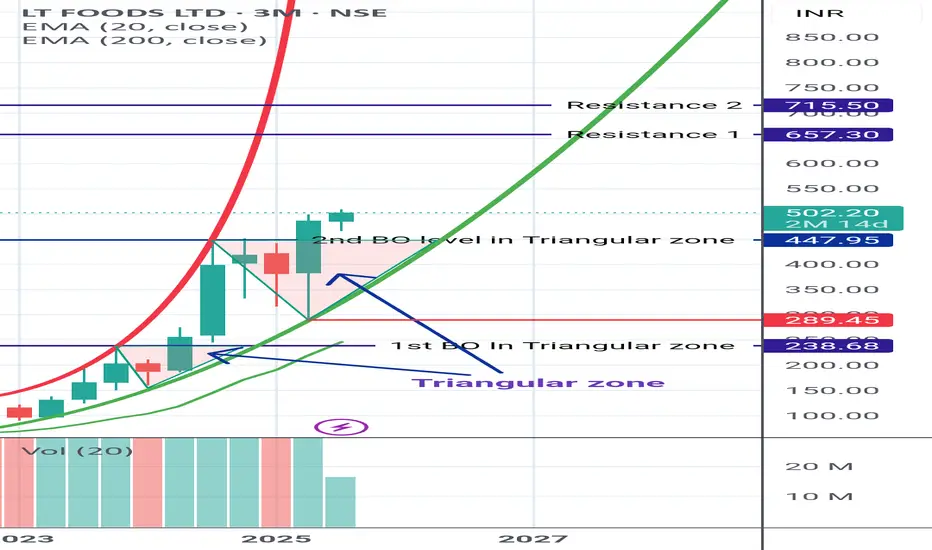
LT FOODS LT FOODS
Moving in Parabolic uptrend pattern & given Triangular zone BO Second time. Making the rally strong.
Shared it for Reference purpose based on chart pattern and My STUDY 🙏
Bitcoin parabolic curve Zoom Out CRYPTOCAP:BTC
“Don’t sell your Bitcoin”
Bitcoin parabolic curve is in mega run phase

#Ethereum PARABOLIC CURVE STEP-LIKE FORMATION!#Ethereum PARABOLIC CURVE STEP-LIKE FORMATION!
At the end-point of Base 3, indicated by the "X" symbol, the stock could double in the shortest period of time!

Insane volatility imminent conspiracyI've seen one other TA notice this parabolic base forming (pink area) which I believe we'll be exiting over the next few years. Maybe it will happen this bull cycle. However, I think it's also possible that this bull cycle will be somewhat lackluster, not exceeding $150k, before correcting down to the 80's with wild volatility. I think this will shake out A LOT of investors and now that we have the likes of Black Rock et al in the mix, it's my theory that they don't want us in at the bottoms they want us in as their exit liquidity. When BTC does exit this formation and is supported above it very briefly, we're going to see the proverbial 'god' candle with absolute vertical movement. This will likely be nation states and corporations finally having the eureka moment. And it will occur during the 'usual' bear market.
As the title states, this is a conspiracy but it seems like a very plausible scenario. Of course there's fundamental theory laced in with TA which I shouldn't do here but we're living in wild times. Am I stupid? Let me know!

Christmas rally?: 90% up EGLD could very well be doing a parabolic curve in the 4h range. This is another way of seeing it, within an ascending channel, with the corresponding FIB extensions drawed from the lows of October.
This could be a FOMO, or could be not. We could also have some bumps in the way, but Santa is around the corner, I can feel it!
Target: 119$ (+90%)

BTC_USDT(Parabolic Curve Pattern)The parabolic curve chart pattern is one of the strongest uptrend patterns a price can have. This type of pattern goes up the farthest and the fastest as it is under the strongest accumulation and every small pullback is bought by eager traders and investor.The parabolic curve is named after the parabola, because the ascending curving trend line used to identify the strength of this pattern from the price support action looks like a parabola. This strong price pattern can give a trend trader incredibly high returns in a very short time period.
Many times you will see price going up like this near the beginning or end of a bull market advance. This pattern creates short term price range bases before breaking out to new highs and repeating this range pattern multiple times as it keeps going higher.

BTCUSD - Max pain outcomeBTCUSD - Max pain outcome
BTCUSD - Max pain outcome
BTCUSD - Max pain outcome
BTCUSD - Max pain outcome

Intel - Parabolic downtrend curve to end with a rebound1) Parabolic downtrend curves usually ends with a sharp rebound.
2) Price to book ratio (1.11) is at the lowest level of at least 12 years.
3) Gap at 39
4) 39 is the long-term (since 2018) horizental support/resistance level.
Price target = 39

Parabolic Arc Pattern in APE , possible retracement !!!Parabolic arc chart patterns form when there is a steep rise in prices caused by irrational buying and intense speculation. Parabolic arc patterns are rare, but they are reliable and are generated in mega-bull trends.
These patterns trend gradually making higher highs and lower lows in the beginning stages but can be volatile in the exhaustion and reversal stages. Irrational buying in the public generates a strong rally to push prices vertically, followed by a steep sell-off.
Parabolic arc is a reversal pattern and has a very predictable outcome. Although these patterns are predictable, they are relatively difficult to trade since the market sentiment is bullish and may be fairly tough to point reversals to trade. Most parabolic arc patterns have a significant correction of 62-79% of its price rise (from the top).
Once parabolic arc patterns reach their target of 62-79%, they tend to reverse as an oversold bounce. Usually these bounces are between 25-50% of its prior fall range from the peak.
In this APE 1hr Chart, I can see a 2 possible based of parabolic chart but both may give you a retracement in between 50%-80% which is 16-19$. We have an ORDERBLOCK as well in 17.2$ which possible price will comeback there as per Smart Money Concept trading.
Get additional confirmation in other indicator or signal for your own trade. Use this chart only as a guide.
For more info of my strategy , I have free tutorials and just visit my YT channel below.

Parabolic PauseThese are runs for Mastercard and Microsoft
Both of them are massive parabolas
During times of intense bull markets, price has to pull back occasionally and this is what we get.
These pause are often sharp/rounded and quick down moves followed by a quick reversal
It is very surprising how far these parabolic structures can grow
Monthly and Weekly timeframe respectively

LTCUSDT 100% Potential in Short timeMoving on trendline and always take support on a parabolic curve.
BuyZones:
185 175 170 160 150 140 110 (This Price touch in July 2021 Lowest)
Take Profits:
290 325 375 400
StopLoss:
15%
Legend:
🔴 Pink Structure -> Monthly Structure.
🟣 Purple Structure -> Week Structure.
🔵 Blue structure -> Daily structure.
🟡 Yellow structure -> 4H structure.
⚪ Grey structure -> 1H structure.

CELR/USDT Parabolic CurveBINANCE:CELRUSDT
The parabolic curve chart pattern is one of the strongest uptrend patterns. This type of pattern goes up the farthest and the fastest as it is under the strongest accumulation and every small pullback is bought by eager traders and investors.

What Happens at the Top of a Parabolic MoveA comparison between Bank of America and BTC
Both experience similar price action (BTC is log, BAC is normal chart)
Yet you can see on both the action at the top of the bull move
A peak is attained and then quickly rejected from

Atom Parabolic wave ?Hello everyone ,
My eyes on Atom from a long while , In my recent idea I've mentioned about the falling wedge , bull flag and inverted head and shoulder but due to rising BTC dominance Target fail to reach but the good is that our stop loss doesn't hit , Moreover the trade active from my previous Idea is in profit .
According the current Scenario , Atom is going to break the consolidation zone and may follow the parabolic wave , it is forming bullish pattern and RSI is also above 50
I hope you agree with my Idea , Of not Comment down why and let me know!
And yes don't forget to like , That's give me confidence to publish more Ideas

Kucoin $IDEAUSDT Rounded Bottom ideaThis is basically a reminder-to-self of my Kucoin setups.
Idealogy's $IDEA coin is currently near bottom and sitting on a RB pattern primed for a potential 4.5x up, at least.
Movement should resemble Parabolic Curve Theory

Kucoin $CARRUSDT Rounded Bottom ideaThis is basically a reminder-to-self to keep track of my Kucoin setups...
Carnomaly's $CARR coin is sitting on a RB- pattern for a potential 5x move up.
Currently very close to bottom and waiting for additional volume to come in.
Movement should be similar to Parabolic Curve Theory

Kucoin $ICPUSDT Rounded Bottom ideaThis is basically a reminder-to-self to keep track of my Kucoin setups ever since I heavily transitioned to spot trading in Kucoin due to their higher volatility coins.
Internet Computer's $ICP coin is sitting on a 6x rounded bottom pattern, very likely to move according to Parabolic Curve Theory as it makes it's way up from it's bottomed price.
On the daily chart, selling volume is decreasing and BTC willing this might show strong signs to move up.


$AAgilent is a leader in life sciences, diagnostics and applied chemical markets. The company provides laboratories worldwide with instruments, services, consumables, applications and expertise, enabling customers to gain the insights they seek. Agilent's expertise and trusted collaboration give them the highest confidence in our solutions.
Agilent focuses its expertise on six key markets:
Food
Environmental and Forensics
Pharmaceutical
Diagnostics
Chemical and Energy
& Research
It’s no doubt, this company has seen incredible growth seeing over 200% since the COVID lows.
But in my honest opinion, the valuation is ridiculous.
Agilent Technologies is starting to look like a “Parabolic Curve Step-like Formation” on the monthly timeframe w/ the
RSI ridiculously oversold.
- 5.90 on the daily.
- 10.96 on the weekly.
- 90.00 0n the monthly.
MACD overstretched.
- 5.90 on the daily
- 10.96 on the weekly
- 20.98 on the monthly
I suggest keeping this on your watchlist.
- Factor Four

$CRV/USDT 4h (Binance Futures) Parabolic curve under resistanceCurve DAO has grown a lot after breaking out bullish, now approaching supply zone we expect some rejection up there.
Current Price= 2.303
Sell Entry = 2.349 - 2.435
Take Profit= 2.156 | 2.020 | 1.820
Stop Loss= 2.581
Risk/Reward= 1:1.25 | 1:1.97 | 1:2.7
Expected Profit= +19.74% | +31.1% | +47.82%
Possible Loss= -15.80%
Fib. Retracement= 0.236 | 0.382 | 0.618
Margin Leverage= 2x
Estimated Gain-time= 2 weeks

BearCorn to 14k and below Going into 2021, we have seen a parabolic rally with unstoppable momentum, from 4k all the way to 64k ,
without any noticeable, if any, price reduction or stops along the way.
if history has proven something, it is that for every action there is a reaction.
As shown on the chart the parabolic advance curve is broken "plus a retest/rejection to boot".
In the last 3 instances, followed a major correction as shown on the chart. with an average duration of a 1 year for the bear trend and minimal decline of more than 80% from ATH .
The purple channel is the current channel price is currently comfortably swimming inside, while the yellow channel represents the future channel i expect the price to move inside.
Why do i assume price will switch channels?
we only have the history for the answer, as represented by the brush and the arrow, The slope of advance has gotten weaker with each parabolic curve bypass.
Think of the brush as a channel, and the picture becomes clear
i left the purple channel shown, as it contains a bull trend line , where you can expect a bounce and a long setup
Notable Strong areas to expect a bounce from:
= 27k area "Fib golden zone of the whole wave 3"
= Purple channel upper trend
= 14k "The close of the monthly candle of the 2017 ATH"
