Parabolicmove

INFY Parabolic trendINFY has formed a parabolic upward trend with multiple bottom points, including a diamond bottom. Uptrend can be seen to be a strong trend with a regression analysis of .84. Looks overwhelmingly bullish.

BTC bottomed at 7300?What is Parabolic Move?
In purely mathematical terms, a parabolic move is an exponential rise. Parabolic Curve chart patterns are generated when steep rise in prices are caused by irrational buying and intense speculation. Parabolic curve patterns are rare but they are reliable and are generated in mega bull trends. These patterns trend gradually making higher highs and lower lows in the beginning stages but can be volatile in the exhaustion and reversal stages.
Irrational buying in the public generates a strong rally to push prices vertically, followed by a steep sell off. Examples of this market types are the NASDAQ bullish markets during 1990–2000 (retraced 80%) and Gold prices from 2000–2011 (retraced 62%).
Parabolic curve is a reversal pattern and has a very predictable outcome. Although they are predictable, they are relatively difficult to trade since the market sentiment is bullish and may be relatively tough to point reversals to trade. Most Parabolic curve patterns have a significant correction of 62–79% of its price rise (from the top).
The basic ideas behind Parabolic curve patterns:
— Pattern is easy to spot but difficult to trade with excessive volatility.
— Most Patterns retrace to 62–78% of its rise. 50% retracement is first target.
BTC moved from 3.337 to 13.868 = $10.530 with %315.49 increase
From $13.868 to $7296 = $6.572 with %48 (correction) retracement.
Are we done here or there is another %30 drop coming?

DAG/BTC Parabollic movesAs shown in the chart above, we are seeing DAG/BTC in a parabolic increase since July 15th of the current year. A parabolic increase is a great way to make money, yet a very risky play, if the signs of a possible break are disregarded.
We ask a series of questions to determine the technical status of DAG/BTC
Is this parabolic increase about to break?
No, right now, we se every little signs of weakness but therefore a lot of signs of strength.
For example, the volume shows us very clearly that during the whole move and even at these high levels buyers are still stepping in and sellers seem to be non-existent.
Looking at the TJ-Index, which is made out of 15 different indicators, we clearly see a very high number, indicating us confluence for the bullishness we see, since almost all of the built in indicators and conditions are still very bullish.
What is the best entry? Which levels can we expect?
Entering DAG/BTC at this point in time is most likely not the wisest decision an investor/trader could make. We are at what seems to be the end of a parabolic advance, which is mostly followed by a retrace to previous key-levels.
Here, we are especially looking at the key-area of 153971 and 145052.
This particular area was a key area of resistance for almost two full months. Nevertheless, it broke on the most recent push upwards, after hitting the parabolic curve once again.
Based on the fact that we are right now at a HTF resistance, in a strong yet overbought structure, which is slowly but surely locally loosing on strength, the only reasonable expectation we can have right now, is a retrace in the mentioned key-area.
A retrace into this particular area would also mean two things.
One would be a Support and Resistance flip, which is mostly a very bullish sign and asks for a trend continuation.
Second, a re-confirmation of the parabolic curve. We see in such parabolic increases very often a consistent re-confirmation of the main curve which acts as a trend line of sorts.
Even though, the most likely and desired option is a retrace, there is a worthwhile chance that DAG/BTC will just continue this most recent push through and above the local resistance level. In that case, we would be looking for a support and resistance flip at that particular level of 196000.
Conclusion
DAG/BTC is definitely a very bullish pair and is most likely to be one of the top performers for the upcoming months. Nevertheless, an unthought entry can bring an unwanted drawdown.
A full-size entry at the local levels is surely not suggested, since a retrace into the area of 153971 and 145052, looking at the history of DAG/BTC, is the most viable and reasonable scenario to occur.

$Beam/$USDT Inverse Parabolic with a potential V shape Recovery?Good morning ladies and gentlemen! Beam has had some serious downside action. And to some of you, that may be scary and I completely understand. But the golden curves are a representation of the flow in the price action. And what we saw was pure capitulation on Beam. It was the reverse parabolic moves we see in an uptrend on other assets that everyone gets all excited about.
This asset is best depicted on other exchanges as their isn't enough history on the trading view charts for me to showcase the Bullish Divergence that is forming right now. I mean come on, this is the area where "everyone" wants to get out. You are at an area of value on other exchanges which is why I highlighted the box on here with no historical support. "Believe me, it's there". Just not on this chart.
I would like to state that while capitulating, you started showing signs of exhaustion on the sellers as depicted by my smaller curved drawing tool. With comes triple MacD and RSI Bullish Divergence on the 4 hour time frame. I think their are overwhelming amounts of bullish indicators here and people will call me crazy as all the see on the charts is this asset continuing to dump. This is all probability of course, but I have taken a position on this asset at 50 cents on another exchange. Break below, don't panic until we start to see follow through price actions. Set your stops where you think is best, but also think about your risk/reward ratio.
With Parabolic or 'Inverse Parabolic" moves comes a V shape recovery or retrace. In this case, we may be in the makes of a potential V shaped recovery. These moves are typically fast and will end with massive gains if you had got in at the right time. I made my choice to get in due to the overwhelming bullish indicators that have been forming.
I am looking for my potential exit targets to be inside that plasma pink box between the .382 and .618 retrace. The .618 on the Log scale just so happened to coincide with critical resistance ;)
Twitter: twitter.com
If you want to be a loving supporter of me and my "ChArtworks"
$BTC: 35tmT7MAQXZm7rr1KzZMWNRpN2iyrnSB4z
$LTC: LVfCT9fu4dYyFAo5cW5xLrzHZHWFoG85hn
$ETH: 0x390d207b9bde62f2806caddfb94809de61da50d9
$x42: XZXm43FJcZHEVNs9dh8mdfzWyY6VfmJvPc
Donations are never required but they are seriously very appreciative! Your Supportive comments and follows are just good enough too :D <3
Join the best Crypto and Technical Analysis Community in the world!
Discord: discord.gg
(Mitch Ray's Channel) Amazing community and I highly recommend checking out Mitch Ray if you haven't yet!

20191015 XRPEUR 4 Stage of Parabolic Move at 4 hours completedHi there,
Price just reached 4 stage of a parabolic movement at 4hs Chart. Besides, it was stopped of a Chuvashov Fork Line comming from past and from 1D Chart.
Every Colored line is an indicator for parabolic movement. When one of the lines are broken, the one before serves as support line.
Probably would try to go back to supply zone before breakout and retest to continue uptrend.
Cheers.
Charter X

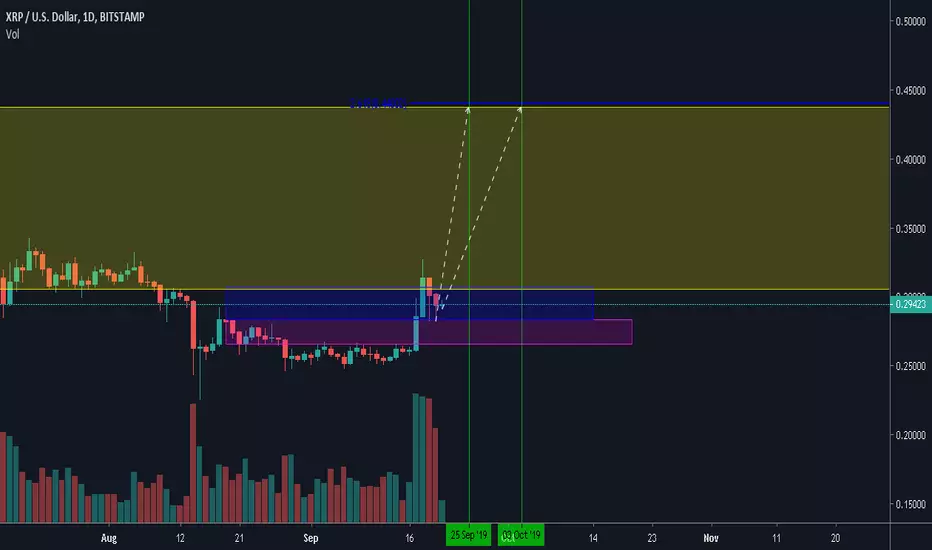
XRP Bottom is in - heading towards 0.44$ and beyondHey everybody. Xrp has bottomed out and I expect parabolic move from now on. Looking at smaller picture, I have 3 rectangles over here.
Yellow - Monthly supply zone.
Blue - Weekly.
Purple - Daily.
As you can see we had perfect retest of daily supply at 0.283 zone TWICE. This shows a strength in the market. After this retest we can easily pierce other levels and try to reach upper line of MS @0.44$. I also added dates, don't look at them too seriously, just trying to work on date pivots.
Keep in mind, that when XRP pops, it doesn't retest any supply's in the later stages of bull market. We are shifting from BEAR to BULL. Perfect situation for long term positioning and holding. We will reach new ATH sooner than most ppl think. 0.44 could be a short stop before things get crazy.
This idea is for educational purposes only!
Have a great weekend everybody.
FMX, Fomento Economico Mexicano SAB - Parabola SupportNYSE:FMX
Very particular this pattern in which the price has been bouncing perfectly for 6 and a half years on the parabolic support and is in the theoretical final phase before any breakout of the resistance that lasts a long time.
We set the alerts and wait.
Stay Tuned!
finance.yahoo.com

BTC/USD ichimoku CMEgo long bullcross tenkan-kijum
go short deathcross tenkan-kijum
join my free group for new content and free analysis
(NO SIGNAL GROUP)
t.me

Clear for launchLots of downtrends to break, which will provide the necessary confidence for a new bull-run


Awaiting for golden pocket REN/BTCREN had a huge move upwards and will keep on like that as soon as market makers fill their bags at:
- Golden Pocket (FIB 0.702)
- MA300 @ 4hr TF
- parabola's 4th touch
Not financial advice.
Good luck!

GBP/JPY Technical analysisThe counter is pricing in a hard brexit.
Hence, it is set to make an inverse parabolic move.
Traders can go short taking cue from the trendline we indicated in the chart.


BTC dominance is about to raise more, bad news for altcoinBTC dominance (BTC.D) runs in a parabolic curve since April 2019. After got over 32.8% and 50% Fib. retracement (considered as resistances) at around 58% and 65%, BTC.D is now heading to the 61.8% Fib. retracement (at around 72%), which is the strongest resistance.
I expect a strong correction of BTC.D when it reaches the 61.8% Fib., from now to then BTC.D will easy of moving straight toward that resistance. As mentioned in the previous post, when BTC dominance is quite high, there is not a good time for altcoin, then altcoins will suffer more selling pressure on the next days.
As BTC dominance is quite high, any big move of BTC in any directions will lead to a big dump of altcoins.


looks like the same thing is about to happen for the 3rd time! FOLLOW ME EVERYWHERE YOUTUBE @ CRYPTO GANG @ TWITTER @1CRYPTOGANG!!!

$BTC to $60k EOY with blowoff top similar to 2017?Hi everyone,
Seeing the powerful parabolic rise of this year, I decided to look at 2017 and try to extrapolate an idea. It's a wild idea, I get it, but it's nice to see for some perspective of how powerful this year's parabolic rise "could" be and how big of a crash we could expect if it does actually play out.
AB= April to Sept 2017
CD= Sept to Feb 2017
AB = CD in 2017 puts the target at $6.7k, which is the 78.6% fib retracement from ATH (blue line). That was Bitcoin's realistic target for EOY. However, Bitcoin being very parabolic in Q4 2017, it decides to go for a moon shot another 184% to the upside, prior to quickly going back down to consolidate upon its intended target of $6.7-6.8k (the 78.6% fib!)
Could the same AB = CD repeat for this year, given the similar powerful 2017ish parabolic rise we're seeing?
AB = Jan - June 2019
CD = June - Dec 2019
If so, we'll see Bitcoin reach just shy of $60,000 EOY, than plunge back down to the 78.6% fib at around $20.5k! This means that Bitcoin's previous ATH will actually become a strong support for the continued 2-3 year bull rally. We could also note that by that time, the NVT indicator will probably be flashing a big sell signal, justifying the 60-65% quick plunge from the $60k blowoff top.
Hope you enjoyed!
Cheers,
Leb Crypto

Bitcoin Loves Exponentials: Analysis on shorter time frameBitcoin loves the "parabolic" pattern, here is an analysis of one on a shorter time frame. This is likely to lead to insights on this much intermediate parabolic pattern.
Within this pattern, we can see accumulation occurring at the base, which can be identified by the trendline occurring in the RSI, this occurred in a very similar way to our exponential growth within march off the 2-3 month base. As the RSI continued to rise, the price was range bound. Once the second base was made, it was clear that the RSI had made a new trendline showing the increased structure of the rising demand within the smaller time frame on bitcoin.
On the third base, the price of bitcoin increased by 6-7 percent, this is important to note because, although we cannot double the price of the third base, if we turn into percentages the rise in price can be compared. From the third base, within the same amount of time to form the 2 initial bases, the price increases by 11-12 percent, which is nearly double that of the third base.
The price action hits a relative high of ~12850 and then it drops to the .6 fib. it then retests the price and falls once again.
Please note: this analysis does not assume that it will currently fall further as the longer time frames would need to take precedence for that to occur.
This analysis corresponds with:

ETHUSD just charming...Quick TA on ETHUSD
We see ETH price action testing the lower bounds of the upward channel
Looking like it is priming for a parabolic advance, so hold on to your seats all you bulls.
HOWEVER, watch out for a breakdown from the upward channel, with the lower bound at the 200-240 range. Bearish divergence on the RSI is forming, signalling bearish impulse and potential of a reversal.
- Watch for critical levels at 200-240
- Watch for retest of the 350 range
- Watch for sudden surge in volume
Happy trading y'all :)

Bitcoin is still in parabolic move, next target $16K if ...I appreciate your support by liking/sharing this post if you see value in it. Thanks,
A long time ago, I drew a Fib Circle for BTC Long - Short chart and I have kept tracking it. So, far it has played out very well and we are on track (still following those Fib Circles).
Right now the BTC long-short is heading down and this is a bullish sign as Long/short or long-short chart is known as a reverse indicator. That means, when the majority of people think we go down we will actually go up and vice versa! I know it sounds very crazy but it is a fact!
My guess is the Long-short chart keeps moving down towards the next Fib Circle and will bounce back up. Note that I am talking about the overall trend move and not a short-mid term trend.
In addition, after the short correction we had on June 27th, we are moving sideways so far (check out smaller time scales like 3-4 hr charts). If we keep moving sideways for the next 2-3 days, I will be VERY bullish and will buy in that dip too (I have already bought in around $11k). If that plays out and we break previous highs ($12,900-$13,000, the close price on June 26th. Note that this number is exactly the next pitchfork level, the light purple line) our next probable target will be around $16,000. This number is the 78.6% retracement level (green line) as well as the middle of next pitchfork channel (the dash line).
Also, take a look at the similarities between current move and previous moves in both price actions and Stochastic RSI (note that the current move is faster and shorter. As we get closer and closer to the top, the cycles are getting shorter and shorter in a parabolic move.)
Good Luck.
