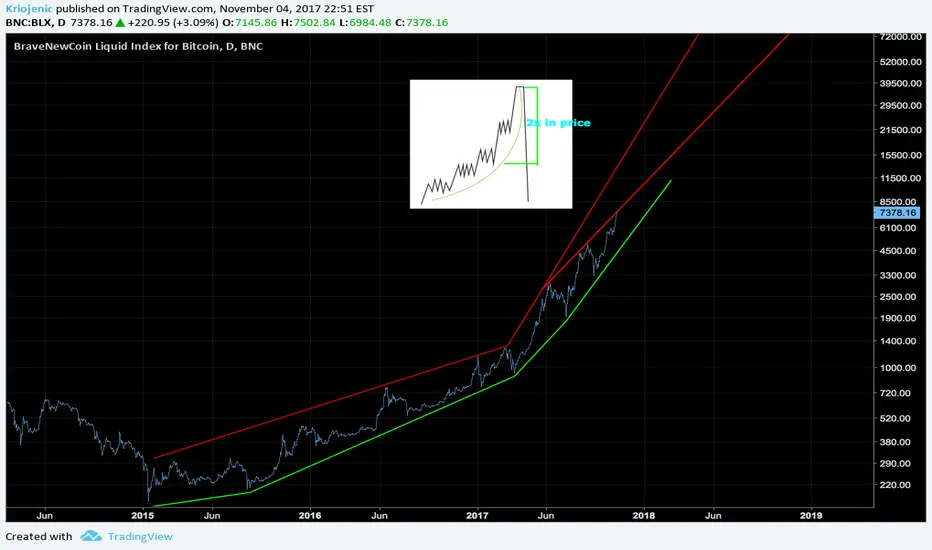
Parabolic move for BTCI know this is a crazy stretch, but what if we aren't in a long term bear market like many think, and we have one more parabolic move up before a long term (6m-1yr) bear market?
feel free to hate on it and call me an idiot :D
Note: This is not financial advice at the slightest
Parabolicmove

PDCBTC parabolic price movementThe price of PDC moves according to the Fibonacci sequence. It broke out from the resistance level of Fib 0.236 which is located near the point 0.0000150. According to the RSI the price is in an oversold zone, combining those factors together it should move in an ascending channel till the next resistance level and then step by step till the completion of Parabolic pattern at the point of Fib 0.786 which is located at 0.00003539.

BTC/USD Parabola As long as the old trend line holds, we are on a parabolic run in Bitcoin. Will update when new trend line might be in play. My best guess is that we see 12K and then a correction down in the orange zone around low 10K possibly 9.5K. In this scenario the parabolic movement stays intact and continues upwards with an even steeper trend. 20K before end of this year.

Bitcoin soon ending parabolic movement?Are we perhaps looking at one of the greatest corrections in history? If this parabolic pattern carries out, we may be looking at a monstrous retracement of somewhere between 80% to 97%. We are far overdue on our correction, with both a bigger elliott wave soon closing out, with a smaller elliott wave within that wave, and now with the parabolic pattern on the outside.
Give this two months and everyone will be screaming that they were correct about Bitcoin being a bubble, and that's when we buy - at ridiculously low prices. Time to get our own garage to store all our lambo's.

DSH Parabolic Rise - Trading Idea FunWhat goes up too fast, holds there too short. Short it as f, it will fall like a duck ;) Channel support possible. Moles digging there :D

$BTC - on log scales, fractal parabolic growth, & 50k BTCBoth of the major Bitcoin 'bubbles' we went through in 2013 showed parabolic growth when viewed on logarithmic scales. Most probably think we are in a bubble now, and surely we are, but how far into it are we? Was 4500 the ceiling? The big difference between 2013 and now—as you see here on this log-scaled chart of BTC's entire history—is that we have clearly not entered 'parabolic' territory on this scale. That doesn't mean we WILL—after all, we're in uncharted waters here. Who knows how BTC will act this go around, but if the pattern repeats, and we do go more parabolic from here... well, you see the price over there. Is that talk of $50000 per BTC possible, not ten years from now, but maybe... months from now?

$BTCUSD Elliott Wave Technical AnalysisBTCUSD in a parabolic move
Where are we to look for a possible level for a short**
2227 is my level to look for a possible top for wave 3 in the wave up from wave minor 4.
It's too early to say where this parabolic move will end, but parabolic moves normally end with a sudden burst of the bubble.
One of the few Elliott Wave rules says: The 3rd wave can't be the shortest. That's the reason why I have the alt1 and 2 set in. The 3rd wave is already longer than wave 1 therefore there is no limit for the 5th wave up and therefor the parabolic move could still extend and go much further up and make a blowoff top. But for the time being I look for 2227.
I will track BTCUSD 10.18% ongoing. Stay tuned.
Best to your trading
WALLSTScalper.com
René
