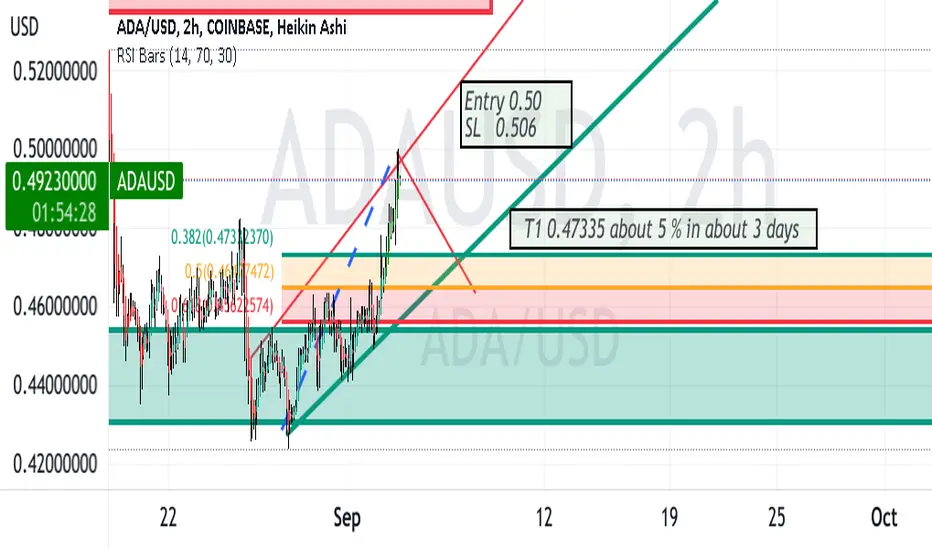
ADAUSD- SHORT ( from top of a parallel channel)COINBASE:ADAUSD
ADA is in an ascending channel and now sitting below the trendline resistance; In consideration of the
Fibonacci retracements from the prior uptrend, on the chart I can see the first potential target of 0.47335
which would represent a profit of about 5% in the short trade over perhaps 3 days. A stop loss of 0. 006
above the entry would yield a reasonable reward for that risk.
Parallelchanel

⭕Best BUY & SELL areas for GBPUSD 💣🔰You can see the analysis of the British Pound in US Dollars in a four-hour time frame (GBPUSD _ 4H) 🔍
✴️According to the price picture, it is moving in a parallel descending channel❗🧐
If the price can stabilize itself above the black🖤 line, then it can have an upward supply area🔺
In other words, if the price can stabilize itself below the orange🧡 line, then it can have a fall parallel channel to the bottom line🔻
which direction will the price go to the GREEN💚 side or the RED❤️ side❓❓
I hope the analysis was useful for you🤍🌹
📌Please introduce the channel to your friends 🙏🏻
____________📈TRADER STREET📉_______________

EURCAD 2Hello to all friends
An analysis on a 2-hour timeframe for scalper traders.
Enter the trade with your analysis.

$PETZ Next Target PTs 5-8 and higherTDH Holdings, Inc., together with its subsidiaries, develops, manufactures, and sells pet food products for pet owners in the People's Republic of China, Asia, Europe, and North America. It offers approximately 200 products, which include 4 product lines consisting of pet chews, dried pet snacks, wet canned pet food, and dental health snacks, as well as non-food items, such as dog leashes, pet toys, etc. The company sells its products under the Pet Cuisine, Hum & Cheer, and various other brand names. It offers its products to retailers and wholesalers, as well as through e-commerce platform. The company was founded in 2002 and is based in Qingdao, the People's Republic of China.

eur parallel channeleurusd is back to parity level
price are making lower low and lower high inside a yellow parallel channel
bullish only if upper trend line breaks than buy on retest
support lower trend line of channel
it could make double bottom on while rectangle which will be confirm by daily closing today and tomorrow (with confirmation above 1.03643)

CADCHF DHello dear friends
good day
In the daily time frame, I see this analysis of the CADCHF
what is your opinion?

BTCusdDear friends, hello again
I came with a new analysis
My personal opinion on the possible movement of Bitcoin in the time of 4 hours

BTCUSDHello, friends, the possible direction of Bitcoin movement may be like this in the time of 1 hour


Daily key levelHello everyone, I hope you are all well
I did this analysis using the price channel of resistance support and price action
In order to confirm the rise of Bitcoin, Bitcoin must cast a candlestick shadow in the blue rectangle without breaking the key support. After it returns to the green rectangle, we can open a long position and determine the loss limit.

gold vs fed rate hikegold price made top at 2070 since than it is going down constantly (it has made a low of 1680)
price has completed its wxyxz wave now it is in its final wave Z
wave z can retest lower line of the channel
if wave Y and Z followed the symmetry of 0.618 projection than wave Z can make bottom at 1656
i have labeled this trend wxyxz wave not 135 because of triangle correction in middle of wave Y
(the past wave count from the top of wave X and low of wave Y are available in links at the end of this post)
if we use fib retracement tool for extension than our down target is 1656
if we use fib extension tool than our downside target is 1667
if we use simple support and resistance than our downside target it 1676
key economics events
fed pivot from QT to QE in recession fear
global recession forcing fed to rate cut
(both sign will be visible by the end of December)


Binance BNB - Record! New ALL TIME HIGH no one is talking about!
BNB just set a new all-time high after 14 months!
I suggest you buy BNB coin or BNB leveraged token, because this is one of the most bullish altcoins at this moment.
As per my Elliott Wave analysis, an ABCDE correction has been completed and we can continue in the uptrend!
Also, we have a bullish rectangle consolidation (base) on the weekly chart, and the base has been destroyed by the bulls recently.
I expect a 1:1 FIB or 0.786 extension for the next wave.
Look at my ideas about interesting altcoins in the related section down below.
For more ideas, please hit "Like" and "Follow"!


BTC TECHNICAL ANALYSISBTC finding support on FIBU LEVEL 0.382, while trading inside a Parallel channel. Making Higher Highs and Higher Lows, seems to be Bullish but I would wait for further confirmation for breakout above the channel for a new trend.
Otherwise one can trade within the parallel channel. If price breaks out of the channel, next watch level would be 27K BTC.

GBPNZD 4hhello dear friends
This is my analysis about this currency pair and in my opinion, its short-term trend is bullish

Will Bitcoin break bullish channel?The price is at the top of the channel at the 50% retracement.
A short squeeze can happen.

Coinbase Rumors with some News sprinkled on topNASDAQ:COIN
I wanted to combine simple technical analysis with tangible real world events.
S/R with some short term targets and a parallel channel, is as basic as chart analysis goes, for me personally it is enough to come to a conclusion and plan the trade.
Recent history (in the crypto market) would suggest there could be trouble ahead for Coinbase. I picked a few events which show how Coinbase is attempting to optimize, consolidate, cut cost and find extra revenue stream.
Summer et al, timeline of news (and rumors) about Coinbase:
May 10th, 2022 - Coinbase adds new language to Form 10-Q regarding bankruptcy
June 2nd, 2022 - Coinbase rescinds already accepted job offers. Amy Castor wrote a great post covering that event.
June 14th, 2022 - Coinbase lays off 1100 employees. CEO and Cofounder Brian Armstrong shared an explanation on Coinbase Blog.
June 29th, 2022 - FOIA (Freedom of Information Act) request reveals that Coinbase has been providing ICE with blockchain analytics tools.
July 15th, 2022 - Leaked email reveals Coinbase plans to shutdown its affiliate-marketing program.
I purposely do not comment on the timeline, as all of us will interpret it differently, might be interesting to see the comments.
I don't believe that it's unreasonable to tread lightly while trading Coinbase, although there are plenty of fish, maybe I'll just trade something else and see how this story develops.
This is my Thesis, targets are purely hypothetical based on my analysis.
This is NOT Investment and/or Trading Advice.
Happy Trades!
❤️ If you enjoy my ideas , Please like/comment , It means a lot, Thank You! ❤️

golden parallel channel H4gold price are making lower low and lower high a clear down trend on H4 time frame
inside yellow parallel lines


BTSUSD 4hHello friends. What do you think about Bitcoin? This is my analysis in the 4-hour time frame.

