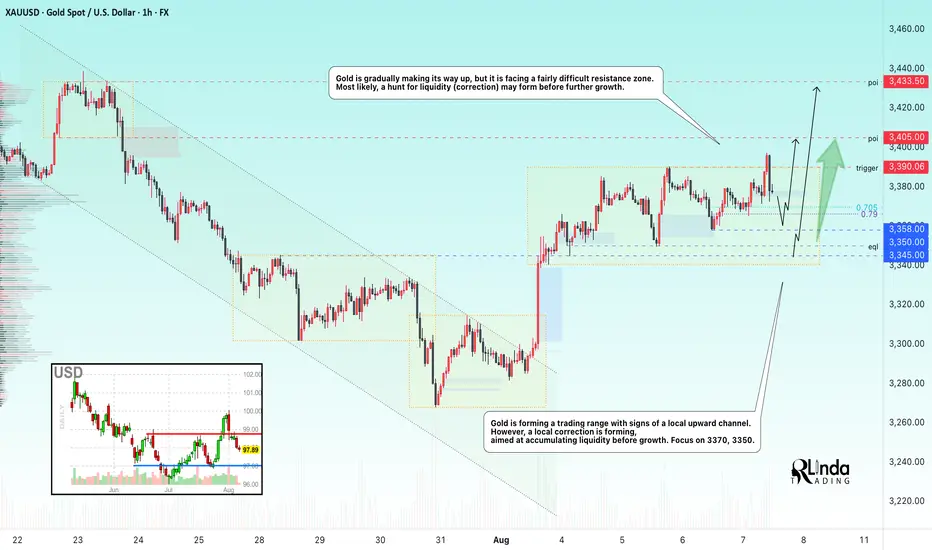
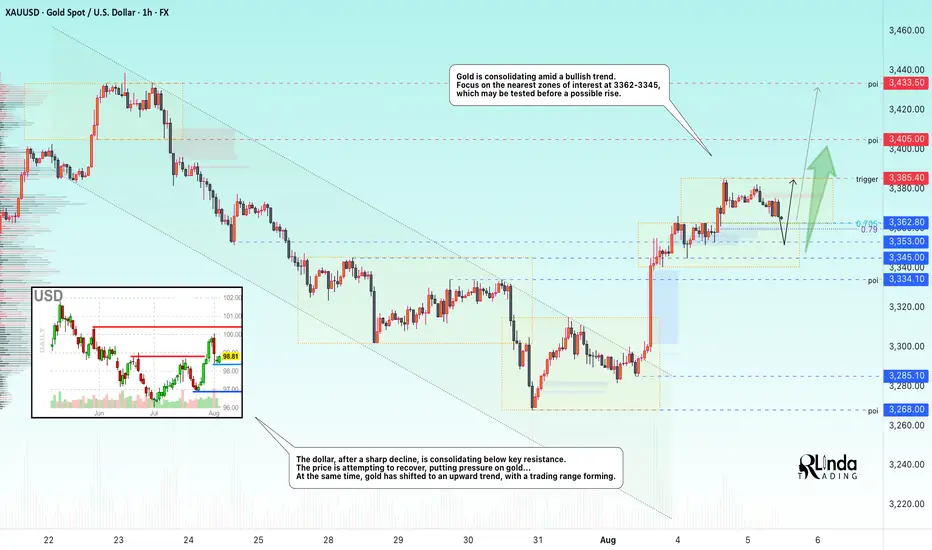
GOLD → Correction before a breakout and rallyFX:XAUUSD is gradually making its way upward, but it faces a fairly difficult resistance zone. Most likely, a long squeeze may form before further growth.
Gold is rising amid uncertainty: Expectations of key US labor market data (unemployment claims, labor costs), the possibility of a Fed rate cut in September after weak employment and services data, new trade threats (possible 15% tariffs on Japanese imports and restrictions on Russian oil supplies to China)
Key risks:
Trump's decision on Fed appointments (replacement of Kugler and Powell) and further escalation of trade conflicts could increase volatility. For now, dovish expectations and demand for safe-haven assets are supporting gold.
Technically, the focus is on the local range of 3390-3335 (3350). A false break of support could trigger growth...
Resistance levels: 3390, 3405, 3433
Support levels: 3365, 3358, 3350
The fall of the dollar is supporting the already bullish gold... However, before continuing its growth, the price is forming a correction, and a false breakout of support and liquidity capture could have a positive effect on the market for further upward movement...
Best regards, R. Linda!
Parallel Channel
GOLD → A stalemate situation - a bullish wedgeFX:XAUUSD is unable to break through the resistance level of 3400. However, an ambiguous “bullish wedge” pattern is forming on the chart...
The price of gold retreated from a two-week high on profit-taking. The correction intensified after the US imposed tariffs on imports of gold bars (1 kg), which could disrupt supplies from Switzerland and London.
Key supporting factors: Escalation of trade conflicts, concerns about the US economy and pressure on the Fed, questions about the Fed's independence after Trump's appointments
Risks: Short-term volatility ahead of US CPI data next week. However, fundamental drivers remain bullish.
Support levels: 3390, 3350
Resistance levels: 3405, 3435
The problem with the bullish wedge pattern is that it forms an ambiguous figure. We have an upward movement, but the pattern could easily reverse the local upward trend due to the fairly difficult resistance zone of 3390-3410.
If gold manages to consolidate above 3405, this will increase the chances of growth to 3435-3500.
BUT! There is a fairly high chance that the 3390 support level could be broken. In this case, the market could fall to 3350 before rising...
Best regards, R. Linda!

BITCOIN → Retest of resistance in the bearish trading rangeBINANCE:BTCUSDT.P is consolidating in the range of 115,600 - 113,500. The price is testing resistance, relative to which a huge pool of liquidity has formed, which bears are likely to defend quite aggressively...
Idea from July 22: expectation of a decline from 120K to 112K. Target achieved
Bitcoin is correcting on D1, the price previously broke through the support level of 115650 and formed another trading range, with the previously broken lower boundary of the consolidation acting as resistance. The market has not yet tested the zones of interest at 110K and 105K, and therefore the possibility of a further decline remains relevant. A liquidity pool has formed relative to the resistance of the trading range at 115678. There is a high probability of a short squeeze before the decline.
Resistance levels: 115678, 116370
Support levels: 113530, 112660, 110K
In the short term, I expect a retest of resistance and a capture of liquidity. If the market is unable to continue its upward momentum and returns the price below the level, a false breakout will form, which may trigger a decline to the indicated areas of interest.
Best regards, R. Linda!

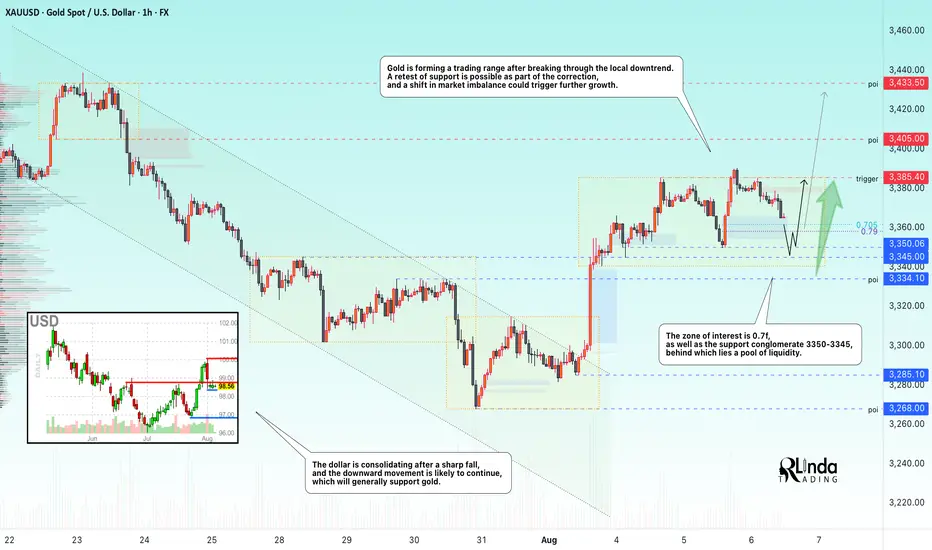
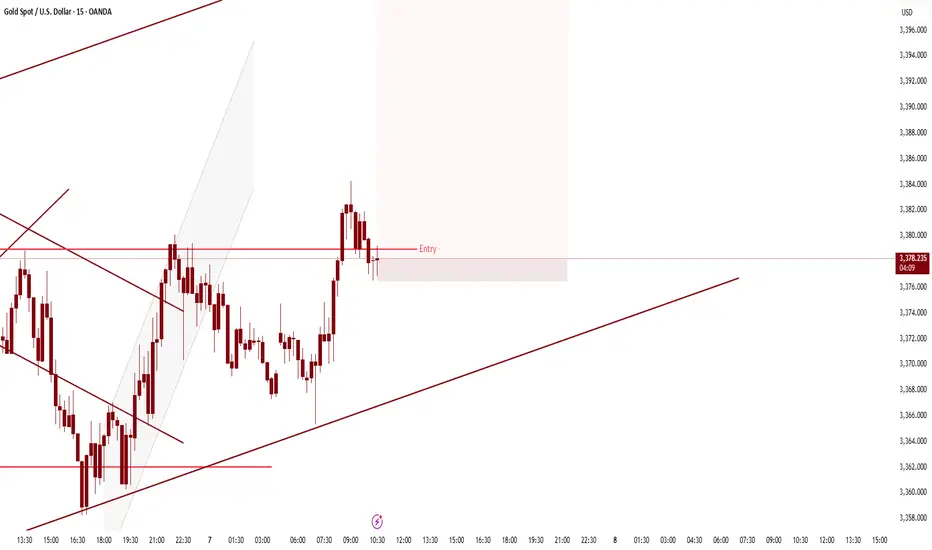
GOLD → Long squeeze of support ahead of possible growthFX:XAUUSD is entering a consolidation phase after a rally. The market is forming a trading range, and a retest of support could end in growth...
Gold pulled back from an 8-day high ($3391) on profit-taking ahead of Trump's Fed appointments. Weak ISM services data (50.1) and a pause in the dollar's weakening added pressure, although expectations of Fed policy easing in September remain supportive.
The market focus is on key events: Fed appointments (including a possible replacement for Powell) and Trump's trade statements. These factors could provide new momentum after the current correction, as long as the fundamental drivers for growth remain in place.
Resistance levels: 3385.4
Support levels: 3358, 3350, 3345
Technically, the price has confirmed resistance after a false breakout, and the market needs to build up potential for a possible continuation of growth. At the moment, the most likely scenario is a long squeeze (false breakdown) before growth continues. Focus on the key support zone.
Best regards, R. Linda!
Bitcoin Bounces Back — Is $120K the Next Stop?!Bitcoin ( BINANCE:BTCUSDT ) reacted well to the 50_SMA(Daily) and the Heavy Support zone($112,000-$105,800 and started to rise again.
The question is, can Bitcoin reach $120,000 again and even create a new All-Time High(ATH)!?
In terms of Elliott Wave theory , it seems that Bitcoin has managed to complete the main wave 4 in the descending channel . To confirm the end of the main wave 4 , we must wait for the upper line of the descending channel to break. The structure of the main wave 4 is a Zigzag Correction(ABC/5-3-5) .
I expect Bitcoin to trend higher in the coming hours and attack the resistance area and the upper line of the descending channel(First Target: $117,490) .
Do you think Bitcoin's main correction has begun, or does Bitcoin still have a chance to create a new ATH?
Second target: $119,991
Cumulative Long Liquidation Leverage: $113,526-$112,591
Note: Stop Loss: $111,070
Please respect each other's ideas and express them politely if you agree or disagree.
Bitcoin Analyze (BTCUSDT), 2-hour time frame.
Be sure to follow the updated ideas.
Do not forget to put a Stop loss for your positions (For every position you want to open).
Please follow your strategy and updates; this is just my Idea, and I will gladly see your ideas in this post.
Please do not forget the ✅' like '✅ button 🙏😊 & Share it with your friends; thanks, and Trade safe.

EURUSD → The correction is over. Bullish trend...FX:EURUSD is consolidating above key support from D1. The trend is bullish, and against the backdrop of a weaker dollar, the currency pair is returning to its main movement.
The currency pair is forming a local uptrend, with a fairly clear upward support line that intersects with an important support level. The price has emerged from correction and returned to the trend amid a decline in the dollar, which is mainly bearish. Given the situation with EUR/USD, I would focus on the support zone of 1.1631 - 1.1613, 1.1597. A fairly large pool of liquidity has formed in this zone. A false breakdown and the price holding in the buy zone could trigger a bullish run...
Resistance levels: 1.1676, 1.171, 1.175
Support levels: 1.163, 1.161, 1.160
If the bulls keep the price in the buying zone, i.e. above the key support zone mentioned above, then in the medium term, the currency pair may continue to rise with the possibility of updating local highs...
Best regards, R. Linda!

USDCAD → Short squeeze for further declineFX:USDCAD is forming another short squeeze relative to the global price range ahead of a possible decline within the global downtrend.
After breaking through the resistance of the global trading range, USDCAD was unable to continue its upward momentum. The price returned to the range, under strong resistance, and is forming a pre-breakdown base for a possible decline. The trigger in our case is support at 1.3762. The dollar is stagnating, trading below strong resistance. A decline in the dollar could trigger a fall in USDCAD
Support levels: 1.376, 1.3695, 1.3629
Resistance levels: 1.3774, 1.3809
The market structure is quite weak, both globally and locally. In addition, against the backdrop of an expected rate cut, the dollar may continue its downward global trend, which may also affect the price of the currency pair, which has formed a false breakout of resistance...
Best regards, R. Linda!

MarketBreakdown | USDJPY, NZDUSD, EURJPY, US100
Here are the updates & outlook for multiple instruments in my watch list.
1️⃣ #USDJPY daily time frame 🇺🇸🇯🇵
The market is trading in uptrend.
After the price updated a high, it retraced.
I see a consolidation now and a formation of a narrow
horizontal trading range.
A bullish breakout of a resistance of the range and a daily
candle close above that will provide a strong trend-following bullish signal.
An uptrend will most likely resume then.
2️⃣ #NZDUSD daily time frame 🇳🇿🇺🇸
A test of a historically significant major demand cluster triggered a strong
bullish reaction. The price violated a strong resistance and closed above that.
I think that the market will most likely continue growing.
3️⃣ #EURJPY daily time frame 🇪🇺🇯🇵
The pair is trading within a horizontal parallel channel.
With the absence of high impact fundamental news today,
I think that the market will most likely continue consolidating
and the price may retrace from the resistance.
4️⃣ #NASDAQ Index #US100 daily time frame 🇺🇸🇨🇭
Looks like the market is preparing to update the ATH.
A confirmed violation of a minor daily resistance and a valid
Change of Character on intraday time frames indicate clear
strength of the buyers.
I guess that 23700 level will be tested soon with its highly probable breakout.
Do you agree with my market breakdown?
❤️Please, support my work with like, thank you!❤️
I am part of Trade Nation's Influencer program and receive a monthly fee for using their TradingView charts in my analysis.

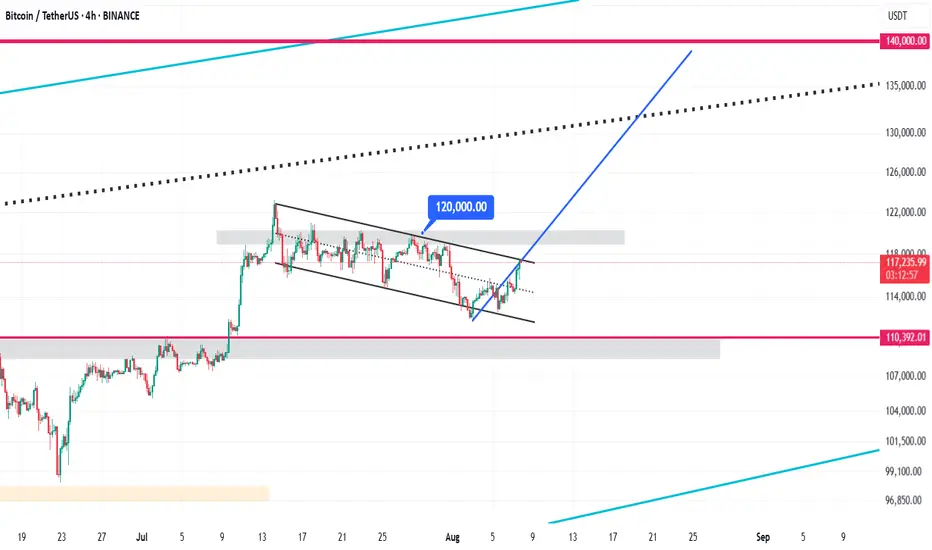
Bitcoin Bullish Flag Pattern Analysis & $140,000 Target🚩 Bullish Flag Pattern Formation
Bitcoin is currently forming a bullish flag pattern on the 4-hour chart. This pattern typically appears after a sharp upward move and represents a short-term consolidation within a descending channel. It usually signals a continuation of the strong bullish trend. Currently, the price is oscillating between the upper and lower boundaries of this channel, poised for a potential breakout.
⏳ Duration of the Correction Phase
The correction inside this channel has lasted from July 14 to August 8, 2025, spanning approximately 25 days. This relatively long consolidation period indicates a deep stabilization phase, allowing the market to gather momentum for the next upward wave. During this time, Bitcoin traded in a tight range between the channel’s support and resistance levels.
⚠️ Critical Resistance at $120,000
The key resistance level to watch is $120,000. If Bitcoin can break this level decisively with strong volume and confirming candles, the bullish flag pattern will be validated, signaling a continuation of the upward trend. This breakout point is considered an optimal entry for new long positions.
🎯 Price Target at $140,000
The target price derived from the bullish flag pattern, calculated by measuring the flagpole and projecting it from the breakout point, is around $140,000. This represents approximately a 20% gain from the breakout and may serve as a significant psychological resistance level.
OMNI : Will it happen again?Hello friends🙌
✅As you can see, everything is clearly and explicitly drawn for you.
✅Just pay attention to risk and capital management for trading and if you like, support us.
🔥Follow us for more signals🔥
*Trade safely with us*

EPIC : Risky signal...Hello friends🙌
🔊Due to the good price growth, we have found important support points for you.
Now, due to the price correction, we have found buy points for you and you can buy with risk and capital management and move with it until the goals we have set for you.
🔥Follow us for more signals🔥
*Trade safely with us*

Supply in Sight: AUDUSD Gearing Up for a Reversal?Hello TradingView Family / Fellow Traders. This is Richard, also known as theSignalyst.
📈AUDUSD has been overall bullish trading within the rising channel marked in red and it is currently retesting the upper bound of the channel acting as an over-bought zone.
Moreover, the blue zone is a strong supply.
📚 As per my trading style:
As #AUDUSD approaches the red circle zone, I will be looking for bearish reversal setups (like a double top pattern, trendline break , and so on...)
📚 Always follow your trading plan regarding entry, risk management, and trade management.
Good luck!
All Strategies Are Good; If Managed Properly!
~Rich
Disclosure: I am part of Trade Nation's Influencer program and receive a monthly fee for using their TradingView charts in my analysis.

EURCAD: More Growth Ahead 🇪🇺🇨🇦
EURCAD broke a resistance line of a bullish flag pattern yesterday.
A consequent confirmed Break of Structure BoS indicates
that the rise will most likely continue.
The next strong resistance is 1.61.
The market is going to reach that soon.
❤️Please, support my work with like, thank you!❤️
I am part of Trade Nation's Influencer program and receive a monthly fee for using their TradingView charts in my analysis.

XAU BULLISH 0708025XAUUSD is currently in a strong uptrend on both the primary and secondary waves. The minor trend has broken out of its previous bearish trend.
Stop Loss (SL) and Take Profit (TP) levels are as shown in the image.
SHORT ON GOLD (XAU/USD)GOLD has a nice rising channel which is a (BEARISH) reversal pattern with plenty of sell side liquidity to be captured to the downside.
I sold GOLD at 3397 and expect Gold to fall over $80-$100 which is 800-1000 pips.

GBPUSD - Bearish ValidationGBP completed HAS pattern and now is testing the Resistance cluster - what for me is the Bearish Validation of trend reversal to downtrend.
Yet the price is staying within the downtrend channel.
If price respects the Resistance and the channel - we are in the downtrend.
Jus my humble opinion

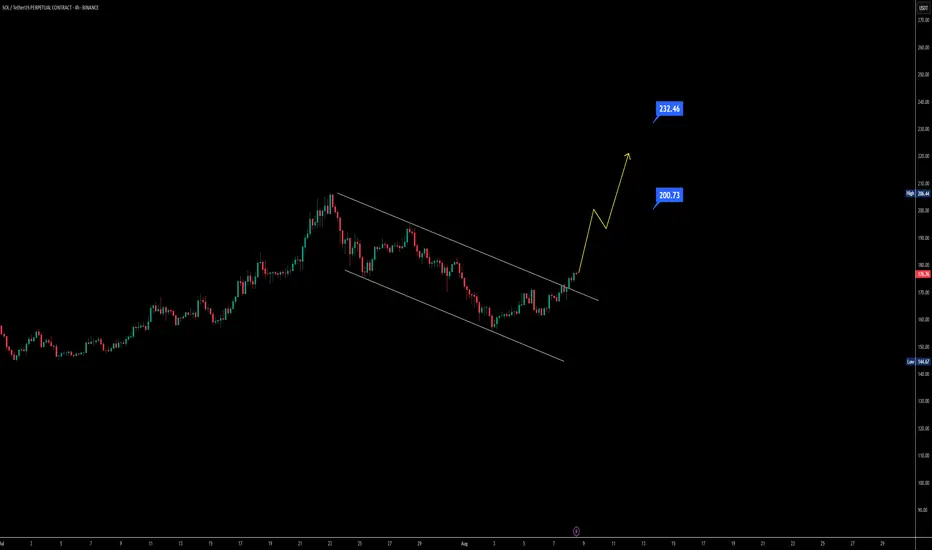
$SOL channel breakout could lead to a rally toward $260Solana has broken out of its recent downtrend on both the daily and 4-hour charts, showing clear signs of bullish strength. The price is pushing beyond its channel, and momentum suggests that the $200 liquidity zone is within reach.
If CRYPTOCAP:SOL can close above the $206 resistance, it could open the door for a rally toward $230–$260, revisiting the prime all-time high area. EMA structure is also supportive — the 21 EMA has crossed above the 50 EMA, while the 100 EMA has crossed over the 200 EMA, both reinforcing the bullish outlook.
With technical aligning and momentum building, Solana’s next move could be one of the most significant runs we’ve seen this year.
Macro Bullish with a Hint of Bearish - Gold Analysis and TargetsOn the short term we are direction neutral but expecting a pull-back sometime in August. Waiting for a break in the channel pattern for positioning. On the Macro, we have an ascending triangle formation with an overall bullish bias.

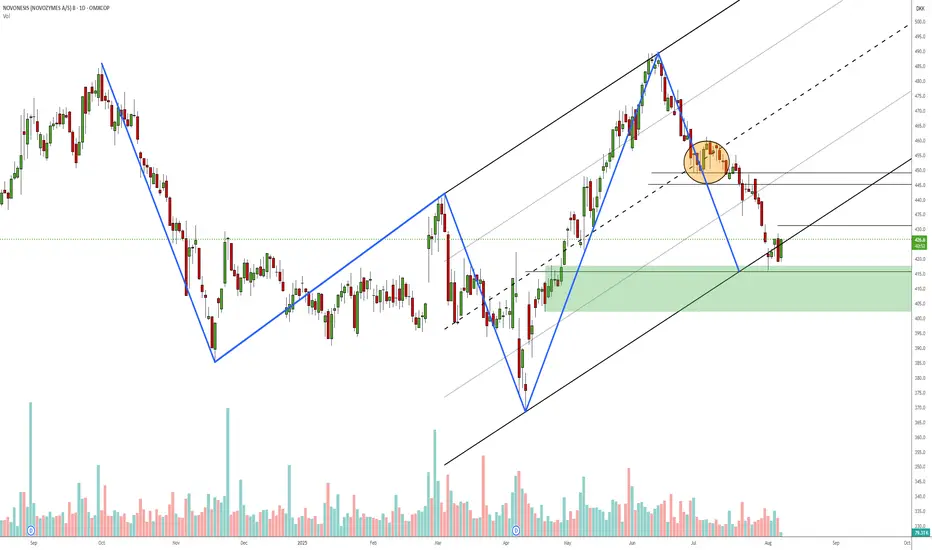
Novonesis daily reversal?Measured move / 3-point channel to test of failed symmetry zone. Might take 1/3 off around 445 depending on PA. I might add to the position if the bearish ab=cd at 431 fails and I'll be looking to take the loss if it drops below 400. Haven't used harmonic patterns for a long time, but this does resemble a 5-0 pattern if I'm not mistaken?
ENAUSDT - Bullish Flag or Descending Channel?My operation is to eat the profits of this period, and then change the operation according to the market

AUD/USD Long Trade Setup – Buying at the Channel LowOANDA:AUDUSD
🔍 Technical Overview:
The pair is trading within a well-defined ascending channel.
A potential bullish reversal is forming at the confluence of:
Channel support
Local structural support (highlighted in orange circle)
Bullish wick rejections and slowing downside momentum
📈 Trade Idea: BUY AUD/USD
Entry: Market buy or buy near 0.6450 – 0.6465
Stop-Loss: Below the swing low and channel support at 0.64160
Target 1: 0.65150
Target 2: 0.6566
Target 3: 0.66160
Risk-to-Reward: ~1:3 R:R ratio
Monitor price action near mid-channel resistance
🧠 “If the structure speaks to you, let it echo.” – Let the price action confirm your bias before committing fully.
Previous Sell Setup at the top of channel:
Psychology Always Matters:

GOLD → Consolidation and correction before growthFX:XAUUSD continues to consolidate after a strong rally. The market is returning to a bullish trend, but a correction is possible before growth continues...
Gold is rising amid expectations of Fed policy easing. The market is finding support amid:
a 90.5% probability of a Fed rate cut in September, weak US employment data, and dovish comments from Fed officials.
The market is waiting for news that could determine further movement. ISM Services PMI data: strong figures could temporarily support the dollar, while weak figures could increase pressure on the USD. Questions about the Fed's independence after Trump fired the head of the BLS. Gold is maintaining its upward momentum, but its dynamics will depend on macro statistics and the Fed's response.
Technically, the focus is on the local trading range of 3385 - 3363 - 3353.
Resistance levels: 3385.4, 3433
Support levels: 3362, 3353, 3345
A retest of support and holding the price above key support could trigger a continuation of the uptrend, but it is important to pay attention to the fundamental background.
Best regards, R. Linda!
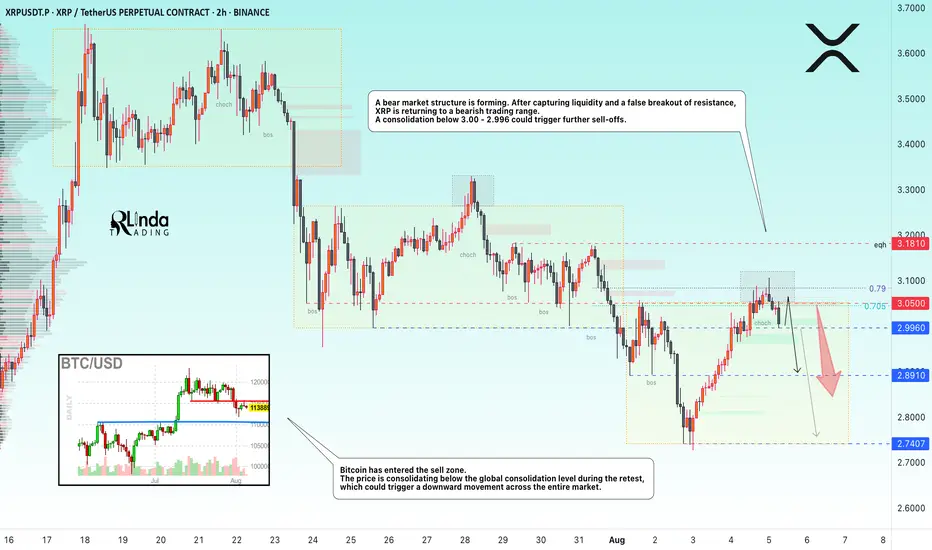
XRPUSDT → Hunting for liquidity ahead of a possible declineBINANCE:XRPUSDT.P is forming a downward market structure after a false breakout of global resistance. Bitcoin is in a correction phase and, after a slight rebound, may continue its movement...
Bitcoin has entered the sell zone. The price is consolidating below the global consolidation boundary of 115,500 during the retest, and if Bitcoin continues to decline, this could trigger a downward movement across the entire cryptocurrency market.
XRP is forming a bearish market structure. After capturing liquidity and a false breakout of resistance, the price is returning to a bearish trading range. There is no potential for continued growth at this time. A consolidation of the price below 3.00 - 2.996 could trigger further sell-offs.
Resistance levels: 2.996, 3.050, 3.181
Support levels: 2.996, 2.891, 2.74
The local bearish structure will be broken if the price starts to rise, breaks 3.050, and consolidates above it. In this case, XRP may test 3.181 before falling further.
At the moment, after a false breakout of resistance, the price is consolidating in the selling zone, and the downward movement may continue. I consider 2.74 - 2.655 to be the zone of interest in the medium term.
Best regards, R. Linda!