US Jobless Claims: Why They Matter for EURUSD 🇺🇸FOREXCOM:EURUSD
📈 US Jobless Claims: Why They Matter for EURUSD 🇺🇸💼
While Trump’s tariff policies ⚔️ remain in focus, it’s important not to overlook today’s economic calendar 🗓️, with Initial Jobless Claims taking the spotlight.
🧐 What are Jobless Claims?
Initial Jobless Claims 📑 measure the number of people filing for state unemployment insurance for the first time. Released weekly by the US Department of Labor 🏛️, it’s a key indicator of the health of the US labor market 💪.
Why does it matter?
A strong labor market typically supports the US dollar 💵, as it reduces the likelihood of immediate Fed rate cuts 🕰️, while higher claims suggest a weakening economy, which could pressure the dollar lower.
📊 Latest Figures:
🔹 Previous: 233K
🔹 Forecast: 235K
Last week, claims fell from 237K to 233K, highlighting continued labor market resilience. If today’s data beats expectations (lower claims), the USD may strengthen 🛡️, potentially pushing EURUSD below 1.1700. Conversely, higher claims could weaken the USD ⚠️, lifting EURUSD above 1.1800.
💡 Trade Idea:
BUY EURUSD at 1.17300
❌ Stop Loss: 1.17600
✅ Take Profit: 1.16500
While the US labor market remains strong, technical factors and broader fundamentals can confirm a strong EURUSD reversal, keeping bearish opportunities in play.
🚀 Stay tuned for live reactions after the data drops!
💬 Support this post if you find it useful! 🔔
Parallel Channel
XRPUSDT → Resistance ahead. Correction before growthBINANCE:XRPUSDT is rising after breaking through consolidation resistance. Bitcoin's rally supported the overall market momentum, but a new resistance zone lies ahead...
Bitcoin is testing its ATH and updating it, but is facing pressure and forming a false breakout. A correction in the flagship coin could trigger a correction in XRP, but if Bitcoin continues to storm the 112K area without a pullback, followed by a breakout, the market could find support and continue to rise.
After XRP broke through resistance, the coin entered a distribution phase and is testing an important resistance zone of 2.4488 - 2.4772. The inability to continue growth, a false breakout, and price consolidation in the selling zone could trigger a correction.
Resistance levels: 2.4488, 2.4772, 2.6524
Support levels: 2.3587, 2.3375, 2.2455
Despite breaking through resistance, XRP is still in a local downtrend. Pressure on the market is still present. The formation of a false breakout will indicate that growth is limited for now. However, if the price consolidates above 2.4772 and begins to break out of the local structure, we can expect growth to continue.
Best regards, R. Linda!

BITCOIN → Market manipulation. Chance for growth to 110KBINANCE:BTCUSDT , as part of a correction triggered by negative news from the US regarding tariffs, is testing liquidity in the support zone. There is a chance of recovery to 110K.
Bitcoin is reacting with a decline to fundamentally negative data on tariffs from Trump. Technically, the price is facing support and forming a false breakdown, the purpose of which was to capture liquidity. This could lead to a recovery within consolidation in an uptrend, but again, there are conditions...
Countries that have received notification of tariffs are responding positively to cooperation (if this trend continues, Bitcoin could receive a local bullish driver).
The market perceives this as positive, and after liquidity is captured, the price could recover to the resistance of the trading range.
Resistance levels: 108230, 109690
Support levels: 107500, 106500
Bulls are trying to hold the local interim bottom at 107500. There is a reaction to the false breakdown of support. The focus is on 108230; if the market can break through this level, we will have a chance to grow to 110K.
Best regards, R. Linda!

Mastercard Could Face ResistanceMastercard fell hard in June on the threat of stablecoin competition. Now, after a rebound, some traders may expect another push to the downside.
The first pattern on today’s chart is the selloff that began on June 13 when the Wall Street Journal reported that major retailers were considering stablecoins as an alternative to credit-card payment systems. Another drop came the following week after the U.S. Senate passed the GENIUS Act regulating stablecoins.
The stock recovered in the second half of June but it halted at the post-drop closing high of $569.45. Has new resistance emerged?
Third, prices could be stalling at the 50-day simple moving average. The 8-day exponential moving average (EMA) is additionally below the 21-day EMA. Those signals may reflect weakening intermediate- and short-term trends.
Fourth, stochastics have reached an overbought condition.
Finally, this month’s lower high could potentially represent the start of a new falling channel. Such a pattern could make investors expect a lower low closer to $500.
Check out TradingView's The Leap competition sponsored by TradeStation.
TradeStation has, for decades, advanced the trading industry, providing access to stocks, options and futures. If you're born to trade, we could be for you. See our Overview for more.
Past performance, whether actual or indicated by historical tests of strategies, is no guarantee of future performance or success. There is a possibility that you may sustain a loss equal to or greater than your entire investment regardless of which asset class you trade (equities, options or futures); therefore, you should not invest or risk money that you cannot afford to lose. Online trading is not suitable for all investors. View the document titled Characteristics and Risks of Standardized Options at www.TradeStation.com . Before trading any asset class, customers must read the relevant risk disclosure statements on www.TradeStation.com . System access and trade placement and execution may be delayed or fail due to market volatility and volume, quote delays, system and software errors, Internet traffic, outages and other factors.
Securities and futures trading is offered to self-directed customers by TradeStation Securities, Inc., a broker-dealer registered with the Securities and Exchange Commission and a futures commission merchant licensed with the Commodity Futures Trading Commission). TradeStation Securities is a member of the Financial Industry Regulatory Authority, the National Futures Association, and a number of exchanges.
TradeStation Securities, Inc. and TradeStation Technologies, Inc. are each wholly owned subsidiaries of TradeStation Group, Inc., both operating, and providing products and services, under the TradeStation brand and trademark. When applying for, or purchasing, accounts, subscriptions, products and services, it is important that you know which company you will be dealing with. Visit www.TradeStation.com for further important information explaining what this means.

DYDX Breakout from Falling Wedge | Targeting $1.60+# DYDX Breakout from Falling Wedge | Targeting $1.60+
📈 **DYDX/USDT Analysis – Daily Timeframe**
DYDX has just broken out of a falling wedge pattern – a classic bullish reversal formation – after holding a strong support zone around **$0.50**. This zone has acted as a reliable demand area for several months.
---
🔍 **Technical Highlights:**
- ✅ Falling wedge breakout confirmed with daily candle close above resistance
- 🟢 Strong support at $0.50–$0.52
- ⚠️ Horizontal resistance at $0.75 may act as a short-term barrier
- 🚀 Potential rally toward major resistance at **$1.60–$1.70** (target zone)
---
🎯 **Profit Targets:**
- First Target: **$0.75**
- Final Target: **$1.60 – $1.70**
❌ **Invalidation (Stop-loss idea):**
- If price breaks below $0.48 with volume, the bullish scenario may be invalidated.
---
📊 This setup is based on breakout structure and potential trend reversal. If volume confirms, this could be the beginning of a new mid-term uptrend.
💬 Let me know what you think about this setup! Would love to hear your feedback.

CRUDE OIL (WTI): Will It Rise More?
Quick update for my yesterday's analysis for WTI Crude Oil.
As I predicted yesterday, the price went up to the target.
We got one more strong bullish confirmation after a New York
session opening:
the price violated a resistance of a horizontal range on a 4H time frame.
I think that the market may rise even more and reach 69.25 level.
❤️Please, support my work with like, thank you!❤️

GBPUSD - Macro Trend Continues!Hello TradingView Family / Fellow Traders. This is Richard, also known as theSignalyst.
📈GBPUSD has been overall bullish trading within the rising channel marked in red. And it is currently retesting the lower bound of the channel.
Moreover, the green zone is a strong structure.
🏹 Thus, the highlighted blue circle is a strong area to look for buy setups as it is the intersection of the lower red trendline and structure.
📚 As per my trading style:
As #GBPUSD approaches the blue circle zone, I will be looking for bullish reversal setups (like a double bottom pattern, trendline break , and so on...)
📚 Always follow your trading plan regarding entry, risk management, and trade management.
Good luck!
All Strategies Are Good; If Managed Properly!
~Rich
Disclosure: I am part of Trade Nation's Influencer program and receive a monthly fee for using their TradingView charts in my analysis.

GOLD → Readiness to test the local bottomFX:XAUUSD is under pressure from the rising dollar and uncertainty, breaking through support levels, which opens up a corridor for the market to fall to 3255 - 3246
The price of gold is consolidating around $3300 after falling more than 1% amid expectations of the Fed minutes and news about tariffs.
Investors remain cautious: the dollar is supported by hopes for US trade deals, while the threat of new tariffs from August 1 is holding back gold's growth.
Weak inflation data in China did not support the metal, while expectations that the Fed will not rush to cut rates due to inflationary pressure from tariffs are also limiting interest in gold. Traders are waiting for the Fed minutes and new statements from Trump to determine the further direction.
Technically, the market looks weak (on D1, the price closed below the key level of 3300 on Tuesday) and there is a chance of a further decline.
Resistance levels: 3300, 3311
Support levels: 3295, 3255, 3246
Consolidation below 3295-3300 could trigger a further decline to 3255, from which the market could react with a correction.
Buying can be considered if gold reverses the short scenario, manages to strengthen to 3311, and consolidates above this level. At the moment, the price is in the selling zone...
Best regards, R. Linda!

EURUSD → Bullish daily structure. Correction before growthFX:EURUSD , after significant growth and a break of structure, has entered a local correction, the target of which may be a phase of accumulation of potential for updating intermediate highs (1.183).
The daily market model is bullish. A break of the structure has formed on D1, and the market is entering a correction phase, during which it may be interested in testing 0.5 or the 0.7 Fibonacci area before continuing its growth. I would also like to draw attention to the previously broken resistance level of 1.164 - 1.163, which, within the current correction, may act as a support level for buyers...
In addition, the market has not yet reached the liquidity level it was heading for during the correction for a possible continuation of growth. Zone of interest: 1.168, 1.164, 1.159
Resistance levels: 1.1728, 1.1766
Support levels: 1.168, 1.164, 1.159
A false breakdown of the specified support zone could change the market imbalance and attract buyer interest, which could generally support the bullish trend.
Best regards, R. Linda!

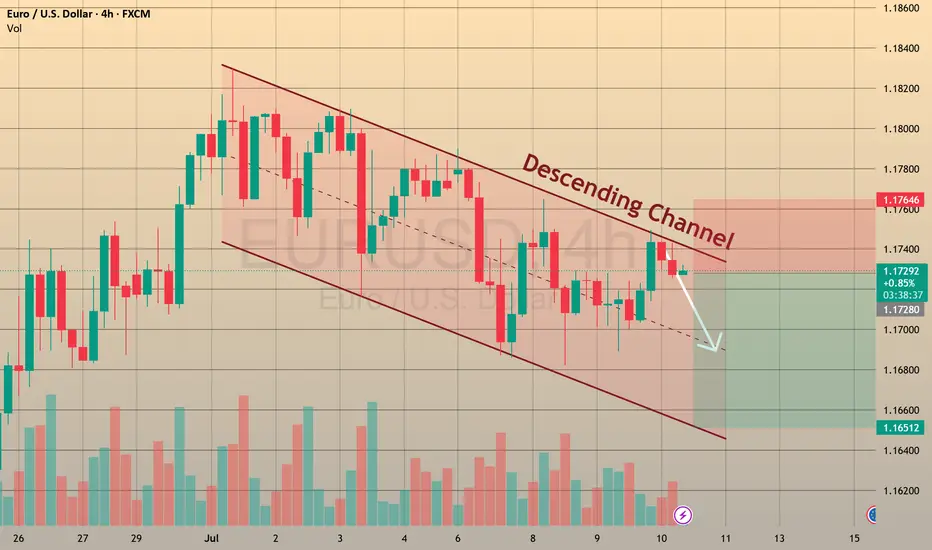
EURUSD TRADES BEARISH
Last week, due to a fail of holding above the 1.18000 level, we saw a huge 1-hour decline of 0.39% on big selling volumes, which is not typical for such instruments as EURUSD. Since that time, the price has been moving within a descending channel and has formed a possible pennant yesterday. All of the factors "vote" for going bearish in this asset.
So, what will be the possible scenario? We may go market sell right immediately, or wait till the breakout of the pennant pattern. In this case we may set
🔽 a sell stop order at 1.17400 with
❌a stop loss at 1.17670 and
🤑a take profit at 1.16915
Additionally, EURUSD may go even further downstairs, next to a 1.16000 support level. For this case we may preserve some minor part of our position with a take profit set nearby this level.

EURNZD with bullish flag patternbefore this bullish pattern, it can be seen that price action made a channel in which it made HHs and HLs, and then a flag pattern appeared. Now, the price is breaking flag in upward direction and if this breakout is real a bullish rally can be seen

BTC , 4hr , BearishBTC is Forming a Pattern and it is at the top of the Another Pattern and It is facing rejection 3 Times from Above and now it is forming another pattern inside and Ready for Break Down of the Pattern , if it breaks the Pattern Down then it will be bearish almost 90% it will move to down side , if it has not given Breakdown and moving inside the small pattern then wait patiently and observe carefully .
Then it may also give Breakout for up side .
Follow Risk Management Properly
Follow for More Swing Ideas Like this .

Bitcoin is bullish in world of War or Peace Simple and easy it is like Gold but better version and limited edition one.
Both(BTC & XAU) are bullish most of the time because future is not for Paper Tokens like Dollar or Yuan or Ruble or Euro or ..
Currency of strong countries seems interesting But soon with more laws and Taxes and Rules against each other Economic which USA start it, more and more Trades and things are going to take place in Crypto where the money is still non Trackable or it is tax free.
Also in a world of War as i mentioned in previous Analysis too, more Buys and Sells are going to take place via Crypto instead of countries currency.
Some countries Now are buying and selling weapons from their enemies even and it is possible in Crypto which no one judge or find the transactions.
interesting things which can not all written here are now need Crypto more than ever.
These prices are like a joke and soon maybe with or without some stop loss hunting to the downside and kicking out buyers with leverage market of Crypto will face another Huge gain.
DISCLAIMER: ((trade based on your own decision))
<<press like👍 if you enjoy💚

GOLD → Correction for confirmation before growthFX:XAUUSD is recovering due to increased demand as a safe-haven asset. After breaking through local trend resistance, an upward channel is beginning to form on the chart.
On Monday, gold tested the 3295-3300 zone (liquidity zone) and, against the backdrop of incoming economic data, is buying back the decline, forming a rather interesting pattern that could lead to continued growth, but there is a but!
Investors are reacting to President Trump's threats to impose tariffs on imports from a dozen countries starting August 1. In addition, the main question is the Fed's interest rate decision. The regulator is likely to leave the rate unchanged due to inflation risks.
Uncertainty surrounding tariffs is supporting interest in gold as a safe-haven asset. The market is awaiting further news and the publication of the Fed minutes on Wednesday.
Resistance levels: 3345, 3357, 3396
Support levels: 3320, 3311, 3295
A correction to support is forming. If the bulls hold their ground within the upward channel and above the key areas of interest, the focus will shift to 3345, a resistance level that could hold the market back from a possible rise. A breakout of this zone would trigger a rise to 3357-3396.
Best regards, R. Linda!

NZDJPY - bulls are exhausted! Hello TradingView Family / Fellow Traders. This is Richard, also known as theSignalyst.
📈NZDJPY has been overall bullish trading within the rising flat channel marked in blue and it is currently retesting the upper bound of it.
Moreover, the green zone is a strong structure.
🏹 Thus, the highlighted red circle is a strong area to look for sell setups as it is the intersection of the upper blue trendline and green structure.
📚 As per my trading style:
As #NZDJPY is hovering around the red circle zone, I will be looking for bearish reversal setups (like a double top pattern, trendline break , and so on...)
📚 Always follow your trading plan regarding entry, risk management, and trade management.
Good luck!
All Strategies Are Good; If Managed Properly!
~Rich
Disclosure: I am part of Trade Nation's Influencer program and receive a monthly fee for using their TradingView charts in my analysis.

GOLD → Buyers are hesitant due to new tariffsFX:XAUUSD continues its correction phase after updating local highs and breaking through trend resistance. The dollar is making traders nervous...
After rising 2% last week, gold started Monday with a decline to $3,300 amid a stronger dollar due to the risk of new tariffs from Trump, who sent letters to 12 countries threatening to impose duties of up to 70% if no agreements are reached by July 9. This boosted demand for the dollar as a safe-haven asset.
Gold is also under pressure from strong US employment data, which has dampened expectations of a rate cut. The market is focused on news on tariffs and the publication of the Fed minutes on Wednesday, which may clarify the outlook for monetary policy.
Technically, the correction may end in the 0.7 Fibonacci zone, in the range of 3295-3300. After the formation of a reversal pattern, the market may strengthen to 3350-3360.
Resistance levels: 3315, 3344, 3358
Support levels: 3300, 3295
Locally, the price is trying to consolidate below the range, which could lead to a decline to 3300-3295. If, during the correction from support, the market manages to consolidate above 3315, we can expect growth. Otherwise, a weak reaction at 3295 could lead to a retest of 3275 and consolidation in the selling zone, which could lead to a further decline to 3245 .
BUT! We are closely monitoring the position of the US and Trump on tariffs, as he is once again issuing ultimatums to countries, to which the markets are reacting...
Best regards, R. Linda!

GBPUSD → Correction before the bullish trend continuesFX:GBPUSD is forming a trading range for consolidation of potential ahead of a possible continuation of growth as part of a countertrend correction.
The dollar is trying to recover from its decline due to a local change in the fundamental background, but the global trend for the DXY is bearish. This could provide support for the GBP to continue growing, provided that the bulls hold their defense above the 0.5 Fibonacci zone of the main impulse movement.
The market is holding GBPUSD within the trading range of 1.359 - 1.3675. The trend is bullish, and within the correction, liquidity may be captured from 1.359 before further growth.
Resistance levels: 1.3675, 1.3764
Support levels: 1.359, 1.3511
If the reaction to the subsequent retest of support at 1.359 is weak, we can consider a continuation of the correction to the 0.7-0.79 Fibonacci zone, which would be the most favorable entry point for us (focus on 1.3511 — a false breakout will increase interest in buying). In the current situation, the focus is on 1.359.
Best regards, R. Linda!

NZDUSD Wave Analysis – 7 July 2025
- NZDUSD reversed from resistance level 0.6100
- Likely to fall to support level 0.5950
NZDUSD currency pair recently reversed down from the key resistance level 0.6100 (which has been steadily reversing the price from October, as can be seen from the daily NZDUSD chart below) – intersecting with the upper daily Bollinger Band and the resistance trendline of the daily up channel from April.
The downward reversal from the resistance level 0.6100 stopped the previous medium-term impulse ABC correction (2) from the start of April.
Given the strength of the resistance level 0.6100, NZDUSD currency pair can be expected to fall to the next support level 0.5950.

EURAUD - Bearish... but not for long!Hello TradingView Family / Fellow Traders. This is Richard, also known as theSignalyst.
As per our last EURAUD analysis, attached on the chart, it rejected the upper bound of the blue channel and traded lower.
What's next?
📈EURAUD is now retesting the lower bound of the channel.
Moreover, the blue zone is a strong demand.
🏹 Thus, the highlighted blue circle is a strong area to look for buy setups as it is the intersection of the lower blue trendline and demand.
📚 As per my trading style:
As #EURAUD is around the blue circle zone, I will be looking for bullish reversal setups (like a double bottom pattern, trendline break , and so on...)
📚 Always follow your trading plan regarding entry, risk management, and trade management.
Good luck!
All Strategies Are Good; If Managed Properly!
~Rich
Disclosure: I am part of Trade Nation's Influencer program and receive a monthly fee for using their TradingView charts in my analysis.

CRUDE OIL (WTI): Move Up Ahead!
Last week, I already shared a bullish setup on WTI Crude Oil
on a daily time frame.
I see a strong intraday bullish confirmation today.
After a test of an underlined blue support area,
the price went up strongly and violated a resistance line
of a bullish flag pattern on a 4H time frame.
The market is going to rise more.
Goal - 68.2
❤️Please, support my work with like, thank you!❤️
I am part of Trade Nation's Influencer program and receive a monthly fee for using their TradingView charts in my analysis.

EUR/USD: UPDATEHello friends
Everything is clear on the chart for you, our probability is price growth until the specified areas.
In case of price decline, we have identified two support areas where you can buy.
Be sure to observe risk and capital management.
*Trade safely with us*

JTO : Price at a critical point: Falling or rising?Hello friends
Given the long-term range that this currency has made, the price has now reached the bottom of the range, which is very sensitive, and this currency also has a token release, which can be a warning.
In case of a drop, we have identified important supports for you, so that you can buy with risk and capital management.
*Trade safely with us*

GBPUSD UPDATE (NICE CHART)Hello friends
Given the failure of the pain and the strong growth of the price, you can see that the price is in correction, which is a good opportunity for safe purchases at the indicated support points, of course with capital and risk management...
*Trade safely with us*
