BTC with potential for $115,000/$120,000🔍 Market structure (Price Action)
📈 Trend:
The market previously formed higher highs (HH) and higher lows (HL) – a classic uptrend.
Then there was a correction and a lower high (LH) and lower low (LL) appeared – a potential change in the trend to a downtrend.
The last two lows are again HL (Higher Lows) – suggesting an attempt to return to the uptrend.
🔄 Key support and resistance levels
✅ Resistance (green horizontal lines):
117.469 – local resistance and potential breakout target from the current range.
115.802 – confirmed resistance from previous consolidations.
111.814 – strong local resistance (LH – Lower High formed there).
109.341 – current resistance, the price is currently testing it.
🛑 Support (red horizontal lines):
105.370 – local support, price reacted at this level in recent days.
102.650 – important support, level of previous HL.
100.095 – consolidation level before breaking out upwards.
98.213 – last LL – very important level in the context of defending the structure.
🧭 Structure of peaks and troughs
HH: Higher High – confirmed the previous uptrend.
LH: Lower High – first warning about changing the structure to down.
LL: Lower Low – confirmed a potential change to downside.
HL (x2): two more higher lows – suggest a possible return to growth.
📊 Stochastic RSI (at the bottom of the chart)
The oscillator is currently in the overbought zone (>80), approaching a downward crossover.
It suggests a possible short-term halt in growth or correction.
But in strong trends it may "stick" to the upper range.
📌 Potential scenarios:
🟢 Bullish:
If the price breaks above 109.341, it may test 111.814 and then 115.802.
Continuation of the HL → HH formation will confirm a trend reversal and further growth.
🔴 Bearish:
If the price does not stay above 109k and breaks below 105.370, there is a risk of a test of 102.650 and lower.
A break of 100.095 and especially 98.213 will negate the growth structure.
🧠 Conclusions:
The market is at a key decision point - HL formation vs. resistance zone.
Buyers' strength will be confirmed only after breaking 111-112k.
Stochastic RSI warns of potential pullback or consolidation.
Parallel Channel

Citigroup Wave Analysis – 2 July 2025
- Citigroup broke key resistance level 85.00
- Likely to rise to resistance level 90.00
Citigroup recently broke above the key resistance level 85.00 (former multi-month high from February, which stopped the previous wave (A), as can be seen below).
The breakout of the resistance level 85.00 accelerated the active minor impulse wave 5 of the intermediate impulse wave (C) from April.
Citigroup can be expected to rise further to the next resistance level 90.00 (intersecting with the daily up channel from April).

GOLD 4H: structure broken - phase reversal beginsTwo key directional signals were recorded on the gold chart: first, a breakdown of the ascending channel, followed by a confident downward exit from the triangle with a clear fixation under the $3297 boundary. Both figures worked independently, but consistently - and strengthened the impulse towards selling.
The price has already gone beyond the lower boundary of the triangle ($3297), confirming the bearish scenario. Candlesticks closing under the level and local consolidation from below is a characteristic formation before the momentum continues.
Technical parameters:
- Channel breakout: completed
- Triangle breakout: $3297 level
- Retest from below: expected as confirmation
- EMAs reversed downwards, structure broken
- Volumes strengthened at the moment of breakout
Tactical plan:
- Sell after retest of $3297
- Targets on the move: $3248 and $3201
- Stop: above $3305 (above the area of false outs).
The current structure indicates the end of the accumulation phase and the beginning of the downward momentum. As long as the price holds below $3297 - shorts are the priority.

SOLB | Descending Triangle Breakout – Targeting +34% MoveTicker: EURONEXT:SOLB (Solvay SA – Euronext Brussels)
📆 Timeframe: 4H (4-hour)
📉 Price: €31.58
📈 Pattern: Descending triangle breakout from horizontal support
📊 Breakout Probability : ~73% upward breakout (short-term triangle)
🔍 Technical Setup:
SOLB has successfully broken above a descending resistance line, bouncing off a solid horizontal support level near €28.00. This forms a bullish descending triangle breakout – a structure that historically resolves upward in short- to mid-term timeframes.
✅ Confirmed breakout from descending triangle
🟢 RSI pushing above 56 = bullish short-term momentum
📉 Defined support below = favorable risk/reward
🧠 Trade Plan:
📥 Entry Zone: €31.40–€31.70 (post-breakout confirmation)
⛔ Stop-Loss: Below €27.90 (under support base and triangle invalidation)
🎯 Upside Targets & ROIC (from €31.58):
Target Price Return
🎯 Target 1 €33.84 +7.15%
🎯 Target 2 €39.76 +25.9%
📊 Pattern Probability – Based on Bulkowski:
📐 Pattern: Descending Triangle (short-term breakout)
🔺 Upward breakout probability: ~73%
💹 Measured move confirms Target 2 if volume remains elevated
⚠️ Technical Signals to Watch:
🔎 Strong green candle breaking the triangle → initial confirmation
✅ RSI breakout with no bearish divergence = supports continuation
📈 Volume spike = buyer interest returning
💬 Solvay’s breakout is a classic textbook move off strong horizontal support.
This is a high-probability swing setup with tight risk and excellent upside potential.
#SOLB #BreakoutSetup #DescendingTriangle #TechnicalPattern #SwingTrade #TargetTraders

USDJPY: Strong Bullish Price Action 🇺🇸🇯🇵
I see 2 strong bullish confirmation on USDJPY after a test of a key daily
support cluster.
The price violated a trend line of a falling channel and a neckline of
an inverted head & shoulders pattern with one single strong bullish candle.
The pair may rise more and reach 144.45 level soon.
❤️Please, support my work with like, thank you!❤️
I am part of Trade Nation's Influencer program and receive a monthly fee for using their TradingView charts in my analysis.

DXY Long-Term Technical Outlook: Channel Structure, Pullbacks & ## **DXY (Dollar Index) Technical Analysis – 2W Chart**
### **1. Uptrend Since 2008**
The Dollar Index (DXY) has been in a **long-term uptrend** since the 2008 bottom (around 70.70). The chart shows a clear pattern of **higher highs and higher lows**, establishing a bullish market structure over the past 15+ years.
---
### **2. Ascending Channel**
The price has been moving consistently within a well-defined **ascending channel**. Several reactions from the channel boundaries are visible:
- **Support (lower trendline):** 2008, 2011, 2018, 2021, 2024
- **Resistance (upper trendline):** 2009, 2017, 2022
This suggests that the market is respecting the technical boundaries of the channel remarkably well.
---
### **3. Historical Pullbacks Within the Channel (13.5% – 15%)**
The chart highlights major **pullbacks** from local tops, all falling within the **-12.6% to -16.9%** range, showing high consistency:
| Year | Drop | % Decline |
|-------------|----------|----------------|
| 2009 | -14.76 | -16.47% |
| 2010 | -14.97 | -16.90% |
| 2017 | -15.17 | -14.61% |
| 2020 | -13.65 | -13.25% |
| 2022 | -14.90 | -12.98% |
| 2024/2025 | -13.90 | -12.61% |
This implies that **a retracement of 13–15%** from a local high is a historically "normal" correction within the ongoing uptrend.
---
### **4. EMA Analysis – 24, 120, 240** (2Y,5Y,10Y)
The chart includes three Exponential Moving Averages (EMAs), reflecting short-, medium-, and long-term trends:
- **EMA 24 (white line):** Reacts to short-term price action. Price is currently breaking below it, suggesting weakness in short-term momentum.
- **EMA 120 (red line):** Reflects the mid-term trend. Price is **right at the edge**, often acting as a **support level** in bullish markets.
- **EMA 240 (blue line):** Represents the long-term outlook. **Price has never stayed below this level for long** over the past 15 years, making this EMA a **critical support** for the long-term trend.
---
### **Conclusion & Potential Scenarios**
📉 **Bearish Scenario:**
If DXY breaks below the **EMA 240** and the **lower channel boundary**, it could indicate a **reversal of the long-term uptrend**, which hasn’t happened since 2008.
📈 **Bullish Scenario:**
If DXY holds above the **EMA 120** or bounces from the **EMA 240** and the **channel support**, we could expect a rally toward the **Fibonacci levels** (0.5 at 102.04 or 0.382 at 105.04), or even a retest of the highs around **114.78**.

AUDJPY - let's do it again!Hello TradingView Family / Fellow Traders. This is Richard, also known as theSignalyst.
As per our last AUDJPY analysis (attached on the chart), it rejected the first blue circle zone and surged in a parabolic manner.
📈AUDJPY is currently retesting the intersection of the blue trendline and red support.
📚 As per my trading style:
As #AUDJPY is around the latest blue circle zone, I will be looking for bullish reversal setups (like a double bottom pattern, trendline break , and so on...)
📚 Always follow your trading plan regarding entry, risk management, and trade management.
Good luck!
All Strategies Are Good; If Managed Properly!
~Rich
Disclosure: I am part of Trade Nation's Influencer program and receive a monthly fee for using their TradingView charts in my analysis.

US100Price broke daily resistance last week and now looks like a retracement is on the way. H4 gave a double top at the rising channel resistance. Pulling back to retest the neckline. target is 22,200.

Dow Jones Wave Analysis – 1 July 2025
- Dow Jones broke the resistance zone
- Likely to rise to resistance level 45000.00
Dow Jones index recently broke the resistance zone located at the intersection of the resistance level 44000.00 (former top of wave iv from March) and the resistance trendline of the daily up channel from May.
The breakout of this resistance zone accelerated the active impulse wave (3) – which is part of the multi-month upward ABC correction 2 from April.
Dow Jones index can be expected to rise to the next resistance level 45000.00 (target price for the completion of the active impulse wave (C)).

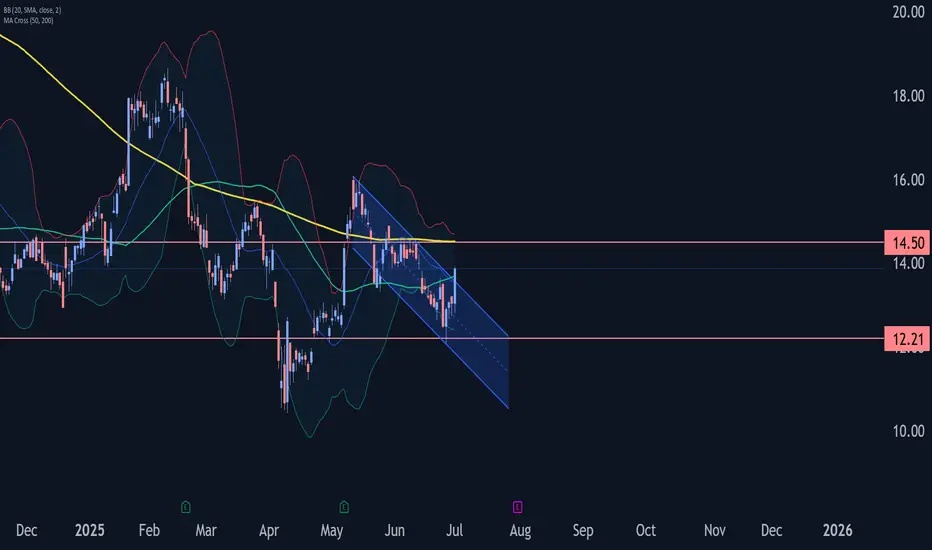
Trip Wave Analysis – 1 July 2025- Trip broke daily down channel
- Likely to rise to resistance level 14.50
Trip recently broke the resistance trendline of the daily down channel from the start of May (inside which the price has been falling in the last few weeks).
The breakout of this down channel accelerated the active short-term corrective wave (ii) – which is part of the downward impulse wave C from last month.
Trip can be expected to rise to the next resistance level 14.50 (which reversed the previous waves ii and (2) at the start of June).
STZ | Reversal Setup – 35-Year Channel Support + Falling WedgeTicker: NYSE:STZ (Constellation Brands Inc.)
📆 Timeframe: 1W (Weekly)
📉 Price: $166.74
📈 Pattern: Descending wedge + long-term parallel channel from 1989
📊 Pattern Breakout Probability: ~69% in favor of bullish reversal
🔍 Technical Setup:
STZ is currently testing the lower bound of a macro rising channel going back to 1989 — a level historically associated with major market bottoms. At the same time, price is compressing inside a descending wedge, a high-probability bullish reversal structure.
📊 According to historical chart pattern statistics, falling wedges break upward ~68% of the time, especially when accompanied by rising volume and multi-decade support.
🧠 Trade Thesis:
📥 Buy Zone: $160–$170
⛔ Stop-Loss: $150.79 (below wedge support, could be an increasing trailing stop)
📐 Probability of Upward Breakout: ~69%, based on classical pattern statistics
🎯 Upside Targets & ROIC (from $166.74):
Target Price Return
🎯 Target 1 $218 +31.2%
🎯 Target 2 $257 +54.2%
🎯 Target 3 $273 +63.8%
⚠️ Why This Setup Is Exceptional:
✅ 35-year rising channel support — rarely tested
✅ Descending wedge compression = bullish tension
✅ Volume spike and price rejection = signs of bottoming
✅ Statistically supported pattern → ~7 in 10 chance of breakout
💬 STZ combines deep technical structure with statistically supported probabilities.
This is the kind of trade setup where structure, price, and probabilities align.
#STZ #FallingWedge #ChartPatterns #SwingSetup #TechnicalBreakout #TargetTraders

BTCUSDT at Best Resistance !!This is the Daily chart of Bitcoin .
BTCUSDT is trading near it Resistance Zone 108,600 - 107,400.
If this level is sustain , then we may see lower prices in BTCUSDT.
Thank You !!

Bitcoin can turn around from seller zone and start to declineHello traders, I want share with you my opinion about Bitcoin. The price previously broke above the support line and made a strong bullish move from the buyer zone (99300–100500 points). After the breakout, the price started rising steadily and is now approaching the Seller Zone (108500–109500), which also coincides with the resistance line of the downward channel. This area has shown strong bearish pressure in the past. Every time the price entered this zone, it quickly reversed. It’s a key area where many traders seek short-term opportunities. Currently, price is just entering this zone again and showing early signs of weakening momentum. Given the channel's structure, past price behavior near this resistance level, and the presence of the seller zone, I expect BTCUSD to turn around soon. Once the price rejects this level, I anticipate a reversal and a move back into the channel, continuing the downward trajectory. My first target is set at 103000 points, near the center of the range and above the support level (100500). This area has been tested multiple times before and may act as a strong buffer again. Please share this idea with your friends and click Boost 🚀
Disclaimer: As part of ThinkMarkets’ Influencer Program, I am sponsored to share and publish their charts in my analysis.

GOLD → Retest of the resistance range. Correction?FX:XAUUSD is recovering amid expectations of lower interest rates in the US, and the falling dollar is also supporting the price of the metal.
The dollar remains under pressure due to political uncertainty in the US, budget concerns, and trade risks. However, strong stock market growth and possible tariff measures against Japan and the EU are also affecting the market, adding volatility to gold
Powell will speak at the ECB forum, and markets are waiting for him to hint at a rate cut. Currently, the probability of a cut in July is estimated at 20%, and in September at 77%. A dovish tone will support gold, while a hawkish tone will increase pressure.
Technically, since the opening of the session, gold has exhausted its daily range (ATR), and there is a fairly high probability that after strong growth, the price may be stopped in the 3347-3350 zone.
Resistance levels: 3347, 3350
Support levels: 3312, 3295
If gold cannot continue to rise after breaking through 3347 and the price returns to the resistance zone, then in this case, we can consider a correction to 0.5-0.7 Fibonacci before a possible continuation of growth.
Best regards, R. Linda!

EURGBP: Strong Bullish Confirmation 🇪🇺🇬🇧
EURGBP is going to continue rising in an uptrend
that the pair established at the end of May.
A completion of a consolidation and a formation of a new local Higher High
indicate a highly probable bullish continuation soon.
Next resistance - 0.8605
❤️Please, support my work with like, thank you!❤️
I am part of Trade Nation's Influencer program and receive a monthly fee for using their TradingView charts in my analysis.

GOLD → Recovery and retest of resistance. DowntrendFX:XAUUSD has been recovering since the start of the session thanks to a weak dollar, but further growth is uncertain. However, the price is still below the key range and important levels.
At the beginning of the week, gold rebounded from monthly lows amid a weakening US dollar, which remains under pressure due to trade disputes with Japan, uncertainty surrounding the budget, and expectations of a Fed rate cut in September.
However, the technical picture for gold remains bearish, and further dynamics will depend on new statements from Fed officials, labor market data, and Jerome Powell's speech on Tuesday.
Technically, after breaking through the global range support, the price is forming a correction and testing 3294. Before a possible rise to 3320 or to the 0.7 Fibonacci zone, a correction to 3271 may form, which will determine the further development of the situation.
Support levels: 3271, 3255, 3245
Resistance levels: 3294, 3320, 3347
A retest of 3295 (0.5) Fibonacci is forming. There is a possibility of a false breakout with a possible correction. If, during the correction, buyers keep the price above 3271 and return to retest 3294, we will have a chance to attempt growth to 3320 - 3347
Best regards, R. Linda!

BTCUSD parallel channel On the daily chart, BTCUDS is running in the parallel channel. The short-term market fell back after testing the upper resistance. At present, we can pay attention to the short-selling trading opportunities, and the downside target is around 98000. If the price breaks through the resistance near 108800, it will break the channel.

KULR | High-Growth Channel Reversal – Targets +298% to +2,368%📍 Ticker: AMEX:KULR (KULR Technology Group, Inc.)
📆 Timeframe: 1W (Weekly)
📉 Price: $7.11
📈 Pattern: Rising parallel channel with bullish consolidation
🔍 Technical Setup:
AMEX:KULR is respecting a clean ascending channel since early 2023 and is currently consolidating just above key support and the lower trendline, forming a launch base.
🔵 Key Resistance: $6.51 has flipped to support
📈 Price bounced from demand zone + holding mid-channel
📊 Volume profile supports accumulation at lows
🧠 Trade Plan & Dynamic Stop:
📥 Entry Zone: $6.80–$7.20
⛔ Trailing Stop: A few % below the lower rising trendline
→ Trail it dynamically as the channel rises (e.g. ~4–7% buffer under trendline)
🎯 Targets & ROIC:
🎯 Target 1: $9.45
→ Return: +31.3%
🎯 Target 2: $28.81
→ Return: +305.1%
🎯 Target 3 (Channel Top): $168.12
→ Return: +2,268%
⚠️ Key Technical Notes:
Bullish retest of major breakout zone ($6.50) is holding
Trendline structure is strong → perfect for trend-following strategy
Trailing stop method protects gains without prematurely exiting
Momentum expected to increase above $9.00
💬 Is KULR about to explode higher with the next growth leg?
Watch for confirmation above $9.50 for breakout acceleration.
#KULR #ChannelBreakout #SmallCapTech #ExplosiveSetup #TrendTrading #TargetTraders

This look promising for Crypto!The DXY breaking below its trend channel is a really positive sign for risk assets like Bitcoin and Altcoins. Usually, a weak dollar means more money flows into risk assets. The DXY's technical target is 89, which is the level to watch for the end of the crypto bull run.

USDCHF Wave Analysis – 30 June 2025
- USDCHF falling inside a minor impulse wave
- Likely to fall to support level 0.7900
USDCHF currency pair is falling strongly inside the minor impulse wave 3, which recently broke the daily down channel from the start of May.
The breakout of this down channel follows the earlier breakout of the key support level 0.8055 (which stopped the previous impulse waves (1) and i).
Given the strong daily downtrend and the continuous outflows from US dollar or risk-on mood, USDCHF currency pair can be expected to fall to the next support level 0.7900, the target price for the completion of the active impulse wave 3.

NZDUSD → Pre-breakout consolidation. One step away from a rallyFX:NZDUSD is consolidating, but the chart shows signs of readiness to shift to a distribution phase, which could lead to a rally.
Against the backdrop of a falling dollar, which is continuing its main trend, the NZD may break out of consolidation in a distribution pattern. Since the accumulation is quite large (taking into account the long squeeze), the trend may be strong.
A pre-breakout consolidation is forming relative to 0.6080, followed by the price breaking through the resistance of the global trading range. Consolidation above 0.6080 will confirm the breakdown of the structure, which could trigger distribution
Resistance levels: 0.6080, 0.612
Support levels: 0.6062, 0.604
The price may be supported by a bullish trend and a decline in the dollar. A breakout from the 4-month consolidation may be accompanied by a continuation of the uptrend until the intermediate high of 0.6355 is reached in the medium term.
Best regards, R. Linda!

SOLANA → BINANCE:SOLUSDT.P is consolidating after breaking through trend resistance. The market trigger is 148.0, and Bitcoin is provoking the market to recover...
The market is buying back all the losses. SOL breaks the local downward resistance and forms consolidation with a trigger of 148.0. The market has come to life following the rallying Bitcoin. If the general trend continues, SOL may break out of the accumulation zone and form a distribution towards 154.0
The latest retest of resistance is provoking a correction. Before rising, the price may test the zone of interest at 144 or the lower boundary of consolidation at 142.2. The ideal scenario would be a false breakdown of support at 142.2 before rising.
Resistance levels: 148.0, 154.2
Support levels: 142.2, 137.5
Fundamentally, the situation for the crypto market is improving. Technically, the market is also showing positive dynamics. SOL is consolidating after growth, which is generally a positive sign. Now we need to wait for the price to break out of consolidation and continue its growth. One of the signs of this is a rebound from the 0.5 range and a quick retest of resistance with a gradual squeeze towards the trigger.
Best regards, R. Linda!

Euro will make correction to support line of channelHello traders, I want share with you my opinion about Euro. In this chart, we can see how the price entered to triangle, where it at once bounced from the support line and rose to the 1.1100 support level, which coincided with the buyer zone. Soon, price broke this level, after a small correction, and continued to move up to the 1.1575 current support level, which coincided with the support area. This area also coincided with the resistance line of the triangle, and the Euro rebounded from this line and started to decline. In a short time, it declined to the buyer zone, where it turned around and started to move up. Soon, Euro exited from triangle and continued to rise inside an upward channel, where it made a correction first and then continued to grow. Later, EUR rose to 1.1575 current support level, one more time and even almost broke it, but failed and corrected. But soon, it finally broke this level and rose to the resistance line of the channel, where at the moment it continues to trade near. In my mind, Euro will rebound from this line and go to the correction until to support line of the channel, breaking the support level. For this case, my TP is located near this line - at the 1.1490 points. Please share this idea with your friends and click Boost 🚀
Disclaimer: As part of ThinkMarkets’ Influencer Program, I am sponsored to share and publish their charts in my analysis.
