Ethereum Leveling Map — ETH/USDT 1DNo directional bias for Ethereum, but will use levels to spot entries for intraday.
Right now located at POC and seems balanced for both sides.
Potential Adam&Eve setup in development.
Quality levels for support $2150, 2000, 1800, 1500.
Resistances $2700, 3000, 3500, 4000
Keep in mind it will follow BTC price action by most of time.
Happy trading
Parallel Channel

NATURAL GAS (NATGASUSD): Bullish Outlook Explained
Natural Gas is trading in a mid-term bullish trend on a daily.
The price updates higher highs and higher lows after each
test of a rising support line.
Its last test made the market form a strong rejection first
and a bullish engulfing candle then.
The market may continue growing and reach at least 3.7 resistance soon.
❤️Please, support my work with like, thank you!❤️

ALUMINIUM Futures at Best Support !!This is the 1 hour chart of Aluminium futures.
Aluminium is moving in well defined ascending parallel channel with Support at 245 level .
If this level is sustain , then we may see higher prices in the Aluminium Futures.
Thank you !!

TITAN ' s Key Point | Breakout | Swing.This is the 4 hour Chart of the TITAN COMPANY.
Titan has formed a Cup and Handle pattern and given a breakout .
Two possible scenarios:
If the breakout sustains with volume, the rally may continue.
If it retests the breakout level, it would offer a safer entry before the next leg up.
If this level is sustain then we may see higher prices in Titan.

Gold may bounce up from support line of channel to 3330 pointsHello traders, I want share with you my opinion about Gold. Previously, the price broke out of a symmetrical triangle and moved confidently toward the seller zone. However, it failed to consolidate there and formed a downward channel, where price action has remained since. The movement inside this channel has been consistent, respecting both the resistance and support lines. After reaching the lower boundary, the price bounced up and approached the resistance area (3290 - 3300), which now acts as a key short-term obstacle. This zone was tested multiple times and served as support earlier, making it a strong technical level. Currently, the price is trading just below this zone and forming a base for the next move. I expect a possible retest of the support line of the downward channel, which may provide the impulse needed for a new upward move. In my opinion, the price will rebound from the bottom of the channel and start to grow toward the current resistance level at 3300. If this level is broken and confirmed via a retest, I expect continued movement toward the channel’s upper resistance line. That’s why I set my TP 1 at 3330 points, right near the resistance line of the channel. Please share this idea with your friends and click Boost 🚀
Disclaimer: As part of ThinkMarkets’ Influencer Program, I am sponsored to share and publish their charts in my analysis.

RAIN INDUSTRIES ' s Key Support Zone This is the one hour chart of RAIN INDUSTRIES.
Rain Industries is moving within an ascending parallel channel with support around 140 range and resistance around 160 range.
If this level is sustain , then we may see higher prices in the
Rain Industries
Thank You !!

EURGBP: Bullish Move Ahead! 🇪🇺🇬🇧
EURGBP violated a consolidation range on Friday.
It is an important sign of strength of the buyers and I expect a bullish continuation
next week.
Goal - 0.856
❤️Please, support my work with like, thank you!❤️
I am part of Trade Nation's Influencer program and receive a monthly fee for using their TradingView charts in my analysis.

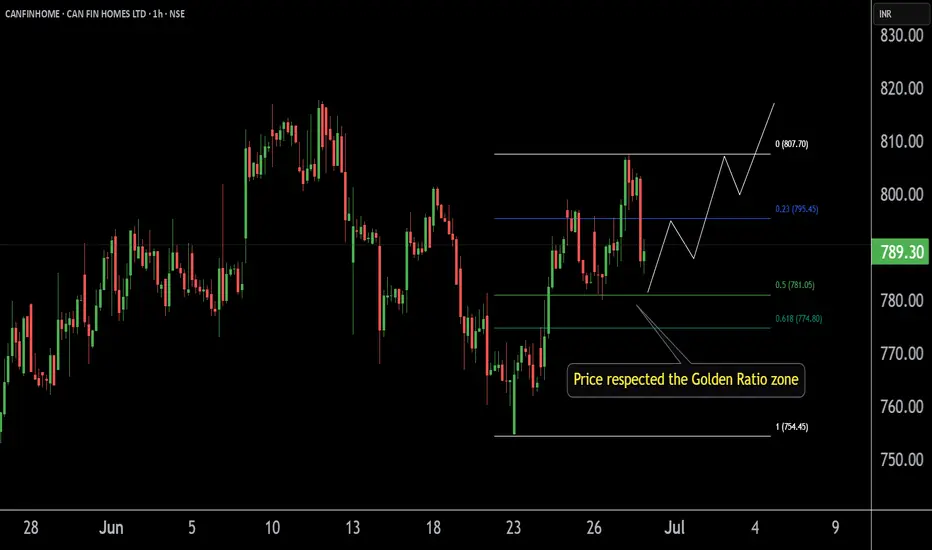
CANFINHOME'S Key ZoneThis is the 1 hour chart of CANFINHOME.
Canfinhome is taking support at the Fibonacci Golden Ratio zone.
If this zone is sustain then we may higher price in CANFINHOME .
Thank You !!
GOLD → Local bearish trend. Retest of support.FX:XAUUSD is technically looking a little weak. Support is being retested amid de-escalation of geopolitical conflicts in the Middle East. Interest in the metal is waning.
On Friday, gold remains under pressure ahead of data on the core PCE index, a key inflation indicator for the Fed. If inflation turns out to be higher than expected, this could strengthen expectations of a rate cut as early as July, supporting gold. The probability of a July cut is currently estimated at 21%, and 75% for September. Amid dollar volatility caused by rumors of a possible Fed chair replacement and trade negotiations with the EU and China, traders remain cautious, awaiting clarity on inflation and monetary policy
Technically, before falling, gold may form a correction to 3320 (liquidity capture).
Resistance levels: 3320, 3336, 3347
Support levels: 3293, 3271
If the fundamental background remains unchanged and gold continues to decline towards support at 3293 and break through this level, the breakout could lead to a fall to 3271. However, I do not rule out the possibility that after a sharp decline, a correction to 3320 could form before the fall.
Best regards, R. Linda!

USDCHF → Hunting for liquidity before the fallFX:USDCHF , against the backdrop of the falling dollar and the exit from consolidation, is forming another ‘bos’, which only confirms the market sentiment.
The fall of the dollar only increases pressure on the currency pair. The price has broken out of consolidation and is trading below the key level. USDCHF has broken through a fairly strong support level, which only confirms the bearish market structure. A correction is forming ahead of a possible decline (liquidity capture).
Resistance levels: 0.803, 0.8042
Support levels: 0.798, 0.79
Fundamentally and technically, the currency pair looks weak. The decline may continue after the liquidity capture phase and a retest of resistance. A false breakout of resistance will be a strong signal.
Best regards, R. Linda!

EURUSD Technical Breakdown | Bearish Reversal Ahead?The Euro is showing signs of a potential major trend reversal after completing a strong rally within an ascending channel.
🔎 Chart Analysis:
Price surged out of a long consolidation range and followed a parabolic curve.
The pair reached the upper boundary of the ascending channel and started stalling.
Early signs of a distribution phase are visible, hinting at possible downside momentum.
📉 Bearish Scenario In Play:
A break below 1.1600 could accelerate the sell-off.
Key support zone at 1.14526 — potential first reaction level.
If momentum continues, next major support rests at 1.12329.
Short-Term Outlook:
Watch for breakdown confirmation below the channel.
Risk management is key; consider short entries on bearish candle confirmation.
💬 What’s your view? Are the bears finally taking over EUR/USD? Drop your thoughts below! 👇
#EURUSD #Forex #TechnicalAnalysis #PriceAction

Bitcoin may reach resistance level and then start to declineHello traders, I want share with you my opinion about Bitcoin. Previously, the price was trading inside a well-defined downward channel, repeatedly rebounding from both the support and resistance lines. Each upward move got rejected within the seller zone, especially around the 108500 - 109200 range, which acted as a strong barrier multiple times. Later, BTC dropped to the buyer zone near 102700 - 102000, and from there, we saw a strong impulse up. This impulse broke through the channel resistance line and the support area, indicating a short-term bullish breakout. At the moment, the price is approaching the resistance level at 108500, which previously served as a turning point. Given that this area also aligns with the upper boundary of the seller zone, I believe we may see another reversal from this level. In my opinion, after reaching resistance, BTC may start a new downward wave, targeting the 102700 support level. This is where I’ve set my TP 1. Considering the recent breakout, the historical significance of the resistance, and the strong reaction from seller zones, I remain bearish in the short term and expect a potential decline toward support. Please share this idea with your friends and click Boost 🚀
Disclaimer: As part of ThinkMarkets’ Influencer Program, I am sponsored to share and publish their charts in my analysis.

$META - channel breakout and test of all time highs incomingMETA - Stock breaking out of the channel on the daily time frame. Stock is approaching all time highs at $739.68. We might see a possible retest those levels very soon. calls above $727 looking good.

XRP UG-ah-LYXRP has been slowly chopping lower in a mess of overlapping candles. Lower highs and lower lows at the Highest degree. The trend is down and the Elliott Is ugly.
There is a chance here for the trend to shift, but that low needs to hold.
In Elliott Wave, ugly can be useful. An ugly pattern often screams correction. That is the working assumption right now. This structure could still be a complex wave four.
Even though the wave count has not been crystal clear, I am not flying blind. I am using support and resistance to track the structure and wait for clarity.
Here are the levels that matter right now:
3.4005 was the major high
3.0257 and 2.2762 are key reaction zones
2.6510 is the median and the first major line bulls need to beat
1.9736 is the old high that price continues to bounce from
1.9015 and 1.5267 are the potential downside reaction zones if the yellow path unfolds
If this is a correction, there is still potential to hold above 1.62 and send. If that level goes, the structure shifts fast to lower targets.
This is not the time to get brave without confirmation, mo.
Ugly price action can still resolve cleanly. But I want to see an impulsive move through one of these levels, followed by a corrective return to that level. That would offer a more ideal continuation in whichever direction price decides.
Let the level reactions speak first. I will act after.

Another visit to $95,000 for Bitcoin?Looking at the price action of Bitcoin it appears to be moving in a descending channel formation. Usually this results in one of two outcomes. Either it breaks out, or it doesn't. And if it doesn't then it's most likely back down to the lows of the channel.

GOLD → Within range. Retest resistance at 3347FX:XAUUSD continues to correct after a false breakdown of support at 3300. Due to uncertainty, the price may remain in the range of 3300-3340 for some time.
Gold is fluctuating amid a weak dollar and uncertainty over Fed rates. Gold is struggling to hold on after rebounding from weekly lows, despite the US dollar falling to multi-year lows. Pressure on the dollar has intensified due to Trump's criticism of the Fed and rumors of a possible replacement for Powell. However, gold is limited in its growth due to a pause in geopolitical tensions and hawkish signals from the Fed chair. Investors are awaiting key macro data from the US (e 12:30 GMT Durable goods orders, GDP, Initial Jobless Claims) and especially the PCE inflation report on Friday.
Technically, the focus is on key areas of interest: 3300, 3306, 3340, 3347. Until strong news emerges, an intraday trading strategy should be considered.
Resistance levels: 3347, 3357
Support levels: 3320, 3307, 3300
Technically, a false breakout of resistance at 3347 and a retest of the local liquidity zone at 3320-3307 are possible before growth continues for the reasons mentioned above. Targets could be 3347, 3364, 3372, and 3396.
Best regards, R. Linda!

GBPUSD → Pre-breakout consolidation. One step away from a rallyFX:GBPUSD is trading in consolidation. Against the backdrop of the falling dollar index, the currency pair is testing resistance at 1.3632 but is not yet ready to bounce down.
Against the backdrop of the dollar's decline due to fundamental reasons, the GBPUSD currency pair is strengthening. Technically, this could lead to the price breaking out of consolidation upwards. A pre-breakout base is forming relative to the upper boundary of consolidation. The price is compressing towards the level, volatility is decreasing, which in general could lead to a breakout of resistance - trigger 1.3632. The exit from consolidation may be accompanied by distribution. The liquidity zone with W1 can be considered as a target.
Resistance levels: 1.3632, 1.3743
Support levels: 1.3593, 1.3508
The global and local trends are bullish. After growth, consolidation is forming. Against the backdrop of the falling dollar, GBPUSD is testing resistance. The reaction to the false breakout of resistance is weak. The chances of a breakout are quite high.
Best regards, R. Linda!

Euro may start to decline to support line of upward channelHello traders, I want share with you my opinion about Euro. Earlier, the price was trading inside a downward wedge, gradually making lower highs and lower lows. After reaching the bottom of the wedge near the buyer zone (1.1210 - 1.1180), we saw a strong bullish impulse that broke through both the resistance line of the wedge and the support area near 1.1450 - 1.1485. This breakout signaled the beginning of a new phase - a transition into an Upward Channel. Since then, the price has been forming higher highs and higher lows, respecting both the upper and lower boundaries of this new structure. Along the way, it has rebounded from the support line multiple times and recently made a strong move up toward the resistance line of the channel. Currently, the price is approaching that resistance line, which may act as a potential reversal area. Given the previous price behavior and the clearly defined channel, I expect the price to reach the top boundary and then start to decline toward the lower support line. That’s why I’ve set my TP 1 at 1.1555 points, which aligns perfectly with the support line of the upward channel. Based on the recent breakout, the structure of the trend, and the reaction from key zones, I remain short-biased for the upcoming sessions. Please share this idea with your friends and click Boost 🚀
Disclaimer: As part of ThinkMarkets’ Influencer Program, I am sponsored to share and publish their charts in my analysis.

GBPUSD Hits Channel Highs – Watch for Exhaustion or BreakoutGBPUSD continues its impressive rally, tapping into the upper boundary of a clean ascending channel across the 1D and 4H timeframes.
🔹 Daily:
Structure remains bullish with price pressing into long-term channel resistance near 1.3765. This is a key inflection point — bulls may need fresh momentum to break above.
🔹 4H:
Sharp impulsive move has stretched to the upside channel line. RSI likely overextended. Look for signs of exhaustion or bearish divergence here.
🔹 1H / 23m:
Lower timeframes show aggressive bullish control, but price is stalling near the highs. If we break structure or reject this zone, we could see a correction toward 1.3660 or deeper.
📉 If rejection occurs here, short opportunities may present toward mid-range or trendline support.
📈 If we break and close above 1.3780 with volume, continuation toward 1.3850 becomes likely.
💡Key Levels:
• Resistance: 1.3780, 1.3850
• Support: 1.3660, 1.3600


EURUSD Wave Analysis – 25 June 2025
- EURUSD broke resistance level 1.1575
- Likely to rise to resistance level 1.1800
EURUSD currency pair recently broke the resistance level 1.1575 , which is the former monthly high from the middle of April.
The breakout of the resistance level 1.1575 continues the active short-term impulse wave 3 of the intermediate impulse wave (3) from the start of May.
Given the strong daily uptrend, EURUSD currency pair can be expected to rise to the next resistance level 1.1800, which intersects with the daily up channel from May.

There is a possibility of a decline and a return to the channelIn compressed channels
The price can hardly pass it
Therefore, the downward trend is expected to continue
In this time form.
The details of the deal have been specified.
good luck. BLACKBULL:US30 BLACKBULL:US30

GOLD → Attempt to buy back the fall. Uncertainty factorFX:XAUUSD is falling within our expectations. After breaking through the trigger-level of 3340, the price fell to the liquidity zone of 3306. There is uncertainty in the market...
Gold is rising after a false break of support at 3300-3306, interrupting a three-day decline amid a weakening dollar and ongoing tensions in the Middle East. Investors are cautious due to the unstable truce between Iran and Israel, while the decline in USD/JPY after the Bank of Japan's statements and the rise in PPI in Japan are further supporting demand for gold. Powell's comments on the need for caution in monetary policy only temporarily strengthened the dollar. Now the market is focused on US housing data and the second day of Powell's speech
Technically, the price may consolidate at 3306-3347 for some time and only then show us (against the backdrop of the fundamental sentiment that has formed) which direction it will then take
Resistance levels: 3347, 3364, 3372
Support levels: 3319, 3307
The market is trying to buy back the decline. Tuesday's daily session closed with a long shadow, indicating interest in this price range. A pullback to 3320-3310 is possible before growth to 3340-3347.
Best regards, R. Linda!
