IBM Wave Analysis – 11 June 2025
- IBM broke key resistance level 270.00
- Likely to rise to the resistance level 290.00
IBM broke above the key resistance level 270.00 (which stopped the previous impulse wave (1) in the middle of May).
The breakout the resistance level 270.00 accelerated the minor impulse wave 3 of the intermediate impulse wave (3) from the end of May.
IBM can be expected to rise to the next resistance level 290.00 (target for the completion of the active impulse wave 3).
Parallel Channel

ENA About to Explode or Dump? Key Levels You Can’t Ignore!Yello Paradisers — are you positioned right for the next potential explosion in #ENA, or will you get caught on the wrong side of the move like most retail traders? After a brutal grind in a descending channel, something big is brewing... and it’s coming faster than many realize. Let's dive in.
💎#ENAUSDT currently facing a key resistance at the upper boundary of the descending channel, clearly tested multiple times and respected well by the market structure. A candle close above this channel would trigger a confirmed breakout, which opens up a clean path for continued upside movement — the next major target sits at the resistance zone between 0.446 and 0.4725.
💎There’s a high-probability alternative setup unfolding as well: ENA holding the S/R level around 0.3448 and the demand zone below, which aligns perfectly with the multi-timeframe EMA support. If this area holds strong, expect another impulse move toward our resistance zone as momentum builds.
💎Price had been forming lower highs and lower lows, respecting the downtrend But recently we observed a Clear Change of Character (ChoCH) — ENA broke market structure by forming a higher high.What usually follows? A higher low, and that’s where we are now.
💎The most probable scenario is for price to pull back to the S/R level or dip into the demand zone, and then form a higher low before making the next leg upward toward resistance.
💎Invalidation is simple and must be respected: if we see a confirmed candle close below 0.2798, then the bullish case breaks and the setup is no longer valid. This is where you must cut quickly, avoid hope-trading, and reassess the structure from scratch.
Don’t chase. Don’t panic. React with strategy, not emotion. This is how real professionals win in crypto. Stay sharp, Paradisers.
MyCryptoParadise
iFeel the success🌴

AES | Bounce in Motion from Multi-Decade Support – 75% Upside 📍 Ticker: NYSE:AES (AES Corporation)
📆 Timeframe: 1M (Monthly)
📉 Price: $11.48
📊 Volume: 109.4M
📈 RSI: 40.20 (Oversold rebound zone)
🔍 Technical Setup:
NYSE:AES has just bounced from the lower boundary of a 30-year ascending parallel channel, a zone that has historically marked major long-term bottoms.
🟢 Green arrow: Rebound from long-term trendline support
📏 Targeting reversion to the channel median
🔹 Pattern context: Mean-reversion strategy inside macro uptrend
🧠 Trade Plan & Price Target:
✅ Entry Zone: $11.00–$11.50
❌ Stop-Loss: Close below $9.50 (channel structure breakdown)
🎯 Target: $20.00
→ 📈 Return: +75.6% from current levels
⚠️ Key Insights:
RSI near historical bounce zone (40)
Major volume surge may signal capitulation
AES is historically cyclical within this macro structure — mean reversion is likely
Short interest elevated — potential for short-covering rally
💬 Will AES power a multi-quarter reversal like it did in 2002, 2009, and 2020?
📈 Add it to your radar if you’re watching for long-cycle rebounds.
#AES #MeanReversion #LongTermChannel #Utilities #ValueTrade #TargetTraders

PRMB | Breakdown in Progress – Setting Up for a 200% Swing Buy📍 Ticker: NYSE:PRMB (Primo Brands Corporation)
📆 Timeframe: 1W (Weekly)
📉 Price: $28.84
📊 Volume: 32.38M
📈 RSI: 40.95 (Bearish momentum, nearing bounce zone)
🔍 Technical Setup:
PRMB has broken below a steep sub-channel and is targeting the midline and base of a broader long-term ascending channel, offering a high-reward opportunity for medium-term traders.
📉 Short-term trend: Bearish correction
📈 Long-term trend: Still intact within rising channel
📍 Support zone: $20.70 – multi-year horizontal + lower channel convergence
📊 RSI: Oversold territory, potential for bullish divergence
🧠 Trade Plan & Price Targets:
📥 Wait for price to hit $20.70–21.00 zone (major confluence zone)
✅ Entry Range: $21.00–$22.00
❌ Stop-Loss: Below $19.00 (channel breakdown invalidation)
🎯 Target 1: $35.00
→ 📈 Return: +64.8%
🎯 Target 2: $72.00
→ 📈 Return: +229.3%
⚠️ Key Insights:
Volume spikes during selloff = panic selling, possible capitulation
RSI forming base near 40 → reversal often begins here historically
Macro trend channel still fully intact — just correcting within range
Steep reward potential if entry is timed at support
💬 Will PRMB complete the retest and deliver a massive swing?
🎯 Precision setups like this don't come often — add it to your watchlist now.
#PRMB #ChannelTrading #SwingSetup #LongTermReversal #HighReward #TechnicalSetup #TargetTraders

ADM | Inverse Head & Shoulders + Parallel Channel = Reversal📍 Ticker: NYSE:ADM (Archer-Daniels-Midland Company)
📆 Timeframe: 1D (Daily)
📉 Price: $48.74
📊 Volume: 2.82M
📈 RSI: 54.80 (Momentum building)
🔍 Technical Setup:
NYSE:ADM is completing a textbook Inverse Head & Shoulders at the bottom of a rising channel, hinting at a structural reversal.
🟢 Green arrow signals current buying opportunity
🔺 Red arrows highlight expected resistance zones on the way up
🟣 Channel provides a clean roadmap for a stair-step recovery structure
Pattern Highlights:
Well-defined L–H–R shoulders
Price reclaiming the midline of the channel
RSI recovering above 50, signaling shift in momentum
🧠 Trade Plan & Price Targets:
✅ Entry Range: $48.50–$49.00
❌ Stop-Loss: Close below $46.00 (invalidation of channel + pattern)
🎯 Target 1: $52.50
→ 📈 Return: +7.7%
🎯 Target 2: $56.50
→ 📈 Return: +15.9%
🎯 Target 3: $63.00
→ 📈 Return: +29.3%
⚠️ Technical Notes:
Pattern is visible across multiple timeframes — weekly structure aligns with daily bullish reversal
RSI breakout + neckline test = potential breakout confirmation
Earnings volatility in rear-view mirror – momentum favored near-term
💬 Is ADM finally turning the corner after months of weakness?
📌 Like & Follow for more structured swing setups!
#TargetTraders #ADM #HeadAndShoulders #ChannelBreakout #SwingTrade #InverseHnS #TechnicalSetup

HE | Inverse Head & Shoulders Breakout Setup / target +13%-56%📈 Ticker: NYSE:HE (Hawaiian Electric Industries)
📆 Timeframe: 1D (Daily)
📉 Price: $10.59
📊 Volume: 1.23M
📈 RSI: 50.96 (Neutral, ready for breakout)
🔍 Technical Setup:
A classic Inverse Head & Shoulders has formed just above the lower boundary of a multi-month parallel ascending channel.
🟩 Key Features:
Symmetrical reversal structure (L–H–R Shoulders)
Horizontal neckline around $12.00
Trading just above channel midpoint with supportive RSI action
🟢 Green arrow marks support near $10.50
🔴 Red arrows signal likely resistance areas
🧠 Trade Plan & Price Targets:
✅ Entry Zone: $10.50–$10.70
❌ Stop-Loss: Below $9.90 (channel breakdown + structure failure)
🎯 Target 1: $12.00
→ 📈 Return: +13.3%
🎯 Target 2: $13.80
→ 📈 Return: +30.3%
🎯 Target 3: $16.50 (upper channel resistance)
→ 📈 Return: +55.8%
⚠️ Technical Notes:
RSI at 51 – neutral zone, ready to build momentum
Volume declining — watch for breakout surge above $11.50
Channel provides structure for swing trades and scaling
💬 Is HE about to energize a trend reversal or flicker out?
📌 Comment your thoughts and follow for more high-conviction setups!
#TargetTraders #HE #Utilities #InverseHnS #BreakoutTrade #SwingTrading #TechnicalAnalysis

Bitcoin will rise from support level and exit from wedgeHello traders, I want share with you my opinion about Bitcoin. This chart shows how the price rebounded from the current support level and then turned around and rebounded up. Price broke the 109000 level, coinciding with a support area, and then traded near this level for some time. Later price turned around and started to decline inside a downward channel, where it soon broke the 109000 level, reached the resistance line, and continued to fall next. Bitcoin fell to the support line of the channel, which coincided with the 103000 support level and buyer zone, after which it rebounded up. Then BTC exited from channel and later entered to upward wedge, where it at once made a correction movement from the resistance line to the support line, breaking the 103000 level. But soon, price made an impulse up, breaking the support level one more time. Next, it rose to the current support level, broke it too, and now trades inside the support area. In my mind, BTC can rebound from the support level and rise to the resistance line of the wedge. Then it can break this line, thereby exiting from the wedge and continuing to move up; therefore, I set my TP at 112000 points. Please share this idea with your friends and click Boost 🚀

EURJPY Wave Analysis – 11 June 2025- EURJPY broke the key resistance level 165.00
- Likely to rise to the resistance level 168.00
EURJPY currency pair recently broke the key resistance level 165.00 (which has been steadily reversing the pair from the start of November, as can be seen from the daily EURJPY chart below).
The breakout of the resistance level at 165.00 accelerated the active sub-impulse wave 3 of the higher-order impulse wave (C) from April.
EURJPY currency pair can be expected to rise to the next resistance level 166.50 (former multi-month high from November) – the breakout of which can lead to further gains toward 168.00.

Boeing (BA): Watching for a Break Above 218.80NYSE:BA has a strong chance of breaking above the 218.80 level , with a potential move toward 221.98 .
I plan to enter 1 tick above 218.80, with a stop-loss based on the 5-minute ATR (period 10).
🔍 Technical Outlook:
BA is currently moving within an upward ABCD channel. The projected upside is capped by a strong resistance zone at 221.98 – a level derived from the daily chart and previous price action. The market may or may not react to it, but it’s a logical target within a solid risk-to-reward setup.
One aspect I particularly like about this setup is the market’s inability to close significantly below the previous pivot high at 215.80. This suggests underlying strength. If we see a confident move above resistance, the trade could be triggered with momentum.

AUDCHF: Completed Consolidation 🇦🇺🇨🇭
AUDCHF completed a consolidation within a horizontal range
on a daily, breaking and closing above its resistance.
I believe that the pair may rise more and reach a historically
significant falling trend line.
Goal - 0.5386
❤️Please, support my work with like, thank you!❤️
I am part of Trade Nation's Influencer program and receive a monthly fee for using their TradingView charts in my analysis.

GBPUSD → Countertrend retest of support before growthFX:GBPUSD is forming a countertrend correction to the zone of interest and liquidity while the dollar is stagnating. The market is waiting for a fundamental driver.
Within the uptrend, a countertrend correction is forming towards the liquidity zone at 1.342. Against this backdrop, the dollar is correcting and contracting towards support. The currency pair's price continues to decline, but within the uptrend, breaking the local structure but not the market character. The focus is on the current trading range of 1.342 - 1.359. A retest of support could bring the price back to resistance.
Support levels: 1.3421, 1.339
Resistance levels: 1.3507, 1.3593
A quick retest of the liquidity zone at 1.3421, the inability of GBPUSD to continue falling, a false breakdown, and the price consolidating above 1.3421 would be a good indication that buyers are trying to hold the market. In this case, we could see the price strengthen.
Best regards, R. Linda!

ETH - Finally Support!Hello TradingView Family / Fellow Traders. This is Richard, also known as theSignalyst.
📈ETH has been overall bullish trading within the flat rising channels marked in blue.
Moreover, the green zone is a strong support zone!
🏹 Thus, the highlighted blue circle is a strong area to look for buy setups as it is the intersection of support and lower blue trendlines acting as non-horizontal support.
📚 As per my trading style:
As #ETH approaches the blue circle zone, I will be looking for bullish reversal setups (like a double bottom pattern, trendline break , and so on...)
📚 Always follow your trading plan regarding entry, risk management, and trade management.
Good luck!
All Strategies Are Good; If Managed Properly!
~Rich

Filecoin Wave Analysis – 10 June 2025
- Filecoin reversed from strong support level 2.25
- Likely to rise to resistance level 2.875
Filecoin cryptocurrency recently reversed up from the strong support level 2.25 (which has been reversing the price from the start of April).
The support level 2.25 was further strengthened by the lower daily Bollinger Band and by the support trendline of the daily down channel from the middle of May.
Filecoin cryptocurrency can be expected to rise to the next resistance level 2.875 (top of the minor correction ii from the end of May).

Chainlink Wave Analysis – 10 June 2025- Chainlink broke daily down channel
- Likely to rise to resistance level 16.00
Chainlink recently broke the resistance trendline of the daily down channel from the start of May (which encloses the previous minor ABC correction 2).
The breakout of this down channel accelerated the active impulse wave 3, which started earlier from the key support level 13.00.
Chainlink can be expected to rise to the next resistance level 16.00 (top of the minor correction ii from the end of May).

MarketBreakdown | EURUSD, AUDUSD, USDCHF, EURCAD
Here are the updates & outlook for multiple instruments in my watch list.
1️⃣ #EURUSD daily time frame 🇪🇺🇺🇸
Though the pair remains quite weak for the last few days,
I strongly believe that bulls have unrealized potential.
The pair may continue rising and reach the underlined yellow resistance soon.
2️⃣ #AUDUSD daily time frame 🇦🇺🇺🇸
The price is testing a significant horizontal resistance.
Its bullish breakout will provide a strong bullish signal.
The pair will go way higher then.
3️⃣ #USDCHF daily time frame 🇺🇸🇨🇭
The price is stuck within a narrow consolidation range.
I think that a sideways movement is going to continue
and the price will drop to the support of the range soon.
4️⃣ #EURCAD daily time frame 🇪🇺🇨🇦
The price action is contracting within a symmetrical triangle pattern.
Such a pattern signifies a deep indecision.
A breakout of one of its boundaries will indicate the side of the next market move.
Do you agree with my market breakdown?
❤️Please, support my work with like, thank you!❤️
I am part of Trade Nation's Influencer program and receive a monthly fee for using their TradingView charts in my analysis.

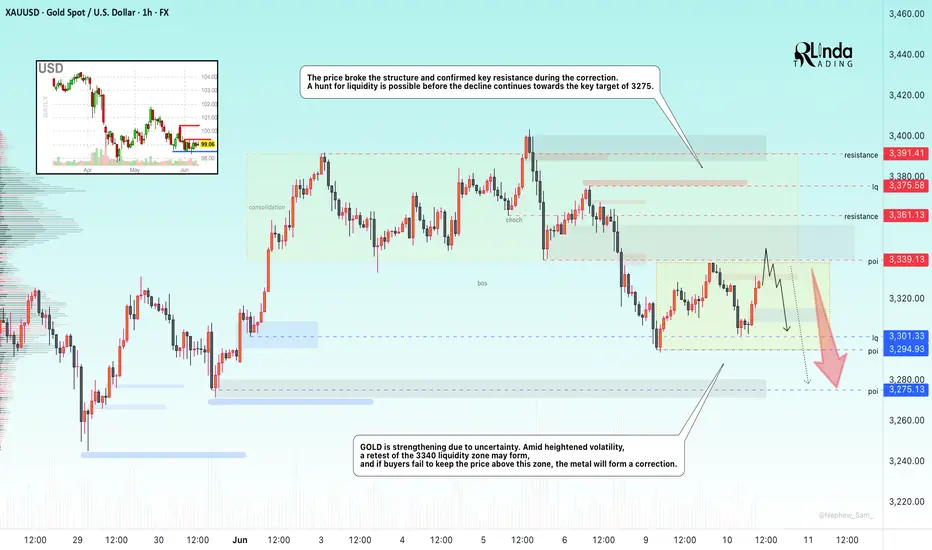
GOLD → Hunt for liquidity ahead of continued correctionFX:XAUUSD is strengthening due to uncertainty while the dollar consolidates. Amid heightened volatility, a retest of the 3340 liquidity zone may form, and if buyers fail to keep the price above this zone, gold may form a correction
Demand for the dollar is supported by the rise in USD/JPY after soft comments on interest rates by Bank of Japan Governor Ueda. Gold is responding with a correction. Traders remain cautious ahead of the outcome of the second day of trade talks between the US and China in London. Donald Trump confirmed that dialogue with Beijing is continuing, but key differences remain. Investors are also awaiting US inflation data (CPI), which could determine the further dynamics of the dollar and gold. Meanwhile, inflation expectations in the US fell from 3.6% to 3.2% in May.
Technically, gold broke the structure and confirmed key resistance during the correction. A hunt for liquidity is possible before the decline continues towards the key target of 3275.
Resistance levels: 3340, 3361
Support levels: 3301, 3275
The price is forming a new trading range of 3340 - 3301 (3294). Before declining, especially if the fundamental background changes to positive as negotiations progress, gold may test the liquidity zone of 3340 and form a false breakout, which will trigger a continuation of the correction to 3275.
Best regards, R. Linda!
GOLD → Correction before a decline or continuation of the trend?FX:XAUUSD is testing the liquidity zone during the Asian session and forming a false breakout. The metal is recovering, but the fundamental background remains unstable...
On Monday, gold is holding steady at around $3,300 amid a weaker dollar and caution among traders ahead of US-China talks and the release of US inflation data (CPI) on Wednesday. Strong NFP data for May strengthened the dollar and lowered expectations for a Fed rate cut. However, domestic problems in the US are putting pressure on the currency... Markets are adjusting positions ahead of CPI. Geopolitics and domestic unrest in the US are holding back gold's decline, despite possible optimism about a trade deal.
Technically, the trend is bullish, with the price previously breaking the structure but rising in the Asian session after a false breakdown of the order block and the 3300 liquidity zone. Further movement depends on 3330 - 3340
Resistance levels: 33301, 3339, 3375
Support levels: 3301, 3275
The price is heading towards 3330-3340 for a retest. If the dollar continues to decline and gold manages to consolidate above 3340, the bullish trend may continue. BUT! A false breakout of the 3330-3340 zone could trigger a further decline after the bullish structure breaks down.
Best regards, R. Linda!

$TEM to $100Target $100 this summer. Price is breaking out with a nice volume. $72 level is the main level to watch. Once we clear $72, $100 range is doable

Bitcoin Wave Analysis – 9 June 2025
- Bitcoin broke daily down channel
- Likely to rise to resistance level 110,000.00
Bitcoin cryptocurrency recently broke the resistance trendline of the daily down channel from May (which encloses the previous ABC correction 2 from the end of May).
The breakout of this down channel accelerated the active minor impulse wave 3 of the intermediate impulse wave (3) from the start of April.
Given the clear daily uptrend, Bitcoin cryptocurrency can be expected to rise to the next resistance level 110000.00 (which reversed the price in January and May) – the breakout of which can lead to further gains toward 115000.00.

"GBP/USD is cooking inside a trianglePair: GBP/USD
Timeframe: 4H
Strategy: Elliott Wave + Triangle Pattern + Breakout
Formation: Contracting Triangle – Wave 1 to 5
Risk-Reward: High Probability Setup
Status: Pre-breakout phase
🔍 Technical Breakdown:
A clean contracting triangle is forming, completing all 5 internal waves within the structure.
Wave 5 looks exhausted and price is rejecting trendline resistance.
Expecting a bearish breakout from the triangle.
Target zone = 1.34759, aligning with previous liquidity + measured move.
Entry area refined with supply zone + minor structure break (as seen in inset schematic).
🎯 Target: 1.34759
🛑 Stop Loss: Above triangle resistance
🟢 Entry Trigger: After breakout + retest or SMC confirmation
This setup matches Elliott Wave’s triangle structure behavior – typically occurring before the final push in a larger correction or continuation.

AUDJPY: Consolidation is Over!🇦🇺🇯🇵
AUDJPY is completed a consolidation, violating
a resistance of a horizontal range on a daily.
The price will most likely continue rising and reach 95.0 level soon.
❤️Please, support my work with like, thank you!❤️

BTC on the riseThere is no correction at this point; BTC wants to go higher. The next resistance lies around 109k.

Is WLDUSDT Preparing for a Nasty Reversal?Yello, Paradisers! Have you been watching WLDUSDT creeping upward inside that nice channel and thinking this is a breakout in the making? Be careful. This setup might be laying a trap for overconfident bulls—and the signs are getting louder.
💎WLDUSDT is currently trading within an ascending channel, a structure that often signals weakening bullish momentum. The price is approaching a key resistance area, and what makes this zone even more dangerous is the confluence of bearish indicators stacked right on top of each other. We have the 200 EMA acting as dynamic resistance, the 0.618 Fibonacci retracement level overlapping perfectly, and a visible I-FVG (4H) in the same zone. This trio of signals significantly increases the probability of a strong bearish reaction.
💎If the price reacts from this resistance zone, performs an inducement move, and forms a clean bearish structure, we could be looking at a high-probability short opportunity. This would offer a solid risk-to-reward setup for those who are prepared and disciplined enough to wait for confirmation.
💎However, if the price breaks above the resistance and closes a full candle above it, then this bearish thesis will be completely invalidated. In such a scenario, it’s smarter to step back and wait for a clearer, more favorable structure to form. Chasing trades here would only increase the risk of getting caught on the wrong side of a fakeout.
🎖Discipline always wins in the long run, Paradisers. The market rewards those who wait for clean, high-probability setups — not those who trade based on FOMO. If you want to build long-term profitability, you must stay strategic, patient, and act only when everything aligns.
MyCryptoParadise
iFeel the success🌴
