NZDJPY: Move Up Ahead! 🇳🇿🇯🇵
There is a high chance that NZDJPY will continue rising.
I see a strong intraday bullish confirmation after a confirmed
breakout of a key daily horizontal resistance.
Next key resistance is 0.875
❤️Please, support my work with like, thank you!❤️
I am part of Trade Nation's Influencer program and receive a monthly fee for using their TradingView charts in my analysis.
Parallel Channel

TSLA: Uptrend channel bounce, trading between 50 and 200-day SMAHey guys/gals!
So we all know that Tesla took a massive drop last week. It fell about 14%, and was down even 3% after hours at one point. I think we can all agree this crash wasn't technicals driven - it was clearly headline impacted. This was a clear black swan even t, and even in my case, nothing like this has ever happened to me as a trader. It was unforeseeable, forced me to hedge overnight and I'm still having nightmares (lol). Definitely one to remember as I don't think something like this would happen with any other stock. Tesla is truly unique in this sense.
But looking at the bigger picture, the bounce that we experienced on Friday must've been technicals driven, and psychologically influenced, as I am almost certain that the crash was a massive overreaction. People woke up the next day and thought this was severely discounted over a couple social media tweets (I won't go into the politics of things).
As you see on the chart, Tesla may in a new upward channel. At first I figured this may be a bear flag, however due to the upcoming catalyst like the Robotaxi launch - this would likely only be a bear flag if prices crashes below the lower support trend line.
As long as price is within the channel, I'd say things are holding up. We'd likely see a jump towards the upper side of the channel - however it's important to note that $300 and £360 are major resistance points. Robotaxi launch and any future tweets will definitely move price, and I think those will be a factor in determining whether price goes up or crashes below the trend line.
Another thing to point out is that price is currently trading between the 50-day and 200-day moving averages. The 50-day SMA is acting as vital support, whereas the 200-day SMA is the resistance. If there is a break above the 200-day SMA, price will likely go higher. The opposite may happen if price crashes below the 50-day SMA.
Either way, headlines and technicals mentioned above will continue to influence price.
Note: not financial advice.

Crypto Total Market Cap – Bulls vs. Walls
🧪 1. 🐸 Miracle’s Take – The Meme Prophet Speaks!
“Wassup degenz! It’s ya boi Miracle again – and this chart’s juicier than a frog smoothie!”
Market just kissed the MA50 like it’s a long-lost love 💋… and BOOM — bounced back hard!
We’re climbing outta the bear channel like a true meme-warrior escaping rug hell 🧱
BUT... the resistance zone ahead (3.27T–3.32T) is like a fat whale sitting on top of the market 💀
A breakout above that and we go party at 3.48T, where the liquidity gods live 🎯
If we get slapped down though… Miracle sees a revisit to 3.2T support, where apes gather before launch 🦍
🔋 Momentum is here, but no confirmed breakout YET!
📢 Miracle’s Warning: “A trendline breakout without meme energy is just hopium with candles!”
💡 Miracle Watchlist:
✅ Break + Retest of resistance zone = GO LONG
❌ Rejection = scalp short back to MA
🔍 2. Unknown Analyst View – Clean & Technical
MA50 acted as a dynamic support and initiated a bounce.
Price is trying to break out of a descending channel, which has acted as a structure since late May.
Immediate resistance lies in the 3.27T–3.32T zone, which previously caused multiple rejections.
A confirmed breakout with volume and a successful retest of the resistance zone or MA50 could push us toward:
🎯 Target 1: 3.35T
🎯 Target 2: 3.48T (horizontal key resistance)
If rejected, we could slide back to the 3.20T support (yellow line) or even back into the bearish channel.
The market’s response to this zone will define the short-term trend.
"Observe the structure. Let price prove direction."
🎭 Two Faces. One Chart.
Who do YOU trust more today?
The meme-warrior 🐸 or the mystery tactician 🧠?
💬 Tell us in comments: #TeamMiracle or #TeamUnknown?
🎬 TradeWithMky – where altcoins speak louder than Bitcoin!
#CryptoCap #TotalMarketCap #AltseasonComing #TradeWithMky #CryptoAnalysis

TradeWithMky — Where Altcoins Speak Louder Than Bitcoin!Welcome, fellow trader, to TradeWithMky — the only TradingView realm where charts are alive, trendlines whisper secrets, and candles burn with prophecy.
Led by Miracle, the pepe-faced meme wizard of TA, we don’t just follow the market — we ride it like a shooting star across the altcoin galaxy 🚀.
💡 Here’s what you’ll unlock inside this spellbook of price action:
🌀 Magic Channels & Trend Spells
🔄 MA50 Rejections & Support Summons
📉 Fakeouts Exposed, Traps Uncovered
📈 Breakouts Blessed by Fibonacci Spirits
🧠 Deep-dive TA with a twist of humor, mystery, and meme-lore
From the shadows of fake breakouts to the light of uptrend awakenings, our charts tell stories — and you are the hero. Whether you're a seasoned wizard or a humble apprentice, here you’ll find something rare:
Real analysis. Real magic. Real fun.
🎯 Targets that work. Levels that matter. A vibe you won’t forget.
👉 Follow now and let Miracle show you why:
@TradeWithMky – Where Altcoins Speak Louder Than Bitcoin!
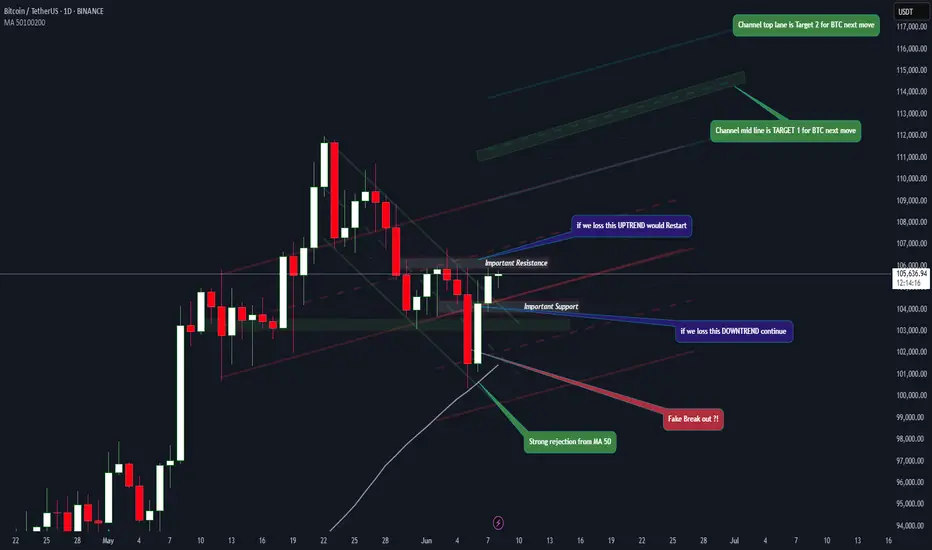

Bitcoin will continue to fall to support level in channelHello traders, I want share with you my opinion about Bitcoin. This chart shows how the price rebounded from the support line and started to grow. In a short time, it rose to the support level, which coincided with the buyer zone, and it even soon broke this level. Next, the price rose a little and then continued to move up, but later corrected the support line. After this, BTC rebounded and rose to the seller zone, breaking the 108800 resistance level. Then it rose a little more and turned around, and started to decline inside the downward channel. In the channel, price soon broke the 108800 level and continued to fall next. Later, Bitcoin broke the support line and fell almost to the support line of the channel, after which it turned around and made an upward movement. After this movement, Bitcoin dropped to the 100300 support level, after which it turned around and, in a short time, rose to almost the resistance line of the channel. Price didn't reach this line, turned around, and continued to fall in the channel. In my mind, Bitcoin can continue to move down top support level inside the downward channel. That's why my TP is 100300 level. Please share this idea with your friends and click Boost 🚀

GOLD (XAUUSD): Important Supports & Resistances for Next Week
Here is my latest structure analysis for Gold.
Vertical Structures
Vertical Support 1: Falling trend line
Vertical Support 2: Falling trend line
Horizontal Structures
Horizontal Support 1: 3231 - 3286 area
Horizontal Support 2: 3121 - 3177 area
Horizontal Resistance 1: 3372 - 3404 area
Horizontal Resistance 2: 3427 - 3423 area
Horizontal Resistance 3: 3492 - 3500 area
Consider these structures for pullback/breakout trading.
❤️Please, support my work with like, thank you!❤️
I am part of Trade Nation's Influencer program and receive a monthly fee for using their TradingView charts in my analysis.

DLF - Towards 580 - Triple top BreakdownDLF has shown Triple top breakdown and with this it will have following targets
Target1: 655
Target2: 580

BTC Short Setup! OB + Fair Value Gap + Trend Channel ConfluenceBitcoin (BTCUSD) | 30-Min Chart – High Probability Sell Setup
Bitcoin continues to respect bearish structure inside a descending trend channel, creating prime opportunities for Smart Money traders to strike at optimal levels.
🔍 Trade Breakdown:
Bearish Market Structure
Price is forming lower highs and lower lows
Channel structure is being respected with multiple taps on both the upper and lower bounds
Liquidity Sweeps & Internal Range
Multiple yellow-highlighted zones show liquidity engineering — both buy-side and sell-side have been swept
Recent sweep + demand failure confirms bearish intent
Premium Entry Zone Setup:
🔴 Order Block Zone (OB): 105,200 – 105,400
🟣 Fair Value Gap (FVG): Overlapping with OB – perfect imbalance correction
📐 Fib Levels:
61.8% = 104,987
70.5% = 105,298
79% = 105,388
🔺 This is the kill zone — premium retracement + inefficiency fill = high confluence
Bearish Continuation Expectation:
BTC likely to react at OB zone and continue bearish leg
Projection into discount fib levels:
-27% = 104,000
-62% = 103,800
-100% = 103,727
Channel Respect = Structure Confidence:
Every key swing is aligning with channel resistance/support
Blue arrow shows expected path: liquidity sweep ➝ OB/FVG tap ➝ drop to channel low
🧠 Chart Ninja Entry Plan:
🔹 Entry Zone 105,280 – 105,388 (OB + FVG + 70.5–79% Fib)
🔻 SL Above 105,400 (above OB)
📉 Target 103,727 (channel + -100% Fib extension)
⚖️ RRR Over 1:4 — sniper-grade RR setup
💬 Ninja Wisdom:
You're not chasing moves — you're waiting where liquidity pools.
Fair Value Gaps + OB + Trend Channels = institutional signature.
Trade like Smart Money. Let retail chase candles. 🥷💸
📍 Save this setup before the market plays out
🔁 Share your thoughts below – entry, TP, SL?
👣 Follow @ChartNinjas88 for more sniper BTC setups daily

DOGEUSDT major daily support ahead wait for pumpAs we can see price is near major daily support of 0.17$ and also previous time price was not able to break this channel resistance zone and started to see correction again and again but soon the channel upper side will break and price will manage to pump above 0.3$ and even 0.5$.
DISCLAIMER: ((trade based on your own decision))
<<press like👍 if you enjoy💚

BITCOIN → Correction. The hunt for liquidity...BINANCE:BTCUSDT.P is recovering after liquidity was captured in the 100K zone. Locally, the technical situation is controversial despite the global bullish trend
Bitcoin is changing its market character (106700) and breaking the bullish structure (103000) during a correction phase. As part of the downward momentum, the movement is testing liquidity below the 100700 support level. As for the liquidation, there are several reasons: the conflict between Trump and Musk, strangely enough, the market reacted with a fall; the liquidation of whales, history repeats itself...
Traders are buying back Bitcoin, but technically the market has a bearish structure. Locally, there is a bearish trend, and a countertrend correction, “liquidity hunting,” is forming.
Ahead lies a fairly important zone of 105900-106700. The initial retest may end in a false breakout, as there may not be enough potential for continued growth (after a strong buyback).
Resistance levels: 105,900, 106,720, 110,400
Support levels: 103000, 101400, 100K
After a correction from 105900, which could target half (0.5) of the trading range, the market may attempt to return to a bullish phase, provided that the bulls keep the price from falling and do not allow it to update local lows. That is, in the short term, I expect a decline from 105900 to 103000, but further, if the price starts to return to 105500-105900, there may be chances for growth to 110K
Best regards, R. Linda!

JINDAL STAINLESS Breaks the Channel – What’s Next?After completing a long WXY correction, Jindal Stainless has flipped into a strong uptrend. The price broke above the downtrend channel and also reclaimed the 200-day moving average — confirming strength.
The rally from 504 has unfolded as a nested 1-2, 1-2 impulse, and the wave 5 has now entered its 1 to 1.618 projection zone. We’re likely entering a blue Wave 4 pullback, especially as:
RSI shows bearish divergence
The rally looks stretched short-term
A healthy retracement toward the 661–640 zone can follow.
As long as 633.35 holds, this bullish structure remains intact.
Trend : Bullish
Retracement zone : 661.80 – 640.65
Invalidation : Below 633.35
This is a dynamic setup. Chart will be updated as price action unfolds
Disclaimer: This analysis is for educational purposes only and does not constitute investment advice. Please do your own research (DYOR) before making any trading decisions.

Ripple Analysis - What Shall we Expect !!!If the price can break through this channel's resistance, I expect it to reach $2.5 in a short time.
Stay Awesome , CobraVanguard

Euro will correct a little and then continue to move up nextHello traders, I want share with you my opinion about Euro. Observing this chart, we can see how the price entered to upward channel, where it at once dropped from the resistance line to the support line and then started to grow. In a short time price rose to the 1.1210 level, broke it, and even rose a little more, but soon turned around and declined to the support line of the channel. Then the Euro made an upward impulse, and then broke the 1.1210 level one more time and continued to grow inside the channel. Later price reached the resistance line of the channel and then corrected, after which, in a short time rose to the support area, breaking the 1.1400 level. But soon the price turned around and dropped to the 1.1210 level, thereby exiting from channel. Next, Euro continued to grow inside the wedge, where it rose to the current support level and soon broke it. After this, the price rose to the resistance line of the wedge and then corrected, after which it made an upward impulse. Price exited from the wedge, and now I think that the Euro can make a correction, after the rise, and then continue to grow next. That's why I set my TP at 1.1560 points. Please share this idea with your friends and click Boost 🚀
Disclaimer: As part of ThinkMarkets’ Influencer Program, I am sponsored to share and publish their charts in my analysis.

USDJPY: Bullish Outlook For Next Week Explained 🇺🇸🇯🇵
USDJPY completed a consolidation, violating
a resistance line of a horizontal range on a 4H time frame.
I believe that it provides a strong bullish confirmation signal.
The price will most likely go up and reach 146.0 level next week.
❤️Please, support my work with like, thank you!❤️
I am part of Trade Nation's Influencer program and receive a monthly fee for using their TradingView charts in my analysis.

XVG - Privacy is Important!Hello TradingView Family / Fellow Traders. This is Richard, also known as theSignalyst.
📈XVG has been overall bullish trading within the rising channel marked in blue and it is currently retesting the lower bound of the channel.
Moreover, the red zone is a strong structure.
🏹 Thus, the highlighted blue circle is a strong area to look for buy setups as it is the intersection of structure and lower blue trendline acting as a non-horizontal support.
📚 As per my trading style:
As #XVG approaches the blue circle zone, I will be looking for bullish reversal setups (like a double bottom pattern, trendline break , and so on...)
📚 Always follow your trading plan regarding entry, risk management, and trade management.
Good luck!
All Strategies Are Good; If Managed Properly!
~Rich

DONEAR AT SUPPORT ZONE.This is the Weekly chart of DONEAR.
Donear is currently trading near its support zone in the ₹95–₹100 range.
The stock is trading within a larger pattern structure (broadening pattern) and is currently moving inside a smaller formation—an ascending channel (in DAILY timeframe) support at 103-105 range.
if this level is sustain ,then we may see higher price on ascending channel resistance at 130-135 range and long term resistance of the broadening pattern .........
Thank you !!!!

TopDown Market structure Analysisoverall bullish we may see some retracement before continuin Bullish higher, I see a new HH formed by breakin the previous HH on the weekly timeframe, the 4h timeframe is showin some correction move hence the trendline broken. waitn on monday moves for entry

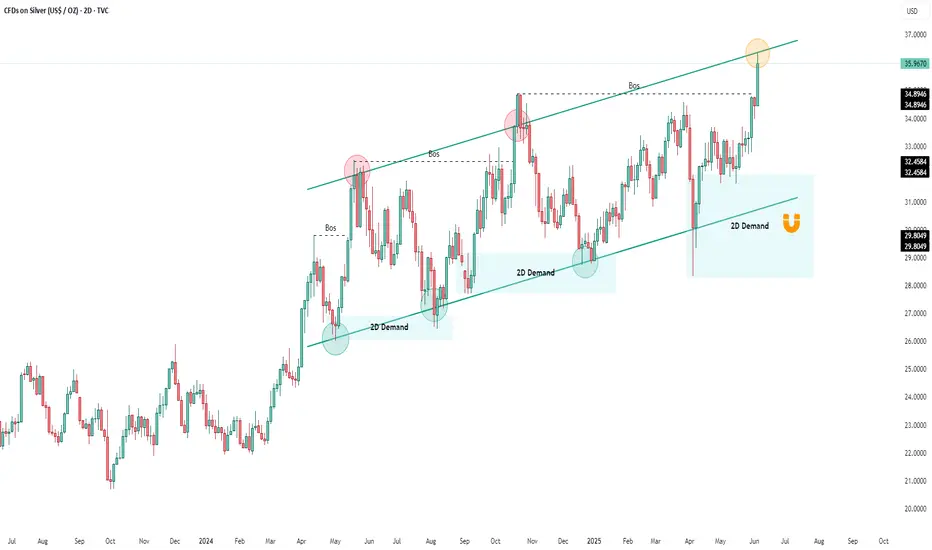
Silver Hits Upper Channel Limit — Momentum or Rejection Ahead?Silver has been following a textbook ascending channel since mid-2024, with multiple clean Breaks of Structure (BoS) confirming sustained bullish momentum. Every major correction found support at well-defined 2D demand zones, allowing bulls to re-enter with confidence.
Now, price has reached the upper boundary of the channel — a level that has historically triggered short-term rejections or profit-taking. The key question: is this a breakout or another fade from the highs?
From a macro perspective, silver’s strength has been supported by several drivers:
Renewed demand for hard assets amid persistent inflation expectations.
Falling real yields and a weakening USD in recent months.
Positioning as both an industrial metal and a monetary hedge — giving silver dual tailwinds during reflationary narratives.
If Silver breaks and holds above this channel, it could trigger a new leg higher, potentially targeting $37 to $40. There’s little technical resistance above.
However, a rejection from the current level could open the door for a pullback toward the $34–33 region, or deeper into the key 2D demand zones near $31 and $29.80. These areas have acted as major accumulation zones in the past and may attract buyers again.
This is a technically and macroeconomically critical zone — the reaction here could define Silver’s next multi-week trend.
3-Year Range Broken — Gold/Silver Ratio Retesting Critical ZoneContext:
For more than three years, the Gold/Silver ratio traded within a predictable range between approximately 79 and 92. This provided consistent opportunities to rotate between metals: buying Gold when the ratio approached the bottom of the range, and favoring Silver when Gold became relatively expensive near the top.
Breakout and Failure:
In March 2025, the ratio broke out sharply above the 92 ceiling, reaching above 105 for the first time in years. This breakout was driven by macro uncertainty and a surge in demand for Gold as a safe haven. However, the move quickly lost momentum. As risk appetite returned and macro concerns faded, the ratio dropped aggressively, falling back below the former breakout zone.
Current Setup:
Price is now testing the 90–92 region — the same area that acted as resistance for years. This zone is now functioning as key structural support. Its behavior here could determine the next major leg.
Trading Outlook:
If the ratio holds above 90, Gold may continue to outperform Silver, possibly establishing a new higher range between 90 and 105. However, a decisive break below 90 would indicate a failed breakout and may favor Silver strength, with downside potential back toward the 80–85 area.
Conclusion:
This is a technically critical zone. A confirmed hold or breakdown from here could define the next multi-week trend in the precious metals space.

GOLD → Intra-range strategy. Waiting for NFPFX:XAUUSD remains consolidated in the 3340-3391 range. The price is stuck in the middle of the range due to the uncertainty created by upcoming unemployment news...
On Friday, gold rose slightly, remaining within the range ahead of important US employment data (NFP), which could set the direction for the market. Optimism over the US-China deal and profit-taking on the dollar are supporting the USD, holding back gold's rise. A weak NFP (less than 100,000) will reinforce expectations of a Fed rate cut and support gold. A strong report (above 200,000) will have the opposite effect. The probability of a rate cut in September is 54%.
Technically, on the daily timeframe, the market structure is bullish. After a sharp breakout of resistance and a new high, the price is consolidating above the upward trend line, forming a plateau in the 3300-3340 zone. Another shakeout from support is possible before the trend resumes
Resistance levels: 3375, 3391, 3414
Support levels: 3339, 3331
Forming a price forecast ahead of news, especially ahead of NFP, is a thankless task. Therefore, it is advisable to wait for the news and monitor the price reaction. A retest of the consolidation boundary and a rebound are possible. There is a chance that the price will remain in consolidation until next week, but again, it all depends on the fundamental background...
Best regards, R. Linda!

USDCAD → One step away from distributionFX:USDCAD is recovering amid the dollar's growth. Unemployment news is ahead. A return of the price to the buying zone may support the currency pair.
Against the backdrop of the dollar's growth, a change in the market phase is forming (unconfirmed). The price has stopped updating lows and is forming an eql, from which it is breaking out of the downtrend. The initial retest of liquidity at 1.366 may end in a correction. However, a quick retest and consolidation of the price above the level will confirm the change in sentiment
Resistance levels: 1.3686, 1.3732
Support levels: 1.3675, 1.366
Despite the fact that the price broke the downward resistance, the currency pair is still under pressure from sellers who are waiting for the price to fall from 1.3686. A breakout, a change in market sentiment to bullish, and consolidation above 1.3675-1.3686 will confirm readiness for a recovery. Zones of interest: eqh 1.3732
Best regards, R. Linda!

BTCUSDT reversal is not yet complete -> 95k???Despite yesterday's mini-dump, which initially appeared to be the right shoulder of the head and shoulders breaking out, the immediate retracement means the trading range sits within the range seen in the left shoulder.
We are still inside the incomplete head and shoulders pattern, and a bearish parallel channel.
If the price breaks out to the downside of the channel and the left shoulder range, the target for the retracement would be the same as the distance from the head to the neckline of the H&S pattern (y). This puts it inside the support zone of the 78.6% fib level of the continuation of the swing in the head of the pattern, at ~95k.
If the bulls thought they're through worst of it, the pain may not have even begun yet.
Even breaking out of the parallel channel might not be enough. The only thing that would signal the failure of the head & shoulders pattern is a new ATH, and that would need to happen quickly to save BTC from further falls.
